Texans DeskTexans offense posts its best EPA per play of the year in Week 912 min ago
 Rams DeskRams pass on 58% of early downs again after a 41% week, and Puka Nacua feeds on it13 min ago
 InjuryGarrett Wilson: Questionable → Out14 min ago
 Panthers DeskCarolina's offense rebounds in Week 9 after two negative-EPA games22 min ago
 Falcons DeskFalcons' eighth-ranked run game has slipped as the offense sits 25th23 min ago
 InjuryDenzel Boston: Active → Questionable29 min ago
 Eagles DeskEagles run defense ranks 31st while the offense stalls at a 24% success rate32 min ago
 Commanders DeskCommanders pass on 66% of early downs in Week 9 and the offense slides to -0.177 EPA a play33 min ago
 Baltimore RavensMailbag: Will Jacoby Brissett Turn the Ravens' Season Around?
 Buccaneers DeskBuccaneers defense leads the league in EPA allowed while the passing game ranks 30th42 min ago
 Bears DeskBears pass on early downs 64% in Week 9 and the offense stalls43 min ago
 San Francisco 49ersWays to Watch and Listen: 49ers vs. Cowboys | Week 10
 Pro Football RumorsColts Designate DE Arden Key For Return
 New York GiantsArvell Reese named NFC Defensive Player of the Week
 Buffalo BillsBills roster moves Nov. 11
Week 1 · 2026Packers 22 · 39 Vikings
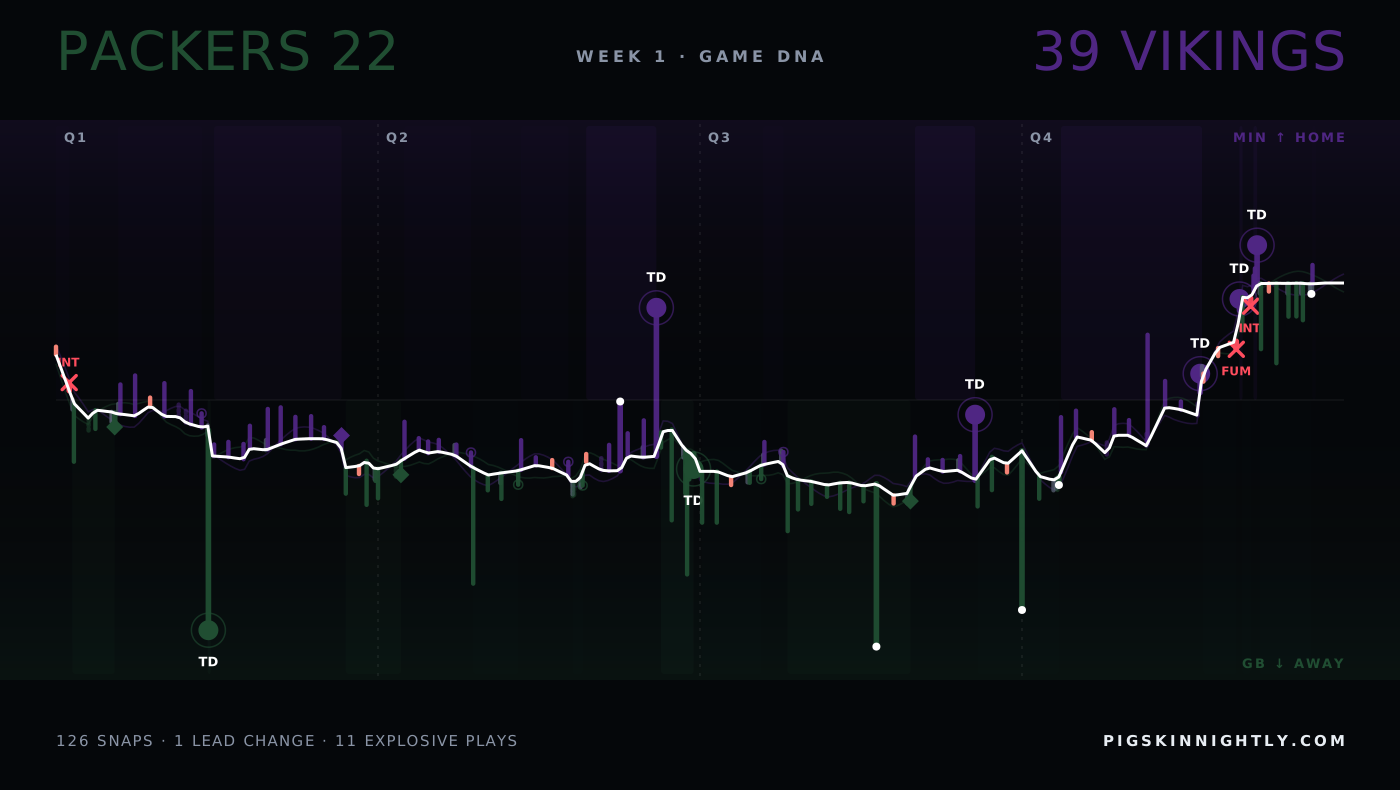
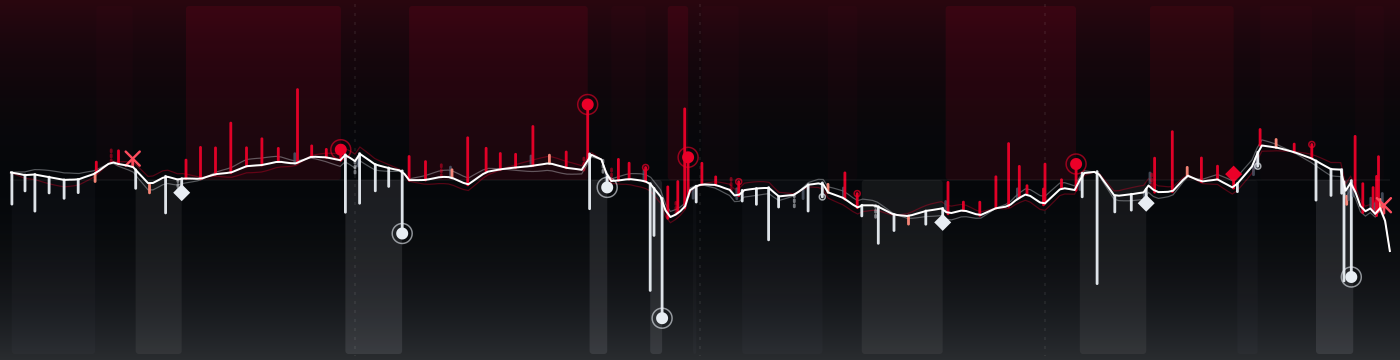
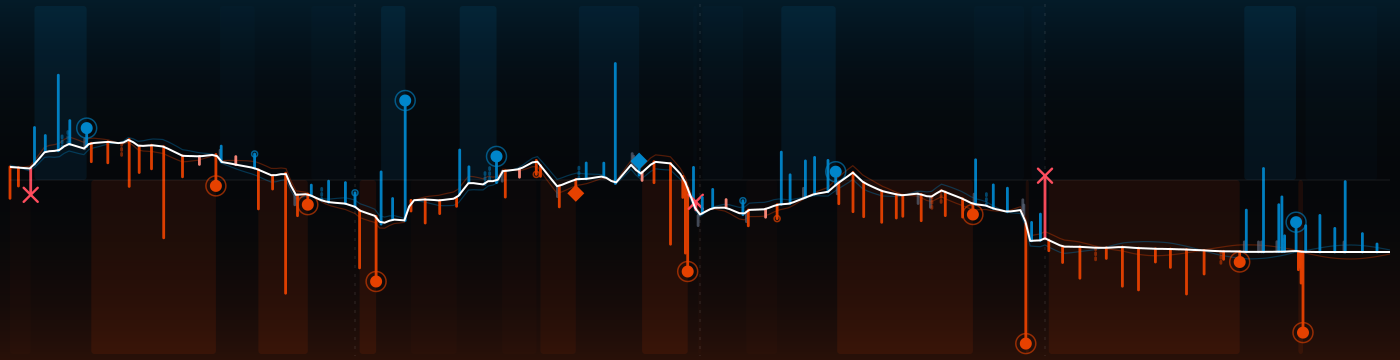
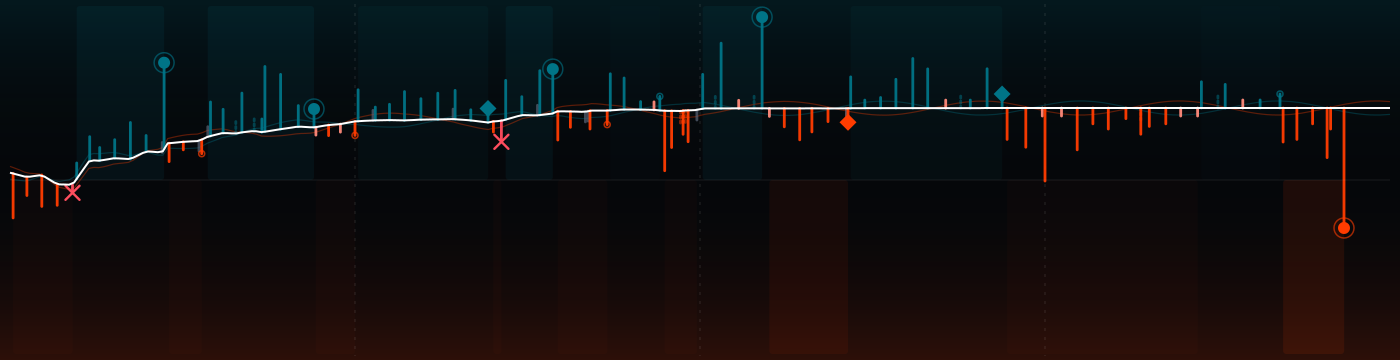
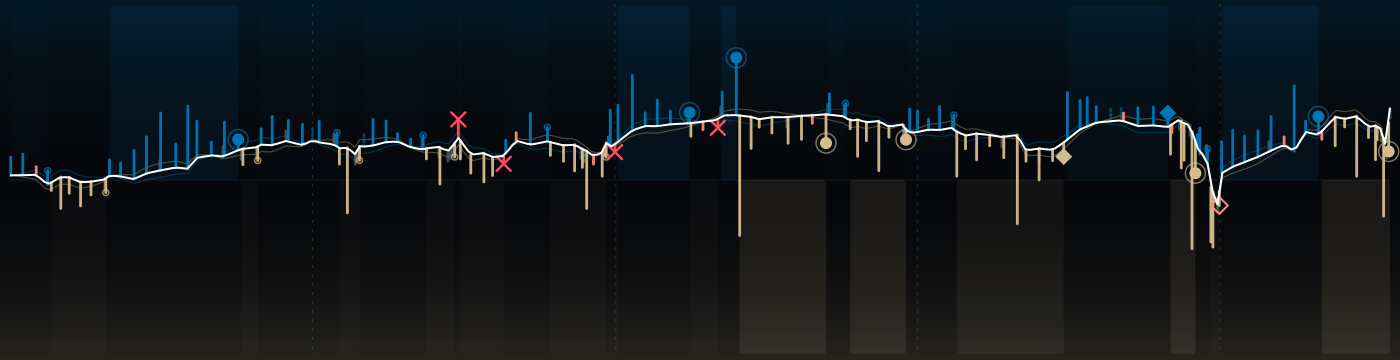
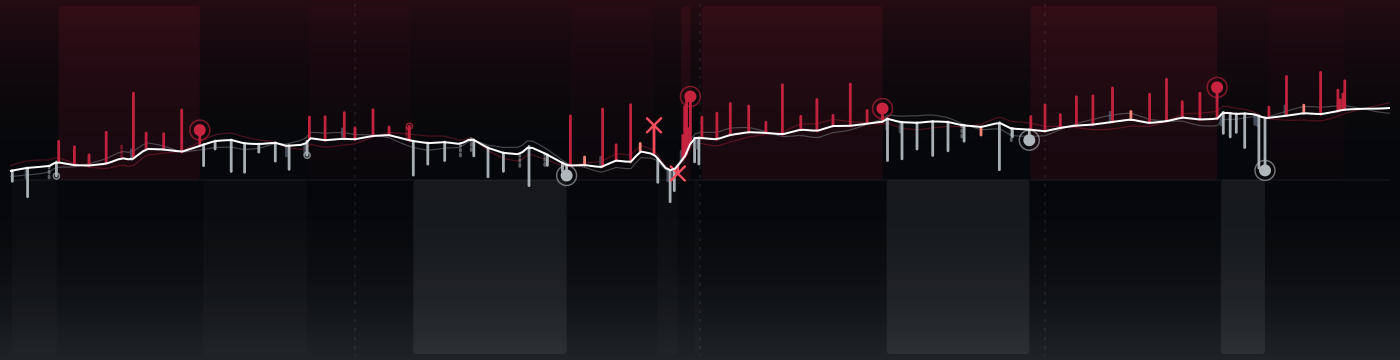
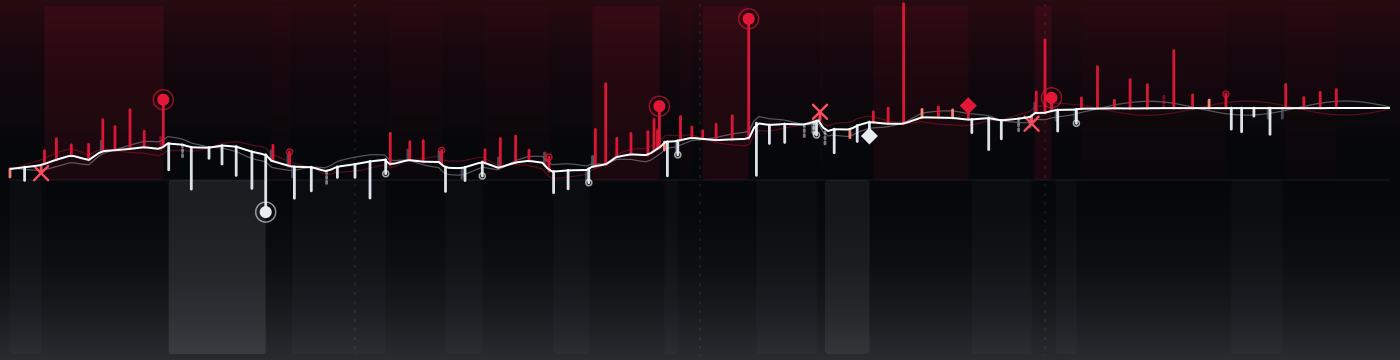
149 plays, one strand. Vikings won after 1 lead change; Packers peaked at 91% to win, Vikings at 100%. The white spine is the win probability, every rung a snap: up for MIN, down for GB, as long as the yards it gained.
↳Bottom line1 lead change; Packers peaked at 91% to win, Vikings at 100%.
?How to read this chart
- Read it left to right:
- kickoff on the left, final whistle on the right.
- The white line
- is the chance that Vikings win, play by play. High = MIN in control, low = GB in control, the middle is a coin flip. Each crossing of the middle is a change in who was more likely to win.
- Each little bar is one play:
- up for MIN on offense, down for GB; the longer the bar, the more yards. The key under the picture explains the marks (touchdown, turnover, field goal, punt).
 Vikings ↑
 Packers ↓
The strands compared
?How to read this chart
- Each row compares the two teams
- on one stat: GB on the left, MIN on the right. The longer bar is the bigger number.
- Explosive plays
- are long gains (big runs and passes). Peak win prob. is the highest chance to win each team reached at any moment.
Every possession
?How to read this chart
- Each tile is one possession,
- in game order, colored by the team that had the ball.
- Inside:
- the team, how it ended (TD = touchdown, FG = field goal, INT = interception, FUM = fumble, otherwise punt or downs) and the yards gained. Brighter tiles are drives that scored.
The plays that moved it most
↳Bottom lineThe biggest swing: play 1, 4.1 expected points against Vikings.
?How to read this chart
- The strip is the game clock;
- each numbered dot is one of the plays below, placed when it happened and colored by the team on offense.
- EP (expected points)
- is how many points the play added to (+) or took away from (−) the offense's expected score. +3.5 EP is worth more than a field goal; big minus numbers are usually turnovers.
- 1Q1 14:23 · MIN · Interception−4.1 EP
1-K.Murray pass deep right intended for 14-J.Jennings INTERCEPTED by 25-K.Nixon [44-Z.Franklin] at GB 36. 25-K.Nixon to GB 47 for 11 yards (
- 2Q1 7:54 · GB · Touchdown+7.0 EP
10-J.Love pass deep middle to 9-C.Watson for 81 yards, TOUCHDOWN. MIN-2-I.Rodgers was injured during the play.
- 3Q2 2:02 · MIN · Touchdown+3.8 EP
11-C.Wentz pass deep left to 18-J.Jefferson for 39 yards, TOUCHDOWN. Penalty on GB-90-L.Van Ness, Defensive Offside, declined.
- 4Q4 15:00 · GB · Completion+3.5 EP
10-J.Love pass deep middle to 0-M.Golden to MIN 26 for 42 yards (44-J.Metellus).
- 5Q4 13:17 · GB · Run−4.3 EP
10-J.Love right guard to MIN 17 for no gain (97-D.Orange). (Virtual Measurement).
- 6Q4 5:01 · GB · Fumble lost−5.8 EP
10-J.Love sacked at GB 11 for -12 yards (sack split by 43-A.Van Ginkel and 51-B.Cashman). FUMBLES (43-A.Van Ginkel) [51-B.Cashman], RECOVERE
- 7Q4 4:21 · GB · Interception−6.6 EP
10-J.Love pass short middle intended for 9-C.Watson INTERCEPTED by 23-J.Pierre (22-H.Smith) at GB 42. 23-J.Pierre pushed ob at GB 14 for 28
- 8Q4 1:31 · GB · Incomplete−3.7 EP
10-J.Love pass incomplete short middle to 23-S.Moore.
The one play that could have changed it
?How to read this chart
- The line is win probability
- over the game (top = home team ahead). The dot marks the one play that could have gone either way; the big % is the losing team's chance right after it.
- Press Flip it
- to see where that chance would have gone if the play had gone the other way. Only that instant is priced: the rest of the game never happened.
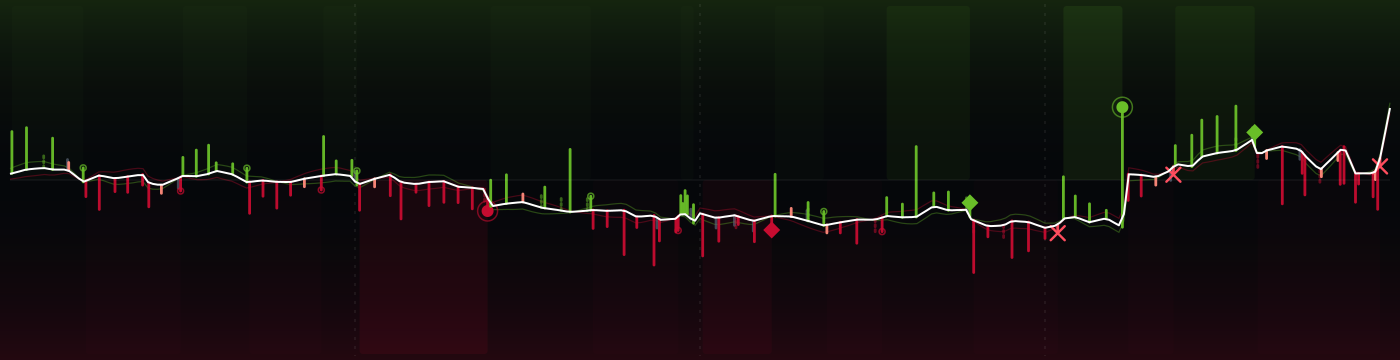
If the Packers had converted that fourth-and-1
Q4 13:17 10-J.Love right guard to MIN 17 for no gain (97-D.Orange). (Virtual Measurement).
 10@13




 30@31

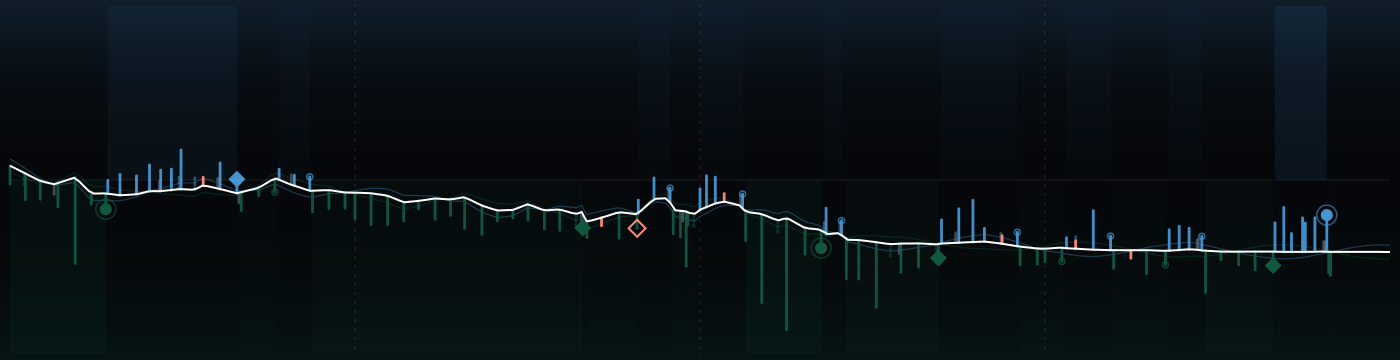

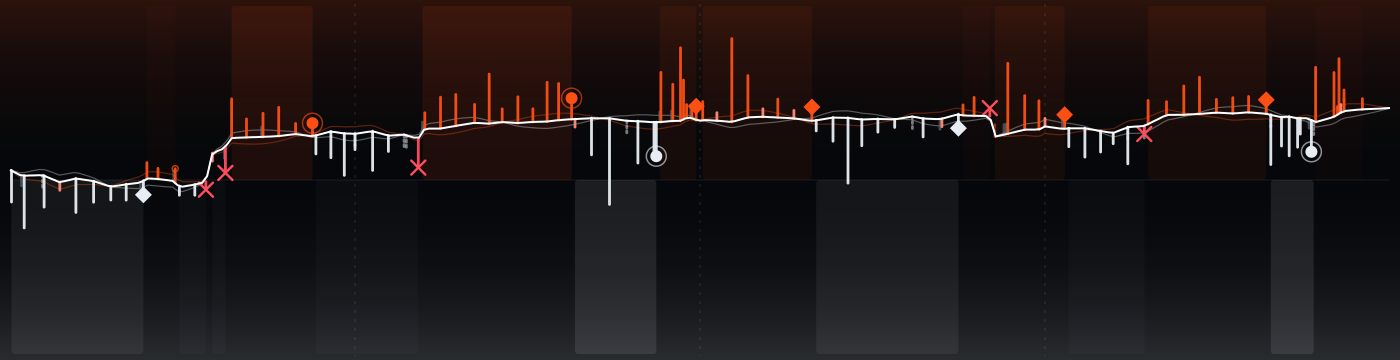

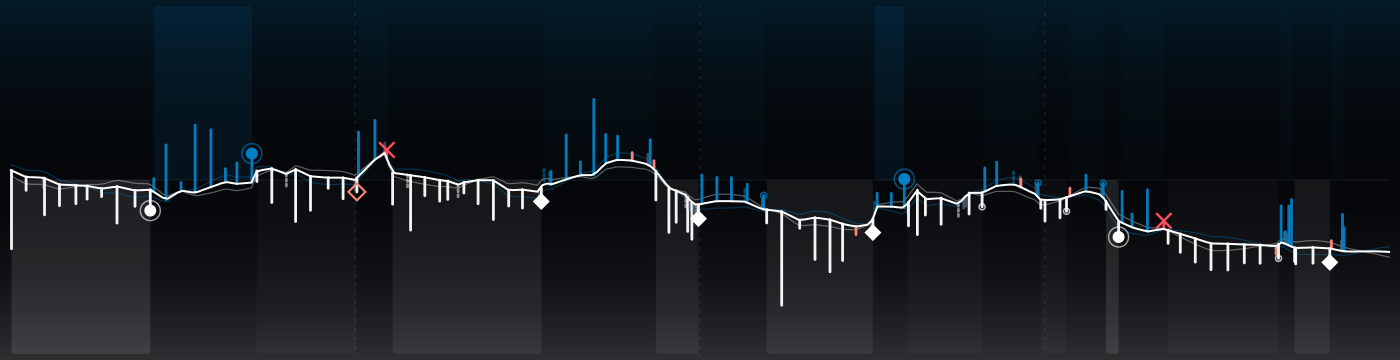
 26@14

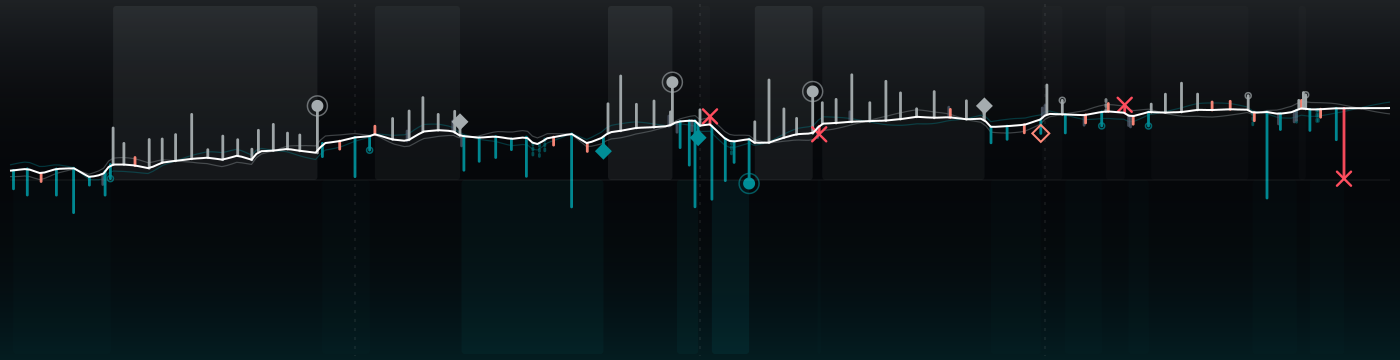
 13@27


 20@28
 10@31