 ESPNFantasy buzz: James Cook III helps Bills overcome tough Vikings defense
 Detroit LionsTWENTYMAN: 5 stats that stand out following Lions' Week 9 victory
 ESPNSeven things Solak thinks for NFL Week 10: Jaguars trades, All-Pro picks, more
 New York GiantsGiants Now: Michael Strahan offers high praise of Arvell Reese
 Philadelphia EaglesAAA Official Review: What did the Eagles, Joe Milton learn from the QB's first start?
 ESPNVikings left at QB crossroads after Carson Wentz's poor MNF showing vs. Bills
 Broncos DeskBroncos are 7-2, but the snaps say 4.1 wins and the 11th seed in the conference6 h ago
 Pro Football RumorsSeahawks Interested In Adding WR Depth

Over the last 4 games the offense has posted a 56.1% success rate (237 plays), 1st among 32 teams over their own last 4. In the 4 games before: a 44.9% success rate (247 plays), 13th.
Season EPA ranks ↓▼Emerging problemDefensesuccess rate allowed9th→26thOver the last 4 games the defense has allowed a 46.5% success rate (256 plays), 26th among 32 teams over their own last 4. In the 4 games before: a 41.9% success rate (236 plays), 9th.
Season EPA ranks ↓⇄Usage shiftBryan Cook, Sdefensive snap share59%→97%Bryan Cook has played 97% of defensive snaps over the last 4 games, up from 59% in the 4 games before. On the field in 4 of 4 and 3 of 4; a game without a snap counts as zero.
Snap counts, week by week ↓The Cincinnati Bengals are 6-2 in the 2026 season, 1st in the AFC North and the No. 6 seed in the AFC, with a point differential of +65. On offense they rank 3rd in the league in EPA per play (+0.142); on defense they rank 18th (+0.005 allowed). The Pigskin Nightly model gives them a 97% chance to make the playoffs and 6.8% to win the Super Bowl. The Cincinnati Bengals play next at home against the Pittsburgh Steelers on Sun, Nov 15, 8:20 PM ET (Week 10), on NBC.
What is the Cincinnati Bengals record?
6-2, 1st in the AFC North. Home 2-1, road 4-1, division 1-1, conference 4-2, current streak W4. Points: 240 scored, 175 allowed.
Who do the Cincinnati Bengals play next?
The Cincinnati Bengals play next at home against the Pittsburgh Steelers on Sun, Nov 15, 8:20 PM ET (Week 10), on NBC.
What are the Cincinnati Bengals' playoff chances?
97% to make the playoffs, 63% to win the AFC North, 10% to earn the No. 1 seed and the bye, 13.2% to win the AFC and 6.8% to win the Super Bowl, from 10,000 simulations of the rest of the season (projected record 12.2-4.8).
Who is the Cincinnati Bengals starting quarterback?
Joe Burrow is first on the Bengals depth chart at quarterback, with Joe Flacco behind.
Who is injured for the Cincinnati Bengals?
Out, doubtful or on injured reserve: Kyle Dugger (S, out, quadriceps), Andrei Iosivas (WR, injured reserve, thumb), Cashius Howell (DE, injured reserve, wrist) and Erick All Jr. (TE, injured reserve, knee - acl).
How good is the Cincinnati Bengals offense and defense?
Offense: 3rd in EPA per play (+0.142), 3rd on dropbacks, 18th on runs, success rate 50.4%. Defense: 18th in EPA allowed (+0.005), 14th against the pass, 24th against the run.
Cite this page
Pigskin Nightly, “Cincinnati Bengals 2026: record, EPA, depth chart and injuries”, https://pigskinnightly.com/teams/bengals (updated 2026-11-10).
From the Bengals Desk
Open the desk →

 Line CIN -3.5
The Wire
- Cincy JungleBengals Tuesday Trenches: Super in Spain, SNF and moreNov 10, 7:00 AM ET
- Cincy JungleThe Good, The Bad and The Ugly in Bengals’ 34-17 win over Falcons in MadridNov 10, 6:30 AM ET
- Cincy JungleBengals News: NFL Trade Deadline DayNov 10, 6:00 AM ET
- Pro Football Rumors2026 NFL TradesNov 10, 12:18 AM ET
The Bengals, judged from every snap
Looking back, not ahead. Deserved wins grade how well a team has played, from every snap of the games already played. They are not a forecast of the games to come. How well they hold up
0.0 luck wins · 16th luckiest in the NFL · net EPA per snap 6th
Bars: deserved win probability, from the snaps50% line
↳Bottom linerobbed in 1 of 8.
?How to read this chart
- The track:
- solid dot = real wins, ring = deserved wins (the record the snaps earned), on a scale from 0 to 8 games. The colored gap between them is the luck.
- The strip:
- one tile per game, oldest first, with the opponent and the score. The bar is how often the Bengals would win a replay of the same snaps; above the middle line they deserved to win.
- The label:
- Earned or Fair loss = the result matched the play; Coin flip = it could have gone either way; Lucky / Robbed = the result went against the play.
Bengals earned it: the snaps said Bengals by 10.2, a deserved win probability of 97%.
The lab file
The season, week by week
Offense EPA/playDefense EPA prevented W33-27Wk 2@
 W20-6Wk 3@
 L27-30Wk 4vs
 L17-22Wk 5@
 W31-24
 W35-13Wk 8vs
 W43-36Wk 9@
 W34-17Wk 10vsNov 15Wk 11@
 Nov 23Wk 12vs
 Nov 29Wk 13@
 Dec 6Wk 14vs
 Dec 13Wk 15@
 Dec 20Wk 16@
 Dec 27Wk 17vsDec 31Wk 18vsJan 10
Bars above the line are good: offense adding expected points, defense taking them away. The middle line is league average zero.Rest days and miles traveled, all 32 →
The road ahead
Playoff odds, all 32 →
Where the Bengals stand
Defense
Pass rate over expected: +8.1% (1st most pass-heavy given down, distance and score). 484 offensive plays logged.
Fantasy points allowed per game: QB 18.5 (14th most) · RB 21.9 (15th most) · WR 31.3 (18th most) · TE 15.8 (8th most). Defense vs position
Who produces
EPA from the nflverse play-by-play model Quarterback · 322 dropbacksJ.Burrow+0.261EPA / dropback+9.7CPOE7.5aDOT55%success
| Rushing | Car | Yds | TD | EPA/car | Success |
|---|---|---|---|---|---|
| C.Brown RB | 103 | 397 | 1 | -0.15 | 38% |
| S.Perine RB | 46 | 179 | 1 | -0.04 | 43% |
| J.Burrow QB | 8 | 20 | 2 | +0.29 | 88% |
| Targets | Tgt | Target share | Air share | aDOT | Yds | TD | EPA/tgt |
|---|---|---|---|---|---|---|---|
| J.Chase WR | 73 | 25% | 34% | 10.1 | 647 | 7 | +0.56 |
| T.Higgins WR | 68 | 23% | 40% | 13.0 | 758 | 6 | +0.82 |
| C.Brown RB | 45 | 16% | -2% | -0.8 | 207 | 0 | -0.29 |
| D.Meyers WR | 26 | 9% | 7% | 5.8 | 222 | 0 | +0.18 |
| M.Gesicki TE | 26 | 9% | 12% | 10.5 | 252 | 6 | +0.74 |
| S.Perine RB | 11 | 4% | 1% | 1.3 | 70 | 1 | +0.42 |
| E.All TE | 9 | 3% | 1% | 1.8 | 56 | 0 | +0.34 |
| M.Tinsley WR | 9 | 3% | 5% | 11.9 | 60 | 0 | -0.34 |
| Offense | 1 | 2 | 3 | 4 | 5 | 7 | 8 | 9 |
|---|---|---|---|---|---|---|---|---|
| Orlando Brown Jr.T | 100 | 100 | 100 | 100 | 100 | 100 | 100 | 100 |
| Dalton RisnerG | 100 | 100 | 100 | 100 | 100 | 94 | 100 | 100 |
| Ted KarrasC | 100 | 100 | 100 | 100 | 100 | 94 | 100 | 100 |
| Joe BurrowQB | 100 | 100 | 100 | 100 | 100 | 94 | 100 | 100 |
| Amarius MimsT | 100 | 95 | 100 | 100 | 95 | 94 | 100 | 100 |
| Dylan FairchildG | 100 | 100 | 100 | 100 | 100 | 100 | 100 | 98 |
| Ja'Marr ChaseWR | 94 | 88 | 100 | 20 | 89 | 87 | 96 | 84 |
| Tee HigginsWR | 72 | 72 | 93 | 79 | 69 | 87 | 88 | 68 |
| Drew SampleTE | 66 | 60 | 51 | 26 | 52 | 55 | 39 | 67 |
| Chase BrownHB | 72 | 70 | 70 | 79 | 60 | 75 | 69 | 63 |
| Mike GesickiTE | 33 | 35 | 51 | 62 | 45 | 38 | 68 | 47 |
| Dohnte MeyersWR | 16 | 18 | 56 | 89 | 29 | 38 | 59 | 42 |
| Samaje PerineHB | 28 | 40 | 32 | 36 | 51 | 23 | 35 | 40 |
| Jack EndriesTE | 2 | 17 | 16 | 30 |
| Defense | 1 | 2 | 3 | 4 | 5 | 7 | 8 | 9 |
|---|---|---|---|---|---|---|---|---|
| Barrett CarterLB | 100 | 100 | 100 | 100 | 100 | 94 | 100 | 100 |
| Jordan BattleS | 98 | 100 | 100 | 100 | 100 | 87 | 100 | 100 |
| Daxton HillCB | 100 | 99 | 100 | 100 | 97 | 94 | 87 | 98 |
| Bryan CookS | 100 | 100 | 34 | 97 | 94 | 99 | 98 | |
| DJ TurnerCB | 98 | 100 | 100 | 100 | 97 | 94 | 75 | 97 |
| Josh NewtonCB | 9 | 82 | 90 | |||||
| Myles MurphyDE | 60 | 56 | 73 | 67 | 68 | 60 | 77 | 87 |
| Boye MafeDE | 65 | 71 | 74 | 84 | 74 | 79 | 78 | 81 |
| Demetrius KnightLB | 89 | 90 | 90 | 74 | 83 | 73 | 84 | 69 |
| Dexter LawrenceDT | 61 | 64 | 79 | 77 | 65 | 63 | 71 | 69 |
| Jonathan AllenDT | 56 | 65 | 76 | 70 | 56 | 61 | 55 | 63 |
| B.J. HillDT | 42 | 48 | 51 | 39 | 42 | |||
| Tedarrell SlatonDT | 37 | 34 | 35 | 31 | 35 | 33 | 29 | 29 |
| Cedric JohnsonDE | 33 | 29 | 19 | 23 | 23 | 24 | 5 | 21 |
With / Without
All Bengals splits →Every Bengals starter has played every game with at least 25% of the snaps so far, so there is no "without" sample yet.
Never missed a game
Key Bengals starters who have taken the field in every game so far. A split appears here once one of them sits out a full game.
 Orlando Brown Jr.Tackle · 8/8 games100%
- Joe BurrowQuarterback · 8/8 games99%
 Barrett CarterLinebacker · 8/8 games99%
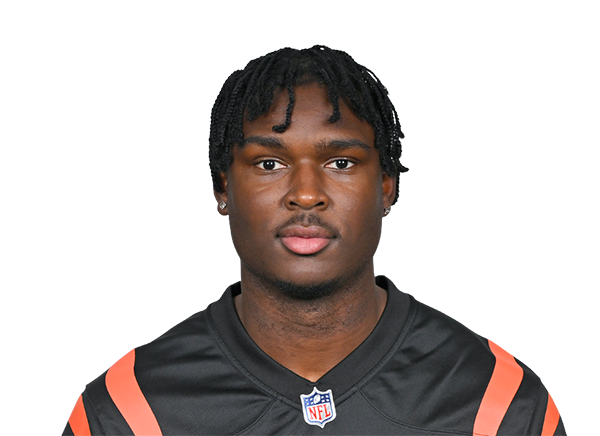 Jordan BattleSafety · 8/8 games98%
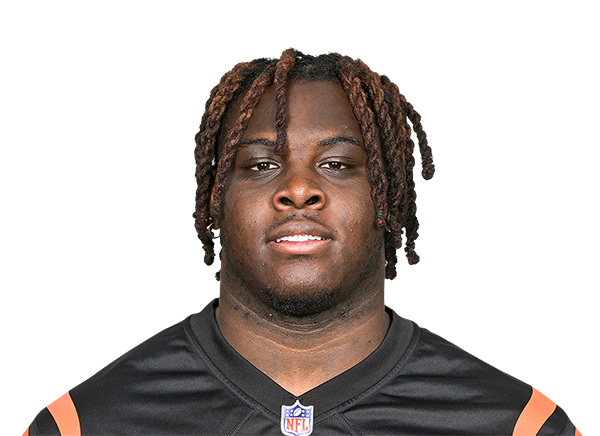 Amarius MimsTackle · 8/8 games98%
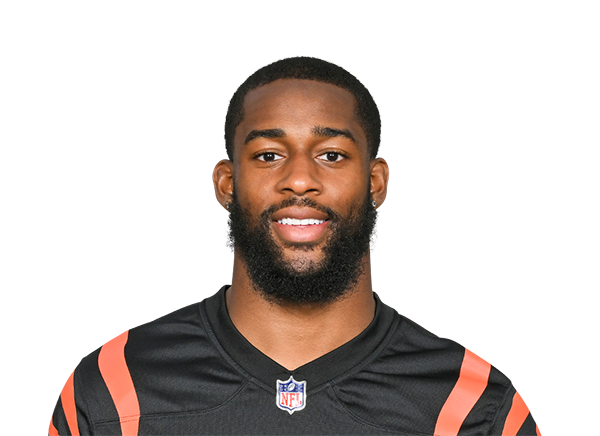 Dax HillCornerback · 8/8 games97%
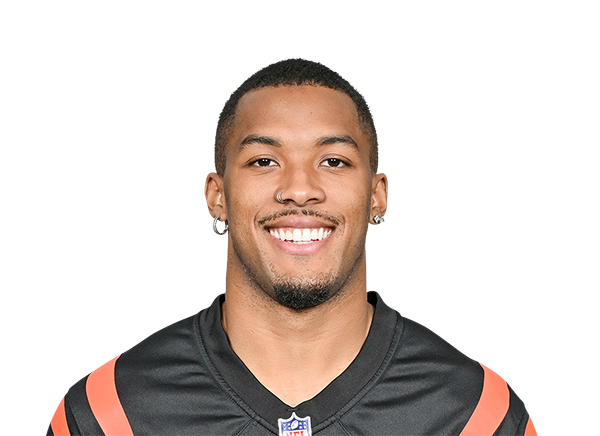 DJ Turner IICornerback · 8/8 games95%
 Ja'Marr ChaseWide receiver · 8/8 games82%
Bar = average share of his unit's snaps · all 14 starters →
Injury report
Whole leagueOut, doubtful or on IR
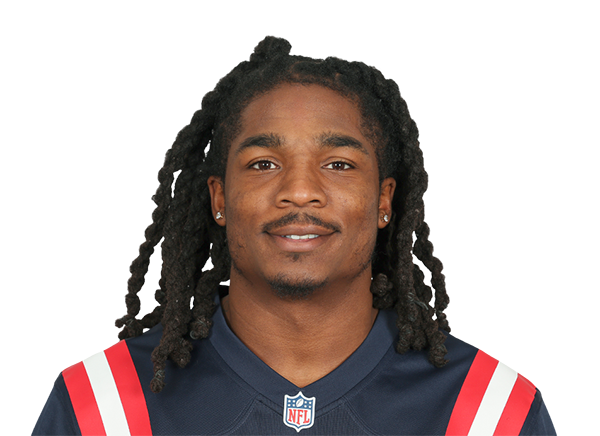 Kyle DuggerS · #29 · QuadricepsOut
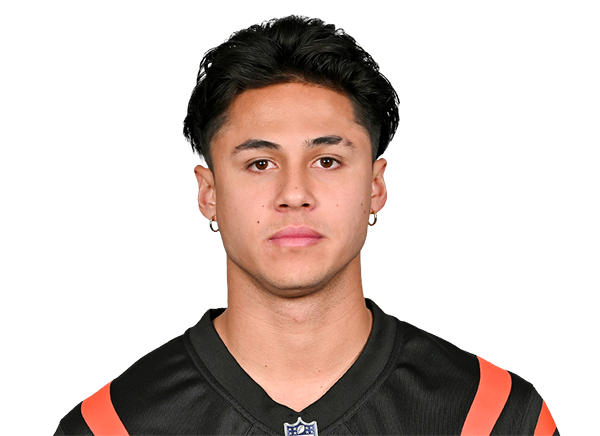 Andrei IosivasWR · #80 · ThumbIR
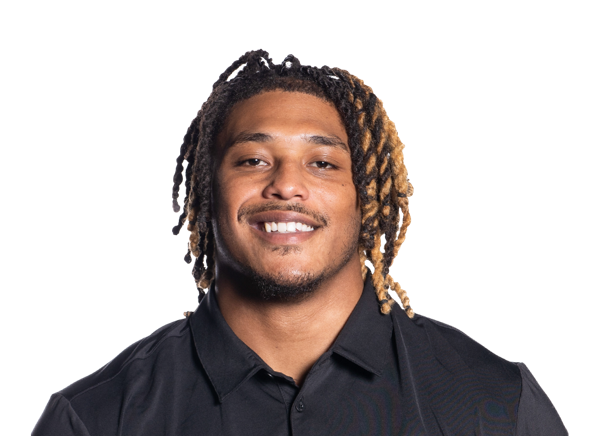 Cashius HowellDE · #55 · WristIR
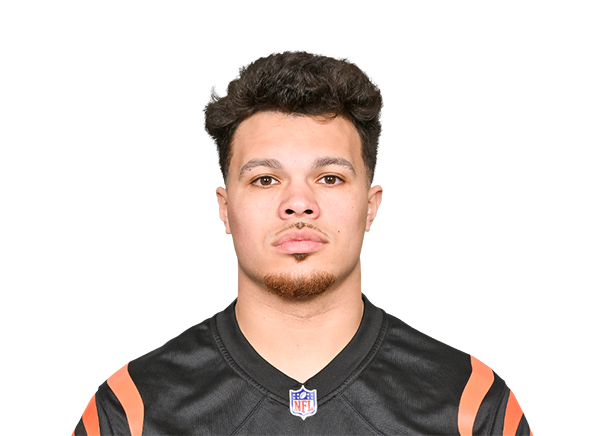 Erick All Jr.TE · #83 · Knee - ACLIR