EPA/play, better with
Opponents in the games with him were 8.3 pts weaker on average
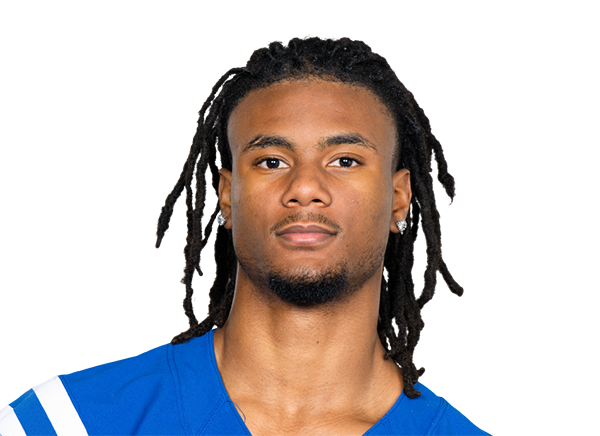
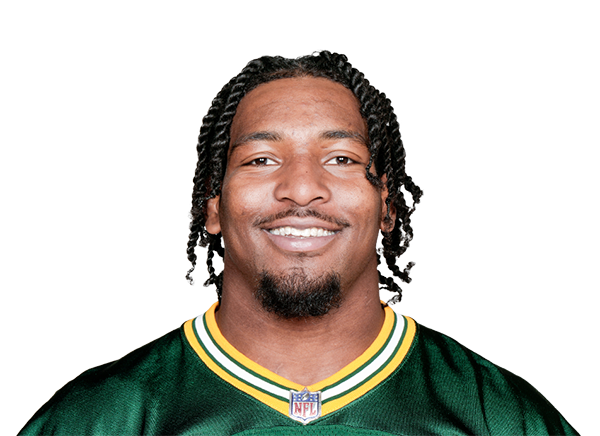
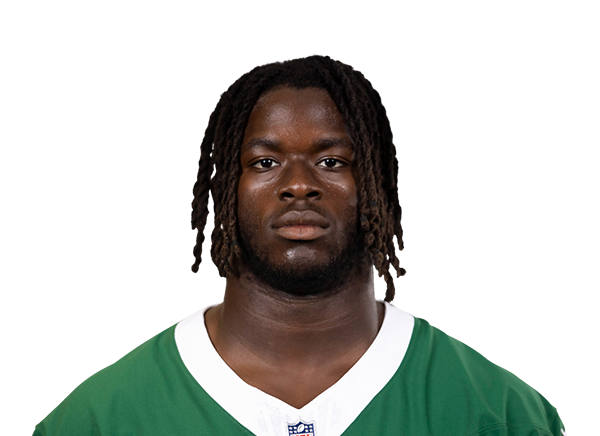
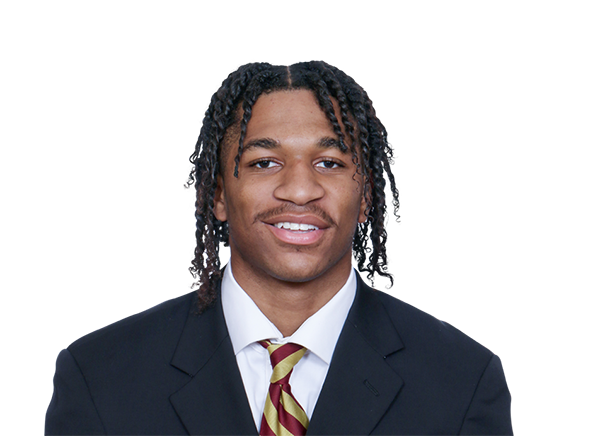
With games:Adonai Mitchell WR · 4/8, Mason Taylor TE · 2/8, David Bailey EDGE · 1/8, Kingsley Enagbare EDGE · 1/8
Before (Wks 5-8)+0.068→From Wk 9 on (Wk 9)-0.302
Over the last 4 games the dropback offense has posted +0.14 EPA per dropback (140 dropbacks), 8th among 32 teams over their own last 4. In the 5 games before: +0.04 EPA per dropback (173 dropbacks), 18th.
Season EPA ranks ↓▼Emerging problemDefenseEPA per play allowed3rd→31stOver the last 4 games the defense has allowed +0.16 EPA per play (251 plays), 31st among 32 teams over their own last 4. In the 5 games before: -0.06 EPA per play (312 plays), 3rd.
Season EPA ranks ↓⇄Usage shiftIsaiah Williams, WRoffensive snap share77%→28%Isaiah Williams has played 28% of offensive snaps over the last 4 games, down from 77% in the 5 games before. On the field in 4 of 4 and 5 of 5; a game without a snap counts as zero.
Snap counts, week by week ↓The New York Jets are 2-7 in the 2026 season, 3rd in the AFC East and the No. 12 seed in the AFC, with a point differential of -41. On offense they rank 14th in the league in EPA per play (+0.003); on defense they rank 22nd (+0.039 allowed). The Pigskin Nightly model gives them a 1% chance to make the playoffs and 0.0% to win the Super Bowl. The New York Jets play next at home against the Buffalo Bills on Sun, Nov 15, 1 PM ET (Week 10), on CBS.
2-7, 3rd in the AFC East. Home 1-3, road 1-4, division 0-2, conference 2-4, current streak L4. Points: 182 scored, 223 allowed.
The New York Jets play next at home against the Buffalo Bills on Sun, Nov 15, 1 PM ET (Week 10), on CBS.
1% to make the playoffs, 0% to win the AFC East, 0% to earn the No. 1 seed and the bye, 0.0% to win the AFC and 0.0% to win the Super Bowl, from 10,000 simulations of the rest of the season (projected record 5.6-11.4).
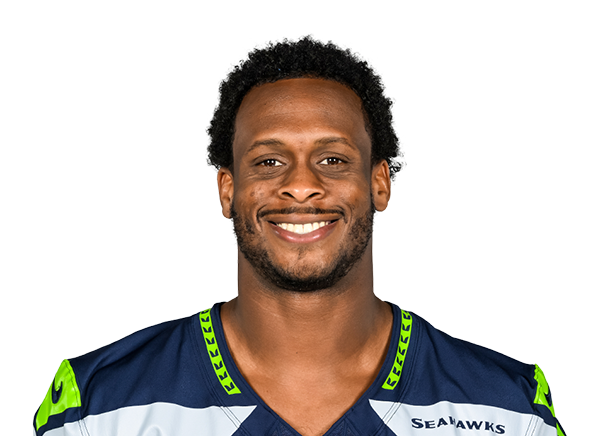
Geno Smith is first on the Jets depth chart at quarterback, with Cade Klubnik behind.
Out, doubtful or on injured reserve: Garrett Wilson (WR, out, concussion), Joseph Ossai (DE, out, ankle), Nahshon Wright (CB, out, back), Trevin Wallace (LB, out, groin), Max Mitchell (OT, injured reserve, concussion) and VJ Payne (S, injured reserve, knee).
Offense: 14th in EPA per play (+0.003), 14th on dropbacks, 20th on runs, success rate 45.0%. Defense: 22nd in EPA allowed (+0.039), 26th against the pass, 9th against the run.

Pigskin Nightly, “New York Jets 2026: record, EPA, depth chart and injuries”, https://pigskinnightly.com/teams/jets (updated 2026-11-10).
Looking back, not ahead. Deserved wins grade how well a team has played, from every snap of the games already played. They are not a forecast of the games to come. How well they hold up
−2.5 luck wins · unluckiest in the NFL · net EPA per snap 21st
Bars: deserved win probability, from the snaps50% line
↳Bottom linerobbed in 2 of 9.
Chiefs earned it: the snaps said Chiefs by 22.4, a deserved win probability of more than 99%.
Bars above the line are good: offense adding expected points, defense taking them away. The middle line is league average zero.Rest days and miles traveled, all 32 →
Pass rate over expected: -3.2% (21st most pass-heavy given down, distance and score). 525 offensive plays logged.
Fantasy points allowed per game: QB 18.0 (19th most) · RB 25.3 (9th most) · WR 28.5 (25th most) · TE 14.4 (14th most). Defense vs position
Quarterback · 313 dropbacksG.Smith+0.084EPA / dropback+4.2CPOE7.5aDOT47%success| Rushing | Car | Yds | TD | EPA/car | Success |
|---|---|---|---|---|---|
| B.Allen RB | 120 | 598 | 3 | -0.05 | 43% |
| B.Hall RB | 66 | 224 | 1 | -0.16 | 35% |
| I.Davis RB | 15 | 44 | 0 | -0.19 | 47% |
| Targets | Tgt | Target share | Air share | aDOT | Yds | TD | EPA/tgt |
|---|---|---|---|---|---|---|---|
| G.Wilson WR | 64 | 25% | 33% | 10.4 | 527 | 3 | +0.39 |
| A.Mitchell WR | 34 | 13% | 30% | 17.6 | 265 | 1 | +0.38 |
| K.Sadiq TE | 31 | 12% | 9% | 5.7 | 235 | 1 | -0.08 |
| M.Taylor TE | 26 | 10% | 11% | 8.7 | 147 | 2 | +0.21 |
| O.Cooper WR | 24 | 9% | 8% | 6.9 | 306 | 2 | +0.87 |
| B.Allen RB | 24 | 9% | 0% | -0.3 | 102 | 0 | -0.16 |
| I.Williams WR | 15 | 6% | 7% | 9.7 | 169 | 2 | +0.63 |
| B.Hall RB | 14 | 5% | -1% | -0.8 | 128 | 0 | +0.70 |
| Offense | 1 | 2 | 3 | 4 | 5 | 6 | 7 | 8 | 9 |
|---|---|---|---|---|---|---|---|---|---|
| Joe TippmannC | 100 | 100 | 100 | 100 | 100 | 100 | 100 | 100 | 100 |
| Olu FashanuOL | 100 | 100 | 100 | 100 | 100 | 100 | 100 | 100 | 100 |
| Geno SmithQB | 100 | 100 | 100 | 100 | 100 | 100 | 100 | 100 | 100 |
| Josh MyersC | 100 | 100 | 100 | 100 | 100 | 100 | 100 | 100 | 100 |
| Armand MembouT | 100 | 100 | 100 | 97 | 100 | 100 | 100 | 100 | 100 |
| Dylan ParhamOL | 100 | 100 | 58 | 100 | 100 | ||||
| Adonai MitchellWR | 69 | 82 | 44 | 61 | 89 | ||||
| Omar CooperWR | 7 | 82 | 64 | 78 | 86 | ||||
| Mason TaylorTE | 66 | 46 | 59 | 55 | 63 | 61 | 63 | ||
| Isaiah WilliamsWR | 60 | 82 | 89 | 94 | 61 | 15 | 22 | 16 | 60 |
| Braelon AllenRB | 40 | 31 | 52 | 94 | 86 | 87 | 78 | 83 | 59 |
| Kenyon SadiqTE | 42 | 36 | 58 | 69 | 19 | 35 | 37 | 48 | 57 |
| Breece HallRB | 58 | 65 | 48 | 43 | |||||
| Jeremy RuckertTE | 43 | 34 | 42 | 44 | 33 | 23 | 39 | 27 | 19 |
| Defense | 1 | 2 | 3 | 4 | 5 | 6 | 7 | 8 | 9 |
|---|---|---|---|---|---|---|---|---|---|
| Dane BeltonS | 100 | 100 | 100 | 100 | 100 | 100 | 100 | 100 | 100 |
| Azareye'h ThomasCB | 100 | 100 | 100 | 100 | 100 | 100 | 100 | 100 | 100 |
| Minkah FitzpatrickS | 12 | 100 | 100 | 100 | 100 | 100 | 98 | ||
| Demario DavisLB | 100 | 100 | 100 | 100 | 100 | 100 | 100 | 98 | 97 |
| Jamien SherwoodLB | 90 | 100 | 94 | 94 | 100 | 94 | 98 | 100 | 97 |
| Brandon StephensCB | 100 | 100 | 97 | 98 | 100 | 96 | 95 | 95 | 95 |
| Kingsley EnagbareDE | 66 | 68 | 58 | 79 | 75 | 68 | 87 | 83 | |
| David BaileyDE | 70 | 73 | 68 | 78 | 84 | 97 | 94 | 79 | |
| Darrell Jackson Jr.DL | 16 | 22 | 35 | 44 | 43 | 51 | 58 | 67 | 71 |
| Jowon BriggsDL | 20 | 59 | 69 | 60 | 32 | 51 | 74 | 78 | 59 |
| Harrison PhillipsDL | 54 | 54 | 68 | 56 | 43 | 54 | 71 | 60 | 41 |
| Will McDonaldDE | 50 | 42 | 34 | 71 | 43 | 34 | 42 | 57 | 36 |
| Jack HeflinDT | 12 | 17 | 4 | 33 | 35 | ||||
| D'Angelo PondsCB | 3 | 19 | 3 | 16 | 46 | 2 | 33 |

Opponents in the games with him were 8.3 pts weaker on average
With games:Adonai Mitchell WR · 4/8, Mason Taylor TE · 2/8, David Bailey EDGE · 1/8, Kingsley Enagbare EDGE · 1/8
Before (Wks 5-8)+0.068→From Wk 9 on (Wk 9)-0.302

Opponents in the games with him were 3.9 pts stronger on average
With games:Adonai Mitchell WR · 4/8, Mason Taylor TE · 2/8, Garrett Wilson WR · 1/8, Kingsley Enagbare EDGE · 1/8
Before (Wks 4-7)+0.015→From Wk 8 on (Wks 8-9)+0.188

Opponents in the games with him were 2.1 pts weaker on average
Without games:Mason Taylor TE · 2/4, Kingsley Enagbare EDGE · 1/4
With games:David Bailey EDGE · 1/5, Garrett Wilson WR · 1/5
Before (Wks 1-2)+0.020→From Wk 3 on (Wks 3-6)-0.054

Opponents in the games with him were 5.1 pts weaker on average
Without games:Adonai Mitchell WR · 1/1, Mason Taylor TE · 1/1
With games:Adonai Mitchell WR · 3/8, David Bailey EDGE · 1/8, Garrett Wilson WR · 1/8, Mason Taylor TE · 1/8
Before (Wks 1-3)-0.032→From Wk 4 on (Wks 4-7)+0.015
Key Jets starters who have taken the field in every game so far. A split appears here once one of them sits out a full game.
Bar = average share of his unit's snaps · all 10 starters →
Observed differences between groups of games, not the player's causal effect. Why sample size matters · What EPA is