Pigskin NightlyWeek 10
Latest
WSH ThuNYG NE SunDET BUF SunNYJ CAR SunNO HOU SunCLE JAX SunTEN KC SunATL MIA SunIND MIN SunGB LAR SunARI SEA SunLV SF SunDAL PIT SunCIN LAC MonBAL
The LabEvery contract against the field

Paid vs Played

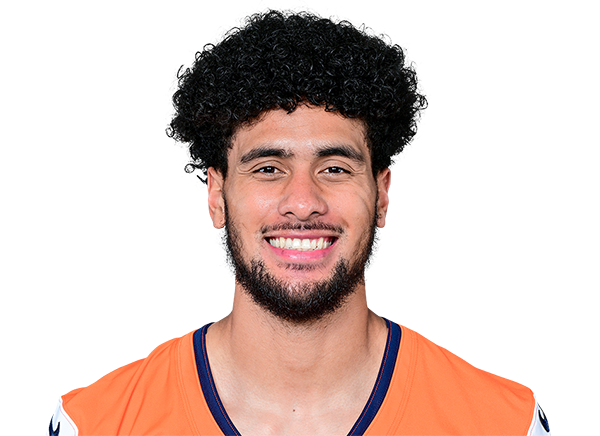
2,174 players on active contracts carry $7.77B of 2026 cap. Through week 9, 79% of that money belongs to players who are actually on the field, and $556M is sitting injured. Bills have the most of their cap playing (88%), Packers the least (56%). The best bargain in football right now: Tyler Badie, $735K of cap, playing like the 95th percentile at his position.

Cap $315M per teamContracts: OverTheCap via nflverseJSON
The cap skyline

How much of every cap is on the field

One building per position group, as tall as the money. Lit from the ground up by the share of it that is playing.
Bills#1
QB: $46.4M of cap, 95% of it on the field (3 players)QBRB: $10.4M of cap, 56% of it on the field (3 players)RBWR: $30.5M of cap, 92% of it on the field (8 players)WRTE: $14.1M of cap, 98% of it on the field (4 players)TEOL: $51.4M of cap, 85% of it on the field (12 players)OLDL: $50.0M of cap, 88% of it on the field (14 players)DLLB: $12.5M of cap, 74% of it on the field (6 players)LBDB: $23.2M of cap, 82% of it on the field (11 players)DBST: $5.8M of cap, 100% of it on the field (3 players)ST
88% on the field$244M · $2.7M injured · $27.8M idle
Seahawks#2
QB: $42.1M of cap, 97% of it on the field (3 players)QBRB: $9.3M of cap, 29% of it on the field (5 players)RBWR: $38.9M of cap, 92% of it on the field (8 players)WRTE: $7.4M of cap, 17% of it on the field (6 players)TEOL: $47.4M of cap, 93% of it on the field (11 players)OLDL: $79.7M of cap, 92% of it on the field (12 players)DLLB: $17.5M of cap, 86% of it on the field (4 players)LBDB: $44.8M of cap, 85% of it on the field (14 players)DBST: $12.4M of cap, 100% of it on the field (3 players)ST
88% on the field$300M · $9.2M injured · $27.3M idle
Titans#3
QB: $15.6M of cap, 71% of it on the field (3 players)QBRB: $15.6M of cap, 84% of it on the field (4 players)RBWR: $42.7M of cap, 95% of it on the field (8 players)WRTE: $10.1M of cap, 63% of it on the field (6 players)TEOL: $55.5M of cap, 92% of it on the field (11 players)OLDL: $46.3M of cap, 85% of it on the field (13 players)DLLB: $13.8M of cap, 84% of it on the field (6 players)LBDB: $48.7M of cap, 91% of it on the field (13 players)DBST: $5.6M of cap, 100% of it on the field (4 players)ST
88% on the field$254M · $6.4M injured · $24.6M idle
Chiefs#4
QB: $38.8M of cap, 89% of it on the field (3 players)QBRB: $8.1M of cap, 85% of it on the field (4 players)RBWR: $15.0M of cap, 70% of it on the field (10 players)WRTE: $15.0M of cap, 79% of it on the field (5 players)TEOL: $48.7M of cap, 84% of it on the field (12 players)OLDL: $72.7M of cap, 88% of it on the field (12 players)DLLB: $27.9M of cap, 92% of it on the field (6 players)LBDB: $38.7M of cap, 92% of it on the field (12 players)DBST: $10.3M of cap, 98% of it on the field (4 players)ST
87% on the field$275M · $9.2M injured · $25.8M idle
Buccaneers#5
QB: $35.3M of cap, 99% of it on the field (3 players)QBRB: $10.8M of cap, 77% of it on the field (3 players)RBWR: $44.8M of cap, 91% of it on the field (9 players)WRTE: $8.2M of cap, 65% of it on the field (5 players)TEOL: $67.4M of cap, 90% of it on the field (13 players)OLDL: $52.5M of cap, 90% of it on the field (14 players)DLLB: $15.0M of cap, 78% of it on the field (6 players)LBDB: $16.8M of cap, 57% of it on the field (10 players)DBST: $7.9M of cap, 100% of it on the field (3 players)ST
87% on the field$259M · $5.9M injured · $26.4M idle
Ravens#6
QB: $3.8M of cap, 57% of it on the field (4 players)QBRB: $11.7M of cap, 80% of it on the field (4 players)RBWR: $20.1M of cap, 85% of it on the field (8 players)WRTE: $12.7M of cap, 65% of it on the field (5 players)TEOL: $36.0M of cap, 73% of it on the field (13 players)OLDL: $41.5M of cap, 93% of it on the field (12 players)DLLB: $38.9M of cap, 94% of it on the field (4 players)LBDB: $58.1M of cap, 90% of it on the field (13 players)DBST: $3.9M of cap, 100% of it on the field (4 players)ST
86% on the field$227M · $9.1M injured · $22.6M idle
Rams#7
QB: $57.0M of cap, 85% of it on the field (4 players)QBRB: $15.4M of cap, 94% of it on the field (4 players)RBWR: $38.5M of cap, 91% of it on the field (7 players)WRTE: $19.8M of cap, 77% of it on the field (6 players)TEOL: $63.8M of cap, 89% of it on the field (11 players)OLDL: $47.2M of cap, 71% of it on the field (16 players)DLLB: $4.1M of cap, 26% of it on the field (4 players)LBDB: $41.5M of cap, 96% of it on the field (12 players)DBST: $4.3M of cap, 100% of it on the field (5 players)ST
85% on the field$292M · $5.4M injured · $37.1M idle
Bengals#8
QB: $41.2M of cap, 91% of it on the field (3 players)QBRB: $7.3M of cap, 79% of it on the field (5 players)RBWR: $32.9M of cap, 83% of it on the field (7 players)WRTE: $13.7M of cap, 76% of it on the field (6 players)TEOL: $39.6M of cap, 84% of it on the field (11 players)OLDL: $79.9M of cap, 88% of it on the field (14 players)DLLB: $7.4M of cap, 45% of it on the field (5 players)LBDB: $40.4M of cap, 80% of it on the field (14 players)DBST: $7.1M of cap, 100% of it on the field (3 players)ST
84% on the field$270M · $8.9M injured · $33.2M idle
Eagles#9
QB: $35.1M of cap, 94% of it on the field (4 players)QBRB: $12.6M of cap, 78% of it on the field (3 players)RBWR: $23.6M of cap, 82% of it on the field (9 players)WRTE: $15.2M of cap, 76% of it on the field (4 players)TEOL: $57.3M of cap, 93% of it on the field (11 players)OLDL: $30.4M of cap, 68% of it on the field (13 players)DLLB: $13.3M of cap, 92% of it on the field (4 players)LBDB: $20.0M of cap, 65% of it on the field (11 players)DBST: $7.4M of cap, 100% of it on the field (3 players)ST
84% on the field$215M · $3.4M injured · $31.0M idle
Broncos#10
QB: $15.1M of cap, 34% of it on the field (3 players)QBRB: $9.8M of cap, 93% of it on the field (4 players)RBWR: $37.9M of cap, 83% of it on the field (7 players)WRTE: $21.0M of cap, 91% of it on the field (6 players)TEOL: $70.8M of cap, 85% of it on the field (14 players)OLDL: $62.9M of cap, 83% of it on the field (14 players)DLLB: $11.1M of cap, 84% of it on the field (5 players)LBDB: $54.4M of cap, 95% of it on the field (11 players)DBST: $3.5M of cap, 100% of it on the field (2 players)ST
84% on the field$287M · $4.1M injured · $41.4M idle
Chargers#11
QB: $49.1M of cap, 94% of it on the field (3 players)QBRB: $11.8M of cap, 70% of it on the field (5 players)RBWR: $13.1M of cap, 69% of it on the field (8 players)WRTE: $9.5M of cap, 57% of it on the field (5 players)TEOL: $60.3M of cap, 78% of it on the field (16 players)OLDL: $51.8M of cap, 89% of it on the field (13 players)DLLB: $13.9M of cap, 48% of it on the field (7 players)LBDB: $51.0M of cap, 93% of it on the field (11 players)DBST: $3.8M of cap, 100% of it on the field (2 players)ST
83% on the field$264M · $15.8M injured · $28.0M idle
Cowboys#12
QB: $46.2M of cap, 94% of it on the field (3 players)QBRB: $8.2M of cap, 47% of it on the field (4 players)RBWR: $55.3M of cap, 87% of it on the field (8 players)WRTE: $10.3M of cap, 73% of it on the field (5 players)TEOL: $40.9M of cap, 86% of it on the field (12 players)OLDL: $42.4M of cap, 79% of it on the field (15 players)DLLB: $8.3M of cap, 78% of it on the field (5 players)LBDB: $45.1M of cap, 78% of it on the field (12 players)DBST: $5.6M of cap, 100% of it on the field (2 players)ST
83% on the field$262M · $6.2M injured · $37.3M idle
Lions#13
QB: $38.8M of cap, 97% of it on the field (2 players)QBRB: $12.9M of cap, 76% of it on the field (5 players)RBWR: $24.8M of cap, 89% of it on the field (7 players)WRTE: $7.2M of cap, 93% of it on the field (3 players)TEOL: $28.1M of cap, 62% of it on the field (11 players)OLDL: $54.2M of cap, 94% of it on the field (12 players)DLLB: $20.6M of cap, 84% of it on the field (8 players)LBDB: $47.2M of cap, 61% of it on the field (15 players)DBST: $2.2M of cap, 100% of it on the field (2 players)ST
82% on the field$236M · $18.2M injured · $24.6M idle
Bears#14
QB: $17.7M of cap, 61% of it on the field (3 players)QBRB: $9.1M of cap, 64% of it on the field (5 players)RBWR: $15.7M of cap, 77% of it on the field (8 players)WRTE: $17.2M of cap, 91% of it on the field (5 players)TEOL: $54.5M of cap, 80% of it on the field (12 players)OLDL: $76.6M of cap, 92% of it on the field (12 players)DLLB: $21.8M of cap, 74% of it on the field (10 players)LBDB: $63.9M of cap, 78% of it on the field (13 players)DBST: $6.2M of cap, 100% of it on the field (4 players)ST
82% on the field$283M · $14.9M injured · $37.0M idle
Steelers#15
QB: $7.5M of cap, 0% of it on the field (3 players)QBRB: $4.9M of cap, 77% of it on the field (2 players)RBWR: $31.5M of cap, 84% of it on the field (9 players)WRTE: $12.9M of cap, 80% of it on the field (5 players)TEOL: $21.0M of cap, 77% of it on the field (11 players)OLDL: $93.2M of cap, 88% of it on the field (14 players)DLLB: $27.9M of cap, 86% of it on the field (8 players)LBDB: $51.2M of cap, 73% of it on the field (16 players)DBST: $7.3M of cap, 100% of it on the field (3 players)ST
81% on the field$257M · $19.7M injured · $29.8M idle
Jaguars#16
QB: $25.3M of cap, 95% of it on the field (3 players)QBRB: $5.9M of cap, 60% of it on the field (5 players)RBWR: $27.7M of cap, 55% of it on the field (9 players)WRTE: $8.9M of cap, 62% of it on the field (5 players)TEOL: $49.5M of cap, 74% of it on the field (14 players)OLDL: $57.2M of cap, 89% of it on the field (16 players)DLLB: $23.3M of cap, 88% of it on the field (6 players)LBDB: $51.0M of cap, 90% of it on the field (12 players)DBST: $5.5M of cap, 100% of it on the field (3 players)ST
81% on the field$254M · $13.8M injured · $33.4M idle
Raiders#17
QB: $19.4M of cap, 7% of it on the field (3 players)QBRB: $13.1M of cap, 86% of it on the field (6 players)RBWR: $14.2M of cap, 60% of it on the field (6 players)WRTE: $12.6M of cap, 98% of it on the field (4 players)TEOL: $50.7M of cap, 89% of it on the field (12 players)OLDL: $74.4M of cap, 92% of it on the field (13 players)DLLB: $15.3M of cap, 92% of it on the field (5 players)LBDB: $41.4M of cap, 74% of it on the field (13 players)DBST: $8.5M of cap, 97% of it on the field (4 players)ST
80% on the field$250M · $6.1M injured · $43.4M idle
Vikings#18
QB: $4.3M of cap, 30% of it on the field (2 players)QBRB: $18.4M of cap, 56% of it on the field (4 players)RBWR: $37.9M of cap, 96% of it on the field (7 players)WRTE: $27.7M of cap, 56% of it on the field (5 players)TEOL: $62.9M of cap, 87% of it on the field (13 players)OLDL: $38.2M of cap, 89% of it on the field (14 players)DLLB: $20.1M of cap, 66% of it on the field (6 players)LBDB: $33.3M of cap, 84% of it on the field (10 players)DBST: $3.6M of cap, 100% of it on the field (3 players)ST
80% on the field$246M · $12.9M injured · $36.7M idle
Browns#19
QB: $44.7M of cap, 92% of it on the field (4 players)QBRB: $5.7M of cap, 45% of it on the field (5 players)RBWR: $22.0M of cap, 84% of it on the field (7 players)WRTE: $4.2M of cap, 63% of it on the field (4 players)TEOL: $33.4M of cap, 74% of it on the field (12 players)OLDL: $35.4M of cap, 80% of it on the field (14 players)DLLB: $13.6M of cap, 39% of it on the field (7 players)LBDB: $46.7M of cap, 85% of it on the field (14 players)DBST: $3.6M of cap, 100% of it on the field (3 players)ST
79% on the field$209M · $16.5M injured · $26.7M idle
Commanders#20
QB: $19.0M of cap, 54% of it on the field (4 players)QBRB: $6.1M of cap, 44% of it on the field (6 players)RBWR: $34.4M of cap, 92% of it on the field (9 players)WRTE: $13.8M of cap, 95% of it on the field (6 players)TEOL: $51.3M of cap, 65% of it on the field (12 players)OLDL: $75.1M of cap, 92% of it on the field (13 players)DLLB: $15.9M of cap, 59% of it on the field (4 players)LBDB: $28.7M of cap, 83% of it on the field (10 players)DBST: $4.0M of cap, 100% of it on the field (3 players)ST
79% on the field$248M · $17.5M injured · $34.1M idle
Cardinals#21
QB: $7.5M of cap, 0% of it on the field (2 players)QBRB: $25.5M of cap, 69% of it on the field (6 players)RBWR: $19.9M of cap, 74% of it on the field (8 players)WRTE: $12.7M of cap, 69% of it on the field (4 players)TEOL: $37.5M of cap, 84% of it on the field (13 players)OLDL: $50.8M of cap, 89% of it on the field (13 players)DLLB: $16.9M of cap, 86% of it on the field (5 players)LBDB: $37.2M of cap, 83% of it on the field (11 players)DBST: $4.8M of cap, 100% of it on the field (3 players)ST
79% on the field$213M · $18.8M injured · $25.9M idle
Jets#22
QB: $5.0M of cap, 66% of it on the field (3 players)QBRB: $5.3M of cap, 23% of it on the field (4 players)RBWR: $18.9M of cap, 84% of it on the field (6 players)WRTE: $13.8M of cap, 91% of it on the field (5 players)TEOL: $27.7M of cap, 83% of it on the field (11 players)OLDL: $48.2M of cap, 74% of it on the field (15 players)DLLB: $18.6M of cap, 89% of it on the field (4 players)LBDB: $39.2M of cap, 71% of it on the field (13 players)DBST: $2.5M of cap, 100% of it on the field (2 players)ST
77% on the field$179M · $14.9M injured · $25.9M idle
Patriots#23
QB: $12.7M of cap, 79% of it on the field (3 players)QBRB: $14.8M of cap, 50% of it on the field (5 players)RBWR: $27.8M of cap, 71% of it on the field (10 players)WRTE: $17.0M of cap, 73% of it on the field (4 players)TEOL: $60.0M of cap, 60% of it on the field (14 players)OLDL: $80.4M of cap, 75% of it on the field (13 players)DLLB: $25.0M of cap, 83% of it on the field (6 players)LBDB: $58.3M of cap, 90% of it on the field (11 players)DBST: $2.1M of cap, 100% of it on the field (2 players)ST
74% on the field$298M · $48.5M injured · $28.4M idle
Panthers#24
QB: $17.1M of cap, 71% of it on the field (3 players)QBRB: $12.4M of cap, 60% of it on the field (5 players)RBWR: $14.9M of cap, 62% of it on the field (7 players)WRTE: $12.6M of cap, 81% of it on the field (5 players)TEOL: $97.4M of cap, 55% of it on the field (12 players)OLDL: $60.5M of cap, 90% of it on the field (16 players)DLLB: $10.3M of cap, 81% of it on the field (4 players)LBDB: $49.2M of cap, 96% of it on the field (13 players)DBST: $3.9M of cap, 100% of it on the field (3 players)ST
74% on the field$278M · $50.8M injured · $20.7M idle
Texans#25
QB: $17.3M of cap, 67% of it on the field (3 players)QBRB: $6.6M of cap, 69% of it on the field (6 players)RBWR: $29.7M of cap, 83% of it on the field (9 players)WRTE: $16.4M of cap, 72% of it on the field (5 players)TEOL: $36.6M of cap, 61% of it on the field (13 players)OLDL: $56.3M of cap, 80% of it on the field (16 players)DLLB: $21.2M of cap, 58% of it on the field (9 players)LBDB: $34.8M of cap, 78% of it on the field (12 players)DBST: $7.8M of cap, 100% of it on the field (3 players)ST
74% on the field$227M · $17.5M injured · $42.0M idle
Falcons#26
QB: $9.4M of cap, 67% of it on the field (4 players)QBRB: $13.3M of cap, 75% of it on the field (4 players)RBWR: $19.2M of cap, 78% of it on the field (9 players)WRTE: $9.1M of cap, 63% of it on the field (3 players)TEOL: $55.8M of cap, 84% of it on the field (14 players)OLDL: $33.9M of cap, 44% of it on the field (14 players)DLLB: $16.6M of cap, 69% of it on the field (7 players)LBDB: $30.3M of cap, 81% of it on the field (10 players)DBST: $6.9M of cap, 100% of it on the field (3 players)ST
73% on the field$195M · $11.3M injured · $41.4M idle
Colts#27
QB: $11.9M of cap, 0% of it on the field (2 players)QBRB: $18.7M of cap, 87% of it on the field (4 players)RBWR: $24.2M of cap, 36% of it on the field (10 players)WRTE: $10.8M of cap, 79% of it on the field (5 players)TEOL: $18.2M of cap, 73% of it on the field (12 players)OLDL: $39.4M of cap, 77% of it on the field (13 players)DLLB: $8.6M of cap, 73% of it on the field (6 players)LBDB: $55.0M of cap, 90% of it on the field (15 players)DBST: $6.5M of cap, 100% of it on the field (3 players)ST
72% on the field$193M · $17.4M injured · $36.0M idle
Saints#28
QB: $4.9M of cap, 50% of it on the field (3 players)QBRB: $18.3M of cap, 62% of it on the field (6 players)RBWR: $22.3M of cap, 54% of it on the field (6 players)WRTE: $12.8M of cap, 83% of it on the field (4 players)TEOL: $43.5M of cap, 85% of it on the field (12 players)OLDL: $47.1M of cap, 63% of it on the field (16 players)DLLB: $11.6M of cap, 90% of it on the field (4 players)LBDB: $22.0M of cap, 61% of it on the field (14 players)DBST: $3.5M of cap, 100% of it on the field (3 players)ST
70% on the field$186M · $14.9M injured · $40.8M idle
Dolphins#29
QB: $6.7M of cap, 84% of it on the field (3 players)QBRB: $7.7M of cap, 27% of it on the field (5 players)RBWR: $8.7M of cap, 75% of it on the field (9 players)WRTE: $6.5M of cap, 50% of it on the field (6 players)TEOL: $28.8M of cap, 84% of it on the field (11 players)OLDL: $28.4M of cap, 69% of it on the field (14 players)DLLB: $13.6M of cap, 76% of it on the field (6 players)LBDB: $16.2M of cap, 58% of it on the field (13 players)DBST: $2.4M of cap, 100% of it on the field (2 players)ST
70% on the field$119M · $8.1M injured · $27.4M idle
49ers#30
QB: $27.8M of cap, 85% of it on the field (3 players)QBRB: $18.1M of cap, 86% of it on the field (6 players)RBWR: $37.1M of cap, 31% of it on the field (12 players)WRTE: $20.0M of cap, 88% of it on the field (4 players)TEOL: $39.5M of cap, 80% of it on the field (13 players)OLDL: $55.1M of cap, 35% of it on the field (15 players)DLLB: $28.1M of cap, 80% of it on the field (7 players)LBDB: $27.2M of cap, 67% of it on the field (13 players)DBST: $3.0M of cap, 100% of it on the field (2 players)ST
64% on the field$256M · $26.6M injured · $66.3M idle
Giants#31
QB: $8.3M of cap, 53% of it on the field (3 players)QBRB: $8.0M of cap, 83% of it on the field (5 players)RBWR: $15.7M of cap, 81% of it on the field (6 players)WRTE: $8.4M of cap, 72% of it on the field (3 players)TEOL: $43.3M of cap, 88% of it on the field (13 players)OLDL: $80.8M of cap, 57% of it on the field (12 players)DLLB: $11.9M of cap, 72% of it on the field (6 players)LBDB: $58.3M of cap, 42% of it on the field (15 players)DBST: $4.7M of cap, 100% of it on the field (3 players)ST
63% on the field$240M · $65.8M injured · $21.7M idle
Packers#32
QB: $39.0M of cap, 93% of it on the field (2 players)QBRB: $19.1M of cap, 8% of it on the field (4 players)RBWR: $26.8M of cap, 60% of it on the field (8 players)WRTE: $14.5M of cap, 53% of it on the field (6 players)TEOL: $44.9M of cap, 37% of it on the field (14 players)OLDL: $55.8M of cap, 42% of it on the field (17 players)DLLB: $17.9M of cap, 88% of it on the field (5 players)LBDB: $32.5M of cap, 69% of it on the field (11 players)DBST: $2.6M of cap, 100% of it on the field (3 players)ST
56% on the field$253M · $55.8M injured · $54.8M idle

Bottom lineBills have the most cap playing (88%), Packers the least (56%). League-wide, 79% of the money is on the field and $556M is injured.

How to read this chart
One card = one team.
Each card is a small city: one building per position group (QB, RB, WR, TE, offensive line OL, defensive line DL, linebackers LB, secondary DB, specialists ST).
Height = money.
A building is as tall as the cap hit (this season's salary-cap charge) the team spends on that group. Same scale for all 32 teams, so a tall QB tower means an expensive quarterback room. The tallest building wears an antenna.
Lit windows = playing.
Windows light up from the ground by the share of that money belonging to players who are actually on the field. Dark windows on top are money on injured or idle players.

"On the field" means a player has taken at least a quarter of his unit's snaps this season (specialists count when they play). Idle money is healthy players below that line: backups, rookies waiting, practice squad deals.

The bargain bin

Playing like stars, paid like depth

Top 15% at the position on the field, bottom 40% in pay

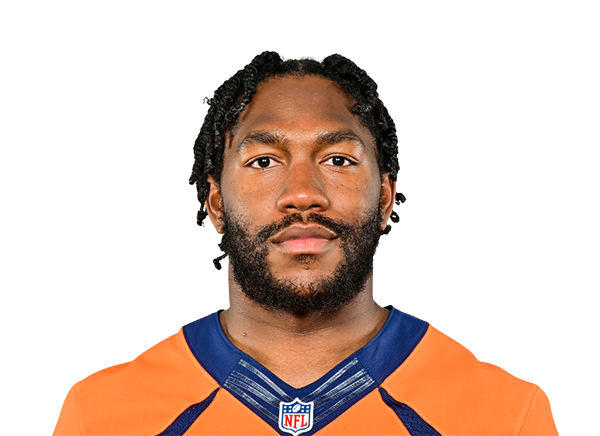
Bottom lineBest bargain today: Tyler Badie (DEN), $735K of cap, paid like the 21st percentile and playing like the 95th.

How to read these price tags
Big number:
the player's 2026 cap hit, with the average yearly value of his contract underneath.
Two arcs:
the outer gold arc is how he ranks in pay among players at his position, the inner arc how he ranks in production (EPA for QB, RB, WR, TE; share of snaps for everyone else). A full arc is the top of the position.
Paid / Played:
the same two ranks as percentiles: 90th means better than 90% of players at the position. A bargain has a short gold arc and a long inner arc; money waiting is the reverse.
Money waiting

Big contracts, little return

Healthy, top 20% in pay, bottom 40% in production or playing time
Paid to heal

The cap in the trainer's room

On injured reserve or out, $8M+ cap
The quarterback exchange

What a quarterback's production costs

EPA on dropbacks and designed runs, 2026 regular season

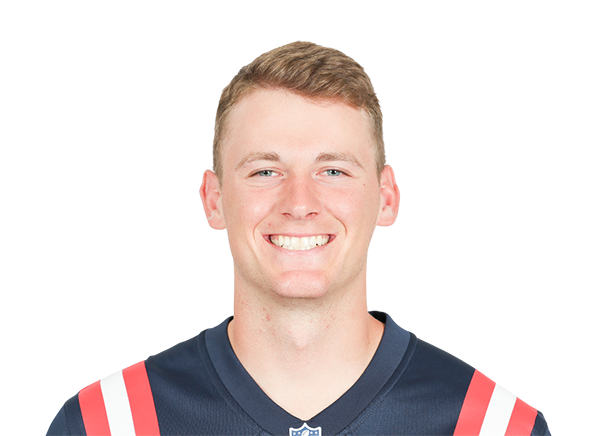
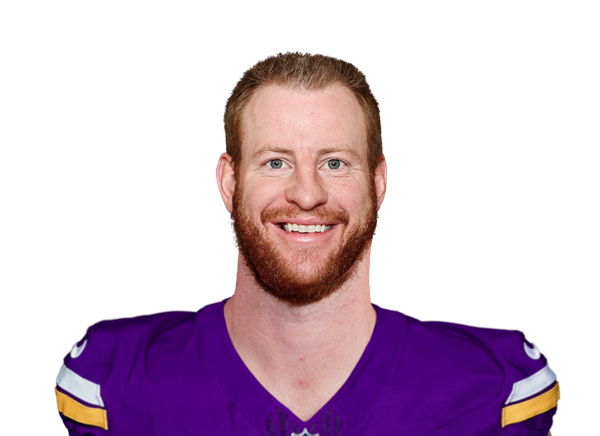
Bottom lineCheapest production: Kirk Cousins at $40K per EPA point. Biggest positive value gap: J.J. McCarthy (+64).

How to read this table
EPA
(expected points added) is how many points a quarterback's plays added compared with an average play in the same down, distance and field position. Positive is good; the total grows with playing time.
Per play
is EPA divided by plays: efficiency, regardless of volume.
Cost per EPA
is cap hit divided by EPA: what the team pays for each point he adds. Lower is better value; it is blank when his EPA is not positive.
Value gap
is his production rank minus his pay rank among quarterbacks, in points. Green and positive: playing above his contract. Red and negative: paid more than he plays.
The value field

Every contract, one field

Right: paid more than the position. Up: playing more. Faces link to player pages.

Bottom line566 contracts plotted across 8 position groups.

How to read this chart
One face = one player
with an active contract who has played this season. Pick a position group with the tabs; tap a face for the player page.
Left to right:
pay rank among players at his position (far right = among the highest paid).
Bottom to top:
production rank at his position (top = among the most productive: EPA for QB, RB, WR, TE, snap share for the rest).
The diagonal band
is the fair price: pay and production match. Above it (top left) are bargains, below it (bottom right) is money waiting. Faded faces are injured.
Bargainsplay like stars, paid like depthPriced rightpaid like stars, playing like starsMoney waitingpaid like stars, not on the fieldDepthsmall deals, small rolesPaid more than their position →Playing more →JS

61 players with an active contract who have played this season · tap a face for the player page

What a point costs

The price of one point of EPA

Median cap hit per EPA point, players above +5 EPA

Bottom lineQuarterbacks are the most expensive way to buy a point ($541K each), wide receivers the cheapest ($282K).

How to read this chart
One stack = one position.
The stack of coins is as tall as the typical (median) cap hit paid for each point of EPA, among players who have produced more than +5 EPA this season.
Taller stack = more expensive production.
It shows which positions cost the most per point added, not which players are better.
$541KQuarterbacksper EPA point · 22 players
$286KRunning backsper EPA point · 14 players
$282KWide receiversper EPA point · 78 players
$334KTight endsper EPA point · 32 players
MethodHow this is built
Contracts
Active contracts from OverTheCap, published by nflverse and refreshed daily: the 2026 cap hit from each contract's year-by-year schedule (average per year when the schedule is missing), total value and guarantees. Players are matched to rosters by their league id.
Played
Quarterbacks, running backs, receivers and tight ends: total EPA this regular season (dropbacks and designed runs for quarterbacks, carries and targets for the others). Everyone else: share of their unit's snaps. Total, not per play, because a player who is not on the field is not giving the team anything.
Paid vs played
Both are percentiles inside the position group (all players with an active contract), so a guard is compared with guards and an edge rusher with the defensive line. Bargains: top 15% played, bottom 40% paid. Little return: healthy, top 20% paid, bottom 40% played.
Cap on the field
The share of a team's counted cap belonging to players with at least 25% of their unit's snaps. Dead money from released players is not in the contract data, so it is not counted here.