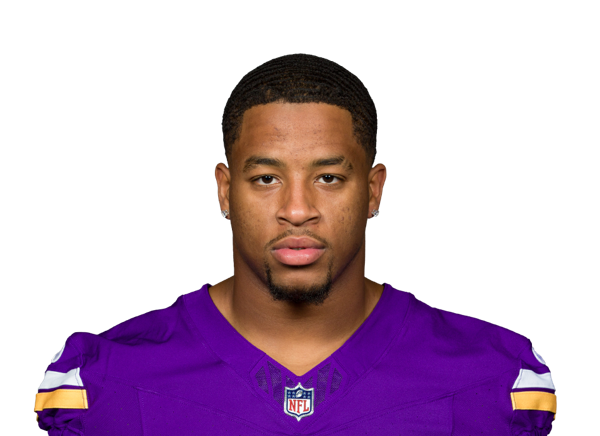
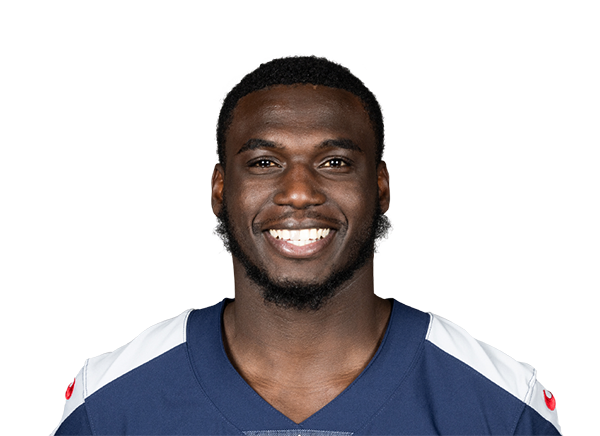
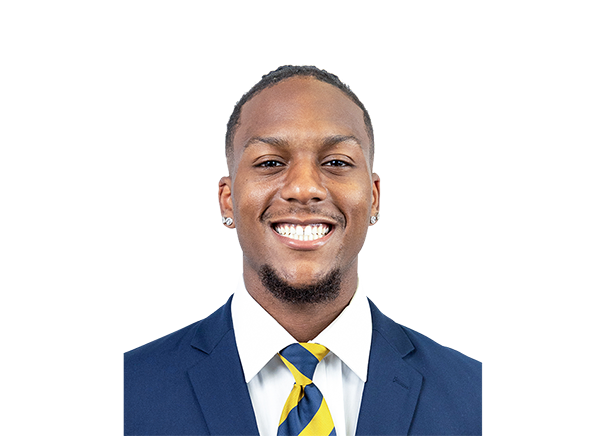
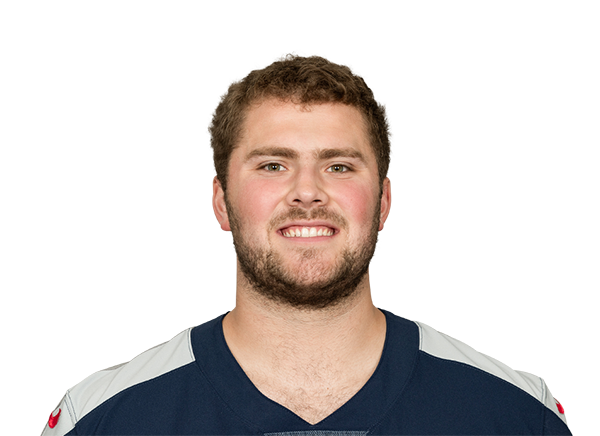
EPA/play, better without
Opponents in the games with him were 8.9 pts weaker on average
With games:Alontae Taylor CB · 2/7, Amani Hooker S · 1/7, Cor'Dale Flott CB · 1/7
Before (Wks 4-7)-0.183→From Wk 8 on (Wk 8)+0.157
Over the last 4 games the defense has allowed a 50.2% success rate (275 plays), 29th among 32 teams over their own last 4. In the 4 games before: a 43.1% success rate (248 plays), 13th.
Season EPA ranks ↓⇄Usage shiftAlontae Taylor, CBdefensive snap share100%→42%Alontae Taylor has played 42% of defensive snaps over the last 4 games, down from 100% in the 4 games before. On the field in 2 of 4 and 4 of 4; a game without a snap counts as zero.
Snap counts, week by week ↓The Tennessee Titans are 1-7 in the 2026 season, 4th in the AFC South and the No. 15 seed in the AFC, with a point differential of -55. On offense they rank 27th in the league in EPA per play (-0.088); on defense they rank 25th (+0.069 allowed). The Pigskin Nightly model gives them a 0% chance to make the playoffs and 0.0% to win the Super Bowl. The Tennessee Titans play next at home against the Jacksonville Jaguars on Sun, Nov 15, 1 PM ET (Week 10), on Fox.
1-7, 4th in the AFC South. Home 0-4, road 1-3, division 1-1, conference 1-5, current streak L2. Points: 144 scored, 199 allowed.
The Tennessee Titans play next at home against the Jacksonville Jaguars on Sun, Nov 15, 1 PM ET (Week 10), on Fox.
0% to make the playoffs, 0% to win the AFC South, 0% to earn the No. 1 seed and the bye, 0.0% to win the AFC and 0.0% to win the Super Bowl, from 10,000 simulations of the rest of the season (projected record 3.8-13.2).
Cam Ward is first on the Titans depth chart at quarterback, with Mitchell Trubisky behind.
Out, doubtful or on injured reserve: Carnell Tate (WR, out, shoulder), Jaylon Jones (CB, out, knee), Tommy Townsend (P, out, knee), Tyjae Spears (RB, out, knee) and Dorian Mausi (LB, injured reserve). Questionable: JC Latham (OT, questionable, finger), James Williams Sr. (LB, questionable, groin), Marcus Harris (CB, questionable, ankle) and Peter Skoronski (G, questionable, hamstring).
Offense: 27th in EPA per play (-0.088), 25th on dropbacks, 17th on runs, success rate 41.8%. Defense: 25th in EPA allowed (+0.069), 29th against the pass, 18th against the run.

Pigskin Nightly, “Tennessee Titans 2026: record, EPA, depth chart and injuries”, https://pigskinnightly.com/teams/titans (updated 2026-11-10).
Looking back, not ahead. Deserved wins grade how well a team has played, from every snap of the games already played. They are not a forecast of the games to come. How well they hold up
−0.8 luck wins · 27th luckiest in the NFL · net EPA per snap 28th
Bars: deserved win probability, from the snaps50% line
↳Bottom lineEvery result so far matched the play or was a coin flip.
Bengals earned it: the snaps said Bengals by 2.2, a deserved win probability of 65%.
Bars above the line are good: offense adding expected points, defense taking them away. The middle line is league average zero.Rest days and miles traveled, all 32 →
Pass rate over expected: -4.5% (24th most pass-heavy given down, distance and score). 452 offensive plays logged.
Fantasy points allowed per game: QB 20.1 (5th most) · RB 21.6 (16th most) · WR 42.5 (1st most) · TE 12.7 (21st most). Defense vs position
Quarterback · 280 dropbacksC.Ward-0.096EPA / dropback-0.9CPOE7.0aDOT43%success| Rushing | Car | Yds | TD | EPA/car | Success |
|---|---|---|---|---|---|
| T.Pollard RB | 133 | 595 | 6 | -0.06 | 41% |
| T.Spears RB | 18 | 66 | 0 | -0.35 | 33% |
| C.Ward QB | 9 | 30 | 1 | +0.53 | 67% |
| Targets | Tgt | Target share | Air share | aDOT | Yds | TD | EPA/tgt |
|---|---|---|---|---|---|---|---|
| C.Tate WR | 51 | 22% | 39% | 12.7 | 413 | 1 | +0.20 |
| W.Robinson WR | 50 | 21% | 17% | 5.8 | 262 | 3 | -0.01 |
| G.Helm TE | 28 | 12% | 9% | 5.8 | 160 | 0 | +0.14 |
| E.Ayomanor WR | 26 | 11% | 16% | 10.5 | 211 | 1 | +0.22 |
| T.Pollard RB | 21 | 9% | 1% | 0.9 | 70 | 0 | -0.76 |
| T.Spears RB | 17 | 7% | -3% | -2.7 | 75 | 0 | -0.18 |
| D.Bellinger TE | 15 | 6% | 4% | 4.2 | 70 | 0 | -0.23 |
| C.Ridley WR | 13 | 6% | 7% | 9.0 | 91 | 0 | +0.07 |
| Offense | 1 | 2 | 3 | 4 | 5 | 6 | 7 | 8 |
|---|---|---|---|---|---|---|---|---|
| Dan MooreT | 100 | 100 | 100 | 100 | 100 | 100 | 100 | 100 |
| Cam WardQB | 100 | 100 | 100 | 100 | 100 | 100 | 100 | 100 |
| Austin SchlottmannC | 100 | 100 | 100 | 100 | 100 | 100 | 100 | 100 |
| Atonio MafiG | 100 | 100 | 100 | 100 | 100 | |||
| Wan'Dale RobinsonWR | 82 | 53 | 63 | 67 | 75 | 59 | 60 | 94 |
| Tony PollardRB | 52 | 55 | 53 | 53 | 48 | 76 | 75 | 82 |
| Chimere DikeWR | 8 | 4 | 10 | 12 | 17 | 17 | 21 | 82 |
| Peter SkoronskiG | 100 | 100 | 100 | 100 | 100 | 100 | 100 | 78 |
| Elic AyomanorWR | 52 | 53 | 80 | 62 | 52 | 61 | 89 | 65 |
| Gunnar HelmTE | 76 | 87 | 82 | 72 | 71 | 72 | 84 | 64 |
| JC LathamT | 100 | 100 | 100 | 100 | 100 | 100 | 100 | 55 |
| Calvin RidleyWR | 64 | 62 | 33 | 47 | 56 | 61 | 52 | |
| James HudsonT | 6 | 5 | 45 | |||||
| Daniel BellingerTE | 28 | 45 | 40 | 52 | 44 | 48 | 48 | 40 |
| Defense | 1 | 2 | 3 | 4 | 5 | 6 | 7 | 8 |
|---|---|---|---|---|---|---|---|---|
| Amani HookerS | 97 | 100 | 100 | 98 | 100 | 100 | 100 | |
| Cordale FlottCB | 99 | 100 | 100 | 47 | 100 | 100 | 100 | |
| Joshua WilliamsCB | 100 | 100 | 100 | |||||
| Anthony HillLB | 100 | 100 | 100 | 100 | 100 | 100 | 100 | 96 |
| Kevin WinstonS | 100 | 100 | 100 | 100 | 100 | 92 | ||
| Jermaine Johnson IIDE | 61 | 68 | 66 | 48 | 53 | 57 | 67 | 70 |
| Alontae TaylorCB | 100 | 100 | 98 | 100 | 100 | 69 | ||
| Solomon ThomasDT | 30 | 26 | 22 | 20 | 32 | 33 | 36 | 69 |
| Jacob MartinDE | 45 | 66 | 59 | 58 | 55 | 61 | 61 | 64 |
| John Franklin-MyersDL | 60 | 43 | 53 | 59 | 44 | 51 | 50 | 58 |
| Cody BartonLB | 97 | 78 | 69 | 83 | 97 | 53 | 56 | 53 |
| Cedric GrayLB | 39 | 47 | 47 | 42 | 46 | 56 | 45 | |
| Timmy HorneDT | 30 | 21 | 41 | |||||
| Keldric FaulkDE | 28 | 26 | 38 | 33 | 33 | 35 | 26 | 39 |

Opponents in the games with him were 8.9 pts weaker on average
With games:Alontae Taylor CB · 2/7, Amani Hooker S · 1/7, Cor'Dale Flott CB · 1/7
Before (Wks 4-7)-0.183→From Wk 8 on (Wk 8)+0.157

Opponents in the games with him were 4.4 pts stronger on average
With games:Amani Hooker S · 1/6, Carnell Tate WR · 1/6, Cor'Dale Flott CB · 1/6
Before (Wks 2-5)+0.057→From Wk 6 on (Wks 6-8)+0.057

Opponents in the games with him were 4.4 pts weaker on average
With games:Alontae Taylor CB · 2/7, Carnell Tate WR · 1/7, Cor'Dale Flott CB · 1/7
Before (Wks 1-4)+0.065→From Wk 5 on (Wks 5-8)+0.074

Opponents in the games with him were 7.5 pts stronger on average
With games:Alontae Taylor CB · 2/7, Amani Hooker S · 1/7, Carnell Tate WR · 1/7
Before (Wk 1)+0.168→From Wk 2 on (Wks 2-5)+0.057
Key Titans starters who have taken the field in every game so far. A split appears here once one of them sits out a full game.
Bar = average share of his unit's snaps · all 11 starters →
Observed differences between groups of games, not the player's causal effect. Why sample size matters · What EPA is