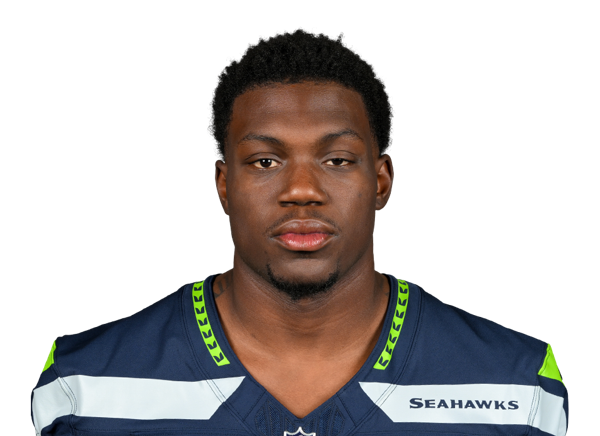
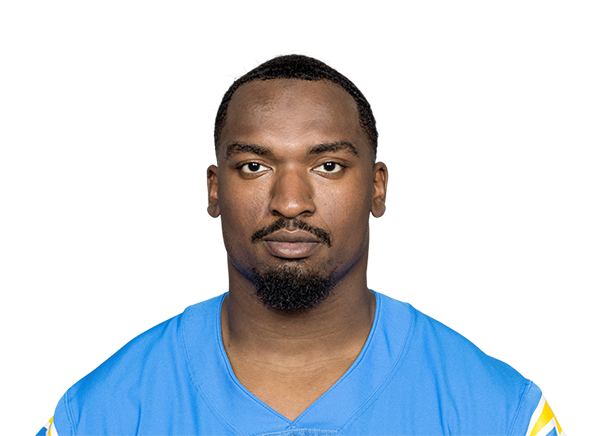
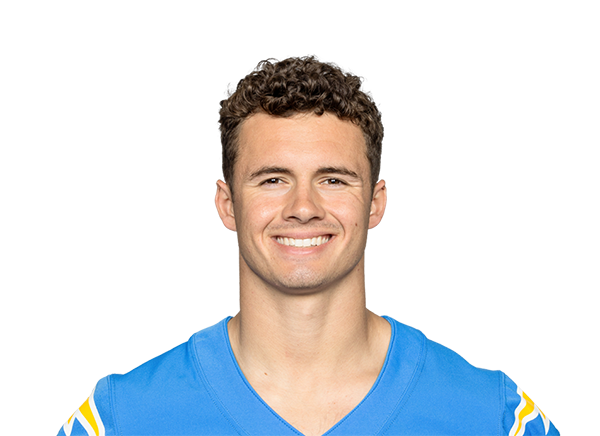
EPA/play, better without
Opponents in the games with him were 3.9 pts weaker on average
With games:Joe Alt OT · 2/6, Ladd McConkey WR · 2/6, Travis Burke OT · 2/6, Quentin Johnston WR · 1/6 +1 more
Before (Wks 1-2)-0.253→From Wk 3 on (Wks 3-6)-0.212
Over the last 4 games the run defense has allowed -0.02 EPA per rush (102 rushes), 26th among 32 teams over their own last 4. In the 4 games before: -0.10 EPA per rush (116 rushes), 14th.
Season EPA ranks ↓⇄Usage shiftTravis Burke, Toffensive snap share21%→100%Travis Burke has played 100% of offensive snaps over the last 4 games, up from 21% in the 4 games before. On the field in 4 of 4 and 2 of 4; a game without a snap counts as zero.
Snap counts, week by week ↓The Los Angeles Chargers are 0-8 in the 2026 season, 4th in the AFC West and the No. 16 seed in the AFC, with a point differential of -98. On offense they rank 32nd in the league in EPA per play (-0.245); on defense they rank 17th (+0.003 allowed). The Pigskin Nightly model gives them a 0% chance to make the playoffs and 0.0% to win the Super Bowl. The Los Angeles Chargers play next on the road at the Baltimore Ravens on Mon, Nov 16, 8:15 PM ET (Week 10), on ESPN.
0-8, 4th in the AFC West. Home 0-4, road 0-4, division 0-3, conference 0-5, current streak L8. Points: 121 scored, 219 allowed.
The Los Angeles Chargers play next on the road at the Baltimore Ravens on Mon, Nov 16, 8:15 PM ET (Week 10), on ESPN.
0% to make the playoffs, 0% to win the AFC West, 0% to earn the No. 1 seed and the bye, 0.0% to win the AFC and 0.0% to win the Super Bowl, from 10,000 simulations of the rest of the season (projected record 2.2-14.8).
Justin Herbert is first on the Chargers depth chart at quarterback (currently questionable on the injury report), with DJ Uiagalelei behind.
Out, doubtful or on injured reserve: Brenen Thompson (WR, out, quadriceps), Deane Leonard (CB, out, concussion), Kayode Awosika (G, out, lower leg), Kendall Williamson (S, out, calf), David Njoku (TE, injured reserve, lower leg) and Denzel Perryman (LB, injured reserve, undisclosed). Questionable: Isas Waxter (CB, questionable, ankle), Justin Eboigbe (DT, questionable, ankle), Justin Herbert (QB, questionable, finger) and Ladd McConkey (WR, questionable, back).
Offense: 32nd in EPA per play (-0.245), 32nd on dropbacks, 32nd on runs, success rate 35.0%. Defense: 17th in EPA allowed (+0.003), 18th against the pass, 20th against the run.

Pigskin Nightly, “Los Angeles Chargers 2026: record, EPA, depth chart and injuries”, https://pigskinnightly.com/teams/chargers (updated 2026-11-10).
Looking back, not ahead. Deserved wins grade how well a team has played, from every snap of the games already played. They are not a forecast of the games to come. How well they hold up
−1.0 luck wins · 28th luckiest in the NFL · net EPA per snap 32nd
Bars: deserved win probability, from the snaps50% line
↳Bottom lineEvery result so far matched the play or was a coin flip.
Texans earned it: the snaps said Texans by 20.7, a deserved win probability of more than 99%.
Bars above the line are good: offense adding expected points, defense taking them away. The middle line is league average zero.Rest days and miles traveled, all 32 →
Pass rate over expected: -10.3% (30th most pass-heavy given down, distance and score). 497 offensive plays logged.
Fantasy points allowed per game: QB 17.7 (20th most) · RB 23.0 (12th most) · WR 38.0 (5th most) · TE 9.9 (30th most). Defense vs position
Quarterback · 288 dropbacksJ.Herbert-0.252EPA / dropback-4.9CPOE7.8aDOT35%success
Quarterback · 7 dropbacksD.Uiagalelei+0.164EPA / dropback-39.2CPOE7.0aDOT29%success| Rushing | Car | Yds | TD | EPA/car | Success |
|---|---|---|---|---|---|
| O.Hampton RB | 102 | 369 | 3 | -0.29 | 33% |
| K.Mitchell RB | 46 | 178 | 0 | -0.25 | 35% |
| K.Vidal RB | 36 | 162 | 1 | -0.13 | 31% |
| J.Herbert QB | 10 | 46 | 0 | -0.14 | 50% |
| Targets | Tgt | Target share | Air share | aDOT | Yds | TD | EPA/tgt |
|---|---|---|---|---|---|---|---|
| T.Harris WR | 35 | 15% | 20% | 10.7 | 262 | 0 | +0.17 |
| Q.Johnston WR | 30 | 13% | 23% | 14.3 | 260 | 1 | +0.30 |
| O.Gadsden TE | 30 | 13% | 11% | 7.2 | 172 | 1 | -0.31 |
| L.McConkey WR | 24 | 10% | 16% | 12.4 | 286 | 1 | +0.39 |
| K.Mitchell RB | 22 | 9% | -1% | -1.0 | 103 | 1 | +0.22 |
| C.Kolar TE | 20 | 9% | 6% | 5.4 | 129 | 0 | -0.60 |
| K.Vidal RB | 17 | 7% | 0% | -0.5 | 56 | 1 | -0.22 |
| O.Hampton RB | 13 | 6% | -1% | -0.8 | 63 | 0 | +0.18 |
| Offense | 1 | 2 | 3 | 4 | 5 | 6 | 8 | 9 |
|---|---|---|---|---|---|---|---|---|
| Travis BurkeT | 13 | 69 | 100 | 100 | 100 | 100 | ||
| Logan TaylorG | 39 | 100 | 100 | 100 | 100 | |||
| Jake SlaughterOL | 100 | 100 | 100 | 100 | 100 | 100 | 100 | 96 |
| Joe AltT | 100 | 100 | 100 | 37 | 100 | 94 | ||
| Quentin JohnstonWR | 78 | 81 | 87 | 75 | 82 | 82 | 83 | |
| Tre HarrisWR | 75 | 82 | 58 | 93 | 45 | 51 | 83 | |
| Justin HerbertQB | 100 | 100 | 100 | 100 | 100 | 100 | 100 | 79 |
| Charlie KolarTE | 55 | 62 | 76 | 66 | 62 | 65 | ||
| Cole StrangeG | 100 | 84 | 100 | 100 | 100 | 100 | 100 | 58 |
| KeAndre Lambert-SmithWR | 87 | 3 | 56 | |||||
| Oronde Gadsden IITE | 18 | 44 | 57 | 55 | 58 | 49 | 48 | 46 |
| Omarion HamptonRB | 58 | 63 | 42 | 35 | 30 | 50 | 30 | 40 |
| Scott MatlockFB | 19 | 22 | 36 | 40 | ||||
| Kimani VidalRB | 7 | 10 | 25 | 35 | 42 | 37 | 46 | 39 |
| Defense | 1 | 2 | 3 | 4 | 5 | 6 | 8 | 9 |
|---|---|---|---|---|---|---|---|---|
| Tarheeb StillCB | 88 | 79 | 95 | 98 | 94 | 100 | 100 | 100 |
| Donte JacksonCB | 68 | 59 | 27 | 12 | 89 | |||
| Daiyan HenleyLB | 89 | 84 | 88 | 90 | 95 | 90 | 72 | 87 |
| Elijah MoldenDB | 71 | 52 | 82 | 74 | 93 | 76 | ||
| Akheem MesidorLB | 47 | 49 | 53 | 43 | 63 | 62 | 59 | 74 |
| Tuli TuipulotuLB | 72 | 73 | 82 | 85 | 95 | 85 | 91 | 70 |
| Tony JeffersonS | 52 | 76 | 56 | 73 | 68 | 74 | 78 | 64 |
| Khalil MackLB | 68 | 67 | 74 | 67 | 79 | 74 | 65 | 61 |
| Genesis SmithS | 36 | 57 | 64 | 65 | 40 | 54 | 17 | 59 |
| R.J. MickensS | 43 | 50 | 30 | 48 | 28 | 30 | 59 | |
| Teair TartDL | 41 | 57 | 55 | 62 | 61 | 66 | 44 | 51 |
| Dalvin TomlinsonDL | 53 | 40 | 27 | 51 | 69 | 51 | ||
| Del'Shawn PhillipsLB | 55 | 63 | 47 | 87 | 68 | 79 | 63 | 47 |
| Jamaree CaldwellDL | 53 | 56 | 58 | 70 | 45 | 50 | 46 |

Opponents in the games with him were 3.9 pts weaker on average
With games:Joe Alt OT · 2/6, Ladd McConkey WR · 2/6, Travis Burke OT · 2/6, Quentin Johnston WR · 1/6 +1 more
Before (Wks 1-2)-0.253→From Wk 3 on (Wks 3-6)-0.212

Opponents in the games with him were 1.6 pts stronger on average
Without games:Joe Alt OT · 1/1, Ladd McConkey WR · 1/1
With games:Charlie Kolar TE · 2/7, Travis Burke OT · 2/7, Joe Alt OT · 1/7, Ladd McConkey WR · 1/7 +1 more
Before (Wks 1-4)-0.159→From Wk 5 on (Wks 5-9)-0.328

Opponents in the games with him were 2.6 pts weaker on average
Without games:Ladd McConkey WR · 1/2, Quentin Johnston WR · 1/2, Tre' Harris WR · 1/2
With games:Charlie Kolar TE · 2/6, Travis Burke OT · 2/6, Ladd McConkey WR · 1/6
Before (Wks 1-4)-0.159→From Wk 5 on (Wks 5-9)-0.328

Opponents in the games with him were 6.1 pts weaker on average
Without games:Joe Alt OT · 1/1
With games:Charlie Kolar TE · 2/7, Ladd McConkey WR · 2/7, Travis Burke OT · 2/7, Joe Alt OT · 1/7 +1 more
Before (Wks 2-5)-0.200→From Wk 6 on (Wks 6-9)-0.306
Key Chargers starters who have taken the field in every game so far. A split appears here once one of them sits out a full game.
Bar = average share of his unit's snaps · all 9 starters →
Observed differences between groups of games, not the player's causal effect. Why sample size matters · What EPA is