 Philadelphia EaglesAAA Official Review: What did the Eagles, Joe Milton learn from the QB's first start?
 Broncos DeskBroncos are 7-2, but the snaps say 4.1 wins and the 11th seed in the conference6 h ago
DFS research
The numbers behind this week's slate: what every defense allows to each position, who is getting the ball, recent form and the points the market expects from each team. Research data only: no salaries, no picks.
The slate
Implied team totals from the current total and spread WSH20.0
 NYG22.5O/U 42.5 · NYG -2.5 · MetLife StadiumSun, Nov 15 · 9:30 AM ET
 NE24.5
 DET27.0O/U 51.5 · DET -2.5 · FC Bayern Munich StadiumSun, Nov 15 · 1 PM ET
 BUF29.5
 NYJ21.0O/U 50.5 · BUF -8.5 · MetLife StadiumSun, Nov 15 · 1 PM ET
 CAR23.0
 NO24.5O/U 47.5 · NO -1.5 · Caesars SuperdomeSun, Nov 15 · 1 PM ET
 HOU22.0
 CLE17.5O/U 39.5 · HOU -4.5 · Huntington Bank FieldSun, Nov 15 · 1 PM ET
 JAX28.5
 TEN18.0O/U 46.5 · JAX -10.5 · Nissan StadiumSun, Nov 15 · 1 PM ET
 KC24.5
 ATL21.0O/U 45.5 · KC -3.5 · Mercedes-Benz StadiumSun, Nov 15 · 1 PM ET
 MIA19.0
 IND21.5O/U 40.5 · IND -2.5 · Lucas Oil StadiumSun, Nov 15 · 1 PM ET
 MIN18.5
 GB23.0O/U 41.5 · GB -4.5 · Lambeau FieldSun, Nov 15 · 4:05 PM ET
 LAR25.0
 ARI15.5O/U 40.5 · LAR -9.5 · State Farm StadiumSun, Nov 15 · 4:05 PM ET
 SEA23.5
 LV20.0O/U 43.5 · SEA -3.5 · Allegiant StadiumSun, Nov 15 · 4:25 PM ET
 SF29.5
 DAL26.0O/U 55.5 · SF -3.5 · AT&T StadiumSun, Nov 15 · 8:20 PM ET
 PIT22.5
 CIN26.0O/U 48.5 · CIN -3.5 · Paycor StadiumMon, Nov 16 · 8:15 PM ET
 LAC16.5
 BAL22.0O/U 38.5 · BAL -5.5 · M&T Bank Stadium
Where defenses give up the most
Full tablevsvsvsvsvsvsvsvsPlayer board
382 players · min. 2 games · sorted by fantasy points per game| Player | Matchup | Recent games | ||||||||
|---|---|---|---|---|---|---|---|---|---|---|
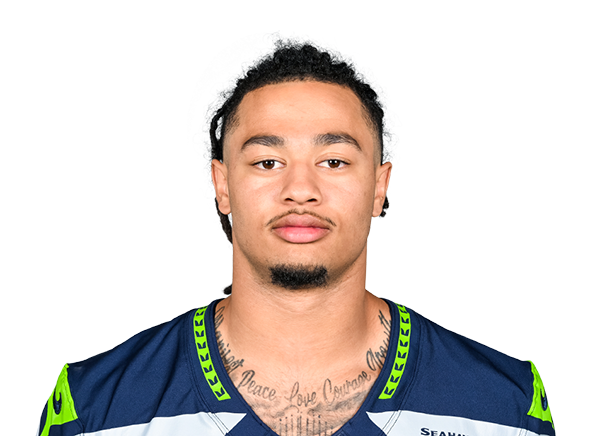 Jaxon Smith-NjigbaWRSEA · 9 gp | @LV | 28.1 | 24.4▼ | 45.5 | 35% | 83% | 8.2 | 13 | 23.5 | |
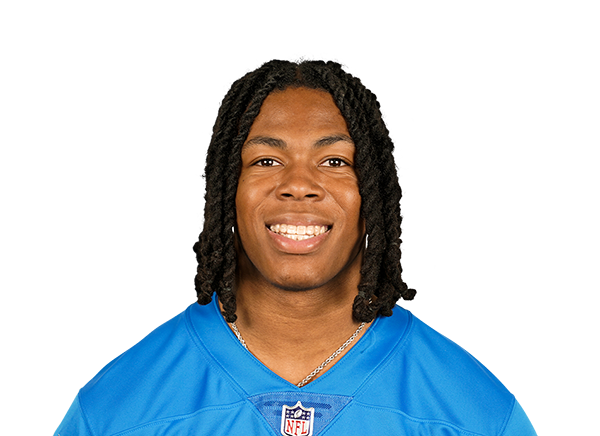 Jahmyr GibbsRBDET · 8 gp | vsNE | 27.9 | 20.8▼ | 41.4 | 17% | 78% | 26.4 | 29 | 27.0 | |
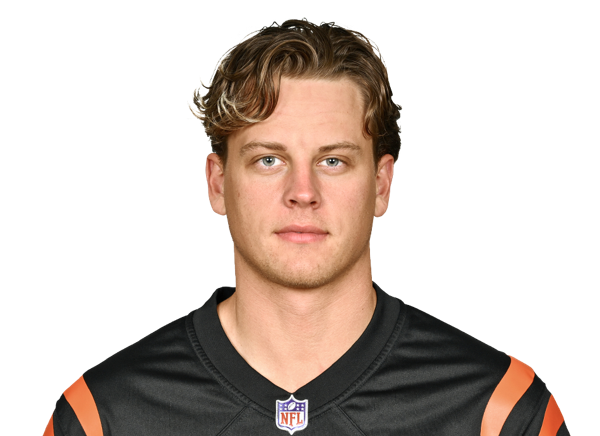 Joe BurrowQBCIN · 8 gp | vsPIT | 26.5 | 34.6▲ | 45.5 | – | 98% | 2.9 | 30 | 26.0 | |
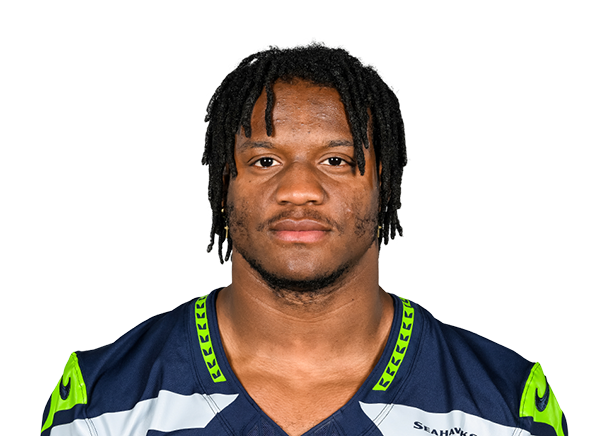 Kenneth Walker IIIRBKC · 8 gp | @ATL | 26.4 | 20.5▼ | 39.3 | 15% | 73% | 23.1 | 3 | 24.5 | |
 Josh AllenQBBUF · 8 gp | @NYJ | 26.3 | 19.6▼ | 40.8 | – | 98% | 7.8 | 19 | 29.5 | |
 CeeDee LambWRDAL · 9 gp | vsSF | 23.6 | 24.9• | 44.3 | 33% | 84% | 8.0 | 27 | 26.0 | |
 Brock BowersTELV · 7 gp | vsSEA | 22.4 | 22.6• | 30.6 | 22% | 90% | 7.0 | 25 | 20.0 | |
 C.J. StroudQBHOU · 8 gp | @CLE | 22.3 | 27.0▲ | 39.4 | – | 96% | 2.5 | 27 | 22.0 | |
 Jordan LoveQBGB · 9 gp | vsMIN | 22.2 | 25.9▲ | 37.2 | – | 96% | 1.3 | 32 | 23.0 | |
 Drake MayeQBNE · 9 gp | @DET | 21.8 | 25.1▲ | 42.5 | – | 94% | 5.2 | 1 | 24.5 | |
 Brock PurdyQBSF · 8 gp | @DAL | 21.8 | 19.2▼ | 31.3 | – | 97% | 4.9 | 6 | 29.5 | |
 Christian WatsonWRGB · 9 gp | vsMIN | 21.1 | 21.7• | 35.7 | 22% | 69% | 5.4 | 30 | 23.0 | |
 Tee HigginsWRCIN · 8 gp | vsPIT | 21.1 | 30.2▲ | 40.5 | 23% | 81% | 6.0 | 24 | 26.0 | |
 Bijan RobinsonRBATL · 9 gp | vsKC | 21.0 | 18.2▼ | 38.3 | 16% | 81% | 22.2 | 22 | 21.0 | |
 Christian McCaffreyRBSF · 8 gp | @DAL | 21.0 | 25.5▲ | 31.7 | 20% | 68% | 17.3 | 6 | 29.5 | |
 Ja'Marr ChaseWRCIN · 8 gp | vsPIT | 20.7 | 28.6▲ | 34.5 | 25% | 89% | 6.6 | 24 | 26.0 | |
 Kirk CousinsQBLV · 9 gp | vsSEA | 20.5 | 21.4• | 28.2 | – | 100% | 2.4 | 31 | 20.0 | |
 Amon-Ra St. BrownWRDET · 8 gp | vsNE | 20.4 | 18.8▼ | 38.2 | 32% | 75% | 7.9 | 2 | 27.0 | |
 James Cook IIIRBBUF · 8 gp | @NYJ | 20.3 | 20.7• | 26.8 | 8% | 61% | 22.6 | 9 | 29.5 | |
 Bryce YoungQBCAR · 8 gp | @NO | 20.1 | 14.0▼ | 35.4 | – | 92% | 1.4 | 18 | 23.0 | |
 Jayden DanielsQBWSH · 6 gp | @NYG | 20.0 | 18.2▼ | 33.3 | – | 100% | 5.2 | 8 | 20.0 | |
 Jared GoffQBDET · 8 gp | vsNE | 19.9 | 12.8▼ | 32.8 | – | 100% | 2.4 | 13 | 27.0 | |
 Dak PrescottQBDAL · 9 gp | vsSF | 19.8 | 21.5▲ | 29.8 | – | 100% | 2.8 | 24 | 26.0 | |
 Trevor LawrenceQBJAX · 8 gp | @TEN | 19.8 | 21.8▲ | 31.3 | – | 94% | 2.6 | 5 | 28.5 | |
 Tyler ShoughQBNO · 8 gp | vsCAR | 19.7 | 20.5• | 29.2 | – | 99% | 4.3 | 22 | 24.5 | |
 Matthew GoldenWRGB · 9 gp | vsMIN | 19.3 | 22.1▲ | 35.4 | 28% | 82% | 6.0 | 30 | 23.0 | |
 Jaylen WarrenRBPIT · 8 gp | @CIN | 19.2 | 17.9• | 39.8 | 14% | 65% | 18.0 | 15 | 22.5 | |
 Patrick MahomesQBKC · 8 gpQuestionable | @ATL | 19.1 | 17.6• | 32.0 | – | 98% | 2.9 | 17 | 24.5 | |
 Chuba HubbardRBCAR · 8 gp | @NO | 19.1 | 16.2▼ | 28.9 | 11% | 81% | 20.0 | 1 | 23.0 | |
 Chris OlaveWRNO · 8 gp | vsCAR | 18.8 | 14.2▼ | 31.2 | 28% | 73% | 7.0 | 16 | 24.5 | |
 Trey McBrideTEARI · 9 gp | vsLAR | 18.4 | 20.9▲ | 30.1 | 27% | 90% | 8.1 | 26 | 15.5 | |
 Javonte WilliamsRBDAL · 9 gp | vsSF | 18.4 | 18.9• | 31.3 | 9% | 70% | 19.8 | 18 | 26.0 | |
 Matthew StaffordQBLAR · 9 gp | @ARI | 18.2 | 13.3▼ | 31.0 | – | 100% | 1.7 | 3 | 25.0 | |
 Davante AdamsWRLAR · 6 gp | @ARI | 18.0 | 12.1▼ | 42.5 | 15% | 81% | 5.0 | 15 | 25.0 | |
 Kyren WilliamsRBLAR · 9 gp | @ARI | 17.9 | 13.7▼ | 36.7 | 14% | 61% | 18.1 | 17 | 25.0 | |
 Malik NabersWRNYG · 8 gp | vsWSH | 17.7 | 20.6▲ | 32.1 | 30% | 79% | 6.6 | 7 | 22.5 | |
 Jonathan TaylorRBIND · 9 gp | vsMIA | 17.5 | 12.4▼ | 29.2 | 13% | 66% | 20.8 | 8 | 21.5 | |
 Omar Cooper Jr.WRNYJ · 4 gp | vsBUF | 17.1 | 21.5▲ | 25.5 | 9% | 76% | 5.0 | 11 | 21.0 | |
 Zay FlowersWRBAL · 8 gp | vsLAC | 17.1 | 12.0▼ | 30.7 | 27% | 78% | 6.1 | 5 | 22.0 | |
 Tetairoa McMillanWRCAR · 8 gp | @NO | 16.4 | 11.8▼ | 48.2 | 25% | 79% | 5.8 | 17 | 23.0 | |
 Derrick HenryRBBAL · 9 gp | vsLAC | 16.4 | 8.5▼ | 38.3 | 6% | 49% | 20.8 | 12 | 22.0 | |
 Bhayshul TutenRBJAX · 8 gp | @TEN | 16.3 | 22.2▲ | 32.9 | 7% | 48% | 17.1 | 16 | 28.5 | |
 Isaiah LikelyTENYG · 8 gp | vsWSH | 15.9 | 13.8▼ | 32.4 | 27% | 84% | 5.8 | 3 | 22.5 | |
 Ashton JeantyRBLV · 9 gp | vsSEA | 15.8 | 13.0▼ | 35.7 | 18% | 59% | 17.3 | 20 | 20.0 | |
 Nico CollinsWRHOU · 6 gp | @CLE | 15.8 | 9.7▼ | 33.8 | 14% | 71% | 5.0 | 19 | 22.0 | |
 Drew LockQBSEA · 3 gpQuestionable | @LV | 15.6 | 15.6• | 21.4 | – | 97% | 2.3 | 2 | 23.5 | |
 Tony PollardRBTEN · 8 gp | vsJAX | 15.3 | 26.3▲ | 39.5 | 9% | 78% | 18.4 | 31 | 18.0 | |
 Aaron RodgersQBPIT · 8 gp | @CIN | 15.3 | 12.0▼ | 23.7 | – | 98% | 1.5 | 14 | 22.5 | |
 Geno SmithQBNYJ · 9 gp | vsBUF | 14.9 | 16.3• | 28.0 | – | 100% | 2.7 | 15 | 21.0 | |
 Jacoby BrissettQBARI · 8 gp | vsLAR | 14.8 | 9.6▼ | 26.3 | – | 86% | 3.8 | 23 | 15.5 | |
 Tank DellWRHOU · 2 gp | @CLE | 14.5 | 14.5• | 23.5 | 4% | 35% | 3.0 | 19 | 22.0 | |
 George KittleTESF · 8 gp | @DAL | 14.4 | 14.5• | 26.2 | 23% | 86% | 4.8 | 19 | 29.5 | |
 Breece HallRBNYJ · 4 gp | vsBUF | 14.3 | 11.5▼ | 22.8 | 5% | 52% | 19.8 | 10 | 21.0 | |
 Parker WashingtonWRJAX · 8 gp | @TEN | 14.1 | 9.4▼ | 33.4 | 25% | 69% | 3.9 | 1 | 28.5 | |
 Malik WillisQBMIA · 8 gpQuestionable | @IND | 14.0 | 15.5• | 26.0 | – | 100% | 4.8 | 7 | 19.0 | |
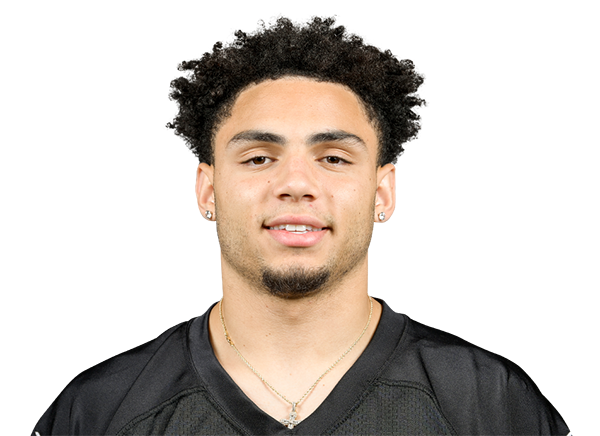 Drake LondonWRATL · 9 gp | vsKC | 14.0 | 11.1▼ | 31.4 | 28% | 91% | 5.1 | 31 | 21.0 | |
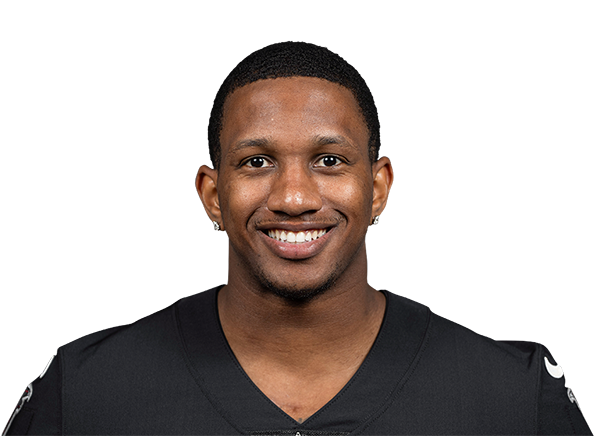 Michael Penix Jr.QBATL · 7 gp | vsKC | 13.9 | 12.3▼ | 20.4 | – | 100% | 2.9 | 29 | 21.0 | |
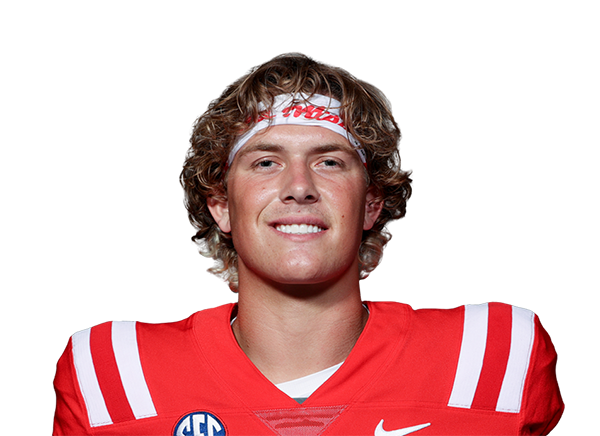 Jaxson DartQBNYG · 2 gp | vsWSH | 13.7 | 13.7• | 26.6 | – | 56% | 5.5 | 4 | 22.5 | |
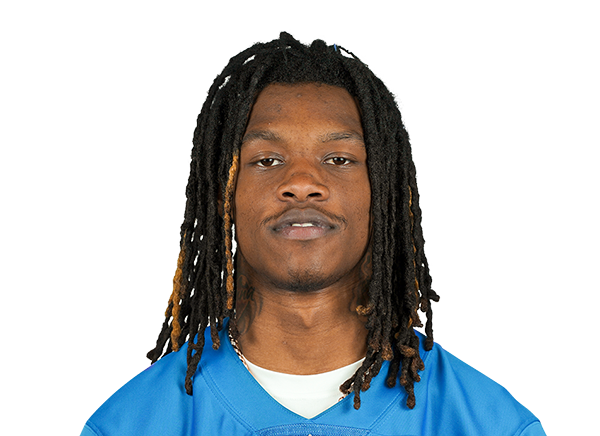 Jameson WilliamsWRDET · 8 gp | vsNE | 13.6 | 16.0▲ | 26.1 | 17% | 83% | 3.6 | 2 | 27.0 | |
 Justin JeffersonWRMIN · 7 gp | @GB | 13.3 | 10.5▼ | 29.2 | 24% | 93% | 4.6 | 6 | 18.5 |
How it's scored
Fantasy points follow DraftKings-style full-PPR scoring, computed from each game's official box score (2026 regular season). Two-point conversions are not in the box score and are left out. Target share is the player's share of his team's targets (nflverse play-by-play); snap share is the offensive snap percentage. The opponent rank (DvP) puts the defense that allows the most fantasy points to the position at 1. Implied team totals split the current over/under by the spread. Injury tags come from the latest team reports. This page is research data, not advice: there are no salaries here and nothing on it is a pick.