 ESPNFantasy buzz: James Cook III helps Bills overcome tough Vikings defense
 Detroit LionsTWENTYMAN: 5 stats that stand out following Lions' Week 9 victory
 ESPNSeven things Solak thinks for NFL Week 10: Jaguars trades, All-Pro picks, more
 Pittsburgh SteelersAsked and Answered: Nov. 10
 ESPNCommanders running low on time to 'put it all together'
 New York GiantsGiants Now: Michael Strahan offers high praise of Arvell Reese
 Philadelphia EaglesAAA Official Review: What did the Eagles, Joe Milton learn from the QB's first start?
 ESPNVikings left at QB crossroads after Carson Wentz's poor MNF showing vs. Bills
 Broncos DeskBroncos are 7-2, but the snaps say 4.1 wins and the 11th seed in the conference6 h ago
 Pro Football RumorsSeahawks Interested In Adding WR Depth
 InjuryCarl Granderson: Active → Cleared8 h ago
Ref Crew Report
18 officiating crews, every accepted flag of the 2026 season. The league averages 14.7 flags and 118 yards a game; Scott Novak's crew throws 18.2, Brad Rogers's 12. Home teams draw 50% of the flags overall. Numbers only: no crew is judged right or wrong here.
Flags thrown vs games moved
↳Bottom lineScott Novak's crew throws the most flags (18.2 a game); Scott Novak's flags move the most win probability (51 points a game, league 39).
?How to read this chart
- One circle = one officiating crew,
- named after its referee (the crew chief). Bigger circle = more games worked.
- Left to right:
- accepted flags per game. Further right = a crew that calls more.
- Bottom to top:
- how much those flags changed the game, measured as win probability moved per game (the chance of winning, in points, that swings on each flag, added up). Higher = flags that hit bigger moments.
- The two dashed lines
- are the league averages: top right is many flags that matter, bottom left few flags that rarely change anything. Tap a circle for the crew page.
Every crew, by flags per game
↳Bottom lineAlan Eck's crew is furthest from 50/50: 61% of its flags go against the home team.
?How to read the crew cards
- Big number:
- accepted flags per game. The bar under it compares the crew with the busiest crew; the small tick is the league average (14.7).
- Home / away scale:
- which side the crew's flags land on. A level beam is an even split; the % under it says it exactly: above 50% means more flags against the home team.
- Win prob. moved:
- how many points of win probability the crew's flags swing in a typical game.
- Tags at the bottom:
- penalties the crew calls more often than the league: ×2.0 means twice as often. Small samples, so read them as hints.


The league's flags, per game
↳Bottom lineOffensive Holding is the most common flag: 3.12 a game.
?How to read this chart
- One bar per penalty type,
- as long as how many times it is called in an average game (the number on the right), all crews combined.
Every referee since 1999
?How to read this chart
- One row = one referee
- with at least 48 games since 1999; active referees first.
- One cell = one season.
- Yellow: that season he called more flags a game than the league average of that year; blue-grey: fewer; dim: about average. The brighter the cell, the further from average; empty cells are seasons he did not work.
- The columns on the right:
- career games, flags a game above (+) or below (−) the average, how often the home team won his games, and how often games went over the betting total.
?How to read the four boards
- Home cooking / Road friendly:
- the referees whose games the home team wins most and least often, against 56% league-wide.
- Over the total:
- how often his games score more than the betting total, against 49% league-wide.
- Flag-happy:
- flags a game above each season's average, over the whole career.
- John Hussey185 games · active66%
- Larry Nemmers134 games65%
- Carl Cheffers291 games · active61%
- Alan Eck54 games · active67%
- Jerome Boger260 games60%
- Land Clark100 games · active42%
- Bill Leavy211 games48%
- Scott Novak116 games · active46%
- Adrian Hill117 games · active48%
- Craig Wrolstad198 games · active51%
- Gerry Austin129 games60%
- Scott Green140 games60%
- Jerome Boger260 games55%
- John Parry182 games56%
- Gene Steratore185 games53%
- Larry Nemmers134 games+1.0
- Shawn Hochuli135 games · active+0.9
- Jerome Boger260 games+0.9
- Adrian Hill117 games · active+0.8
- Walt Anderson268 games+0.7
How to read the boards: with 41 referees, one or two will sit far from the league by chance alone, so a single leader is not proof of a tendency. The referee also does not pick the games: schedules, teams and weather all ride along. Totals and spreads are closing lines from nflverse; pushes are left out.
MethodHow this is built
- Archive
- Referee for every game since 1999 from nflverse; accepted flags per team from the play-by-play; flags compared with each season's own average because flag rates move with the rules. Super Bowls are left out of home and away numbers.
- Crews
- Grouped by referee (the crew chief), from the seven officials listed for each game. Crews with at least two games.
- Flags
- Accepted penalties only, the same set as the Flag Ledger. Declined and offsetting fouls are out.
- Win probability moved
- The absolute change in win probability on every accepted flag, summed per game. It measures how much the crew's flags mattered, not whether they were right.
- Signature calls
- Penalty types the crew calls more often per game than the league (×2.0 = twice as often), only for fouls called at least 12 times league-wide. Small samples: a crew has worked only a handful of games.
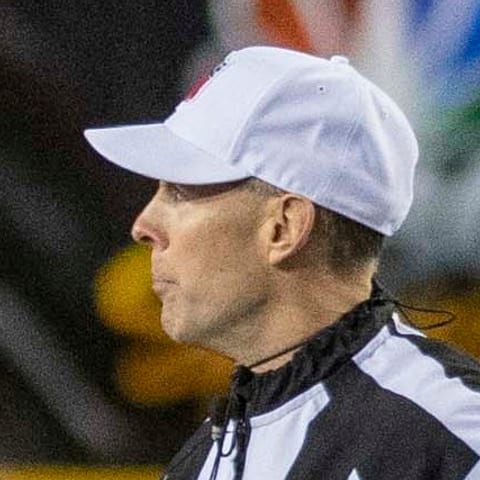
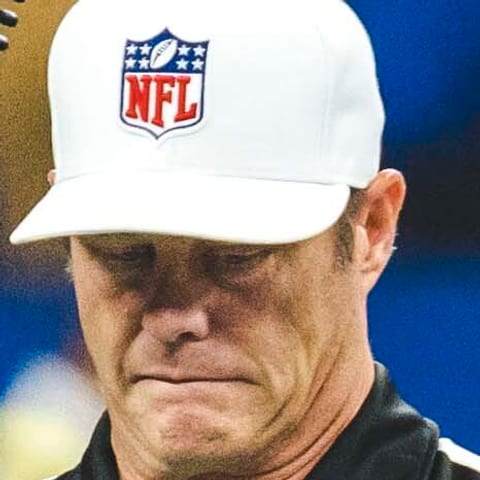
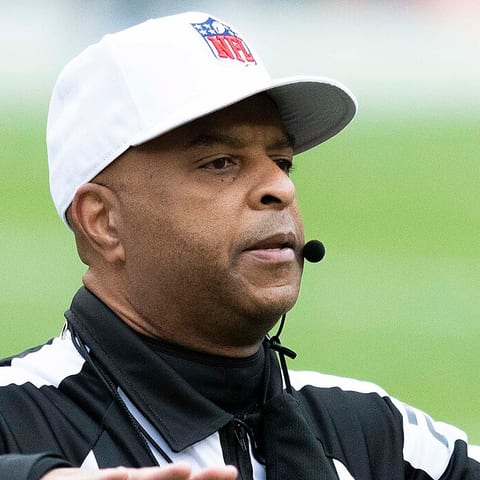
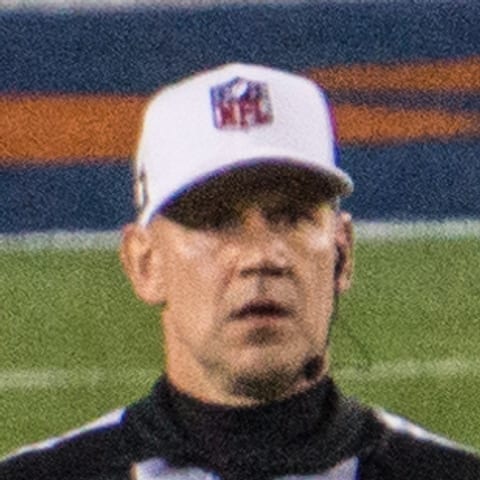
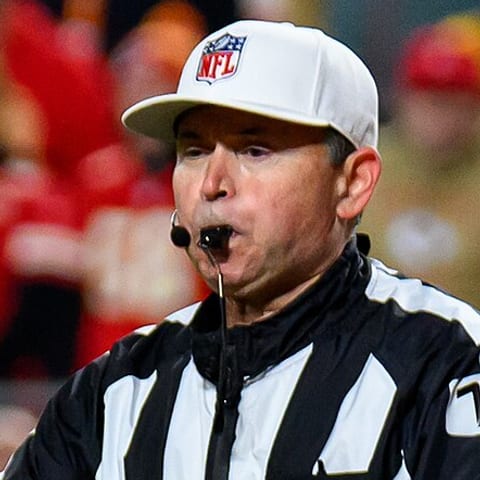
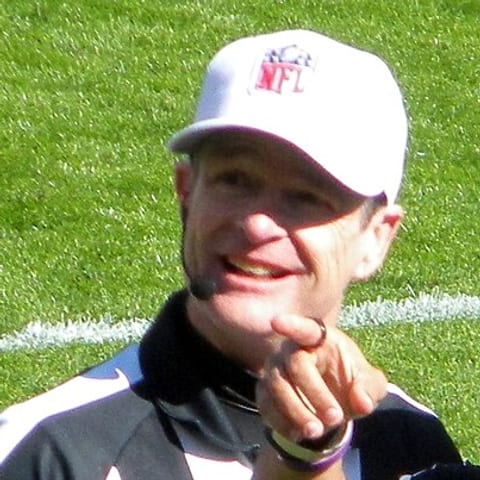
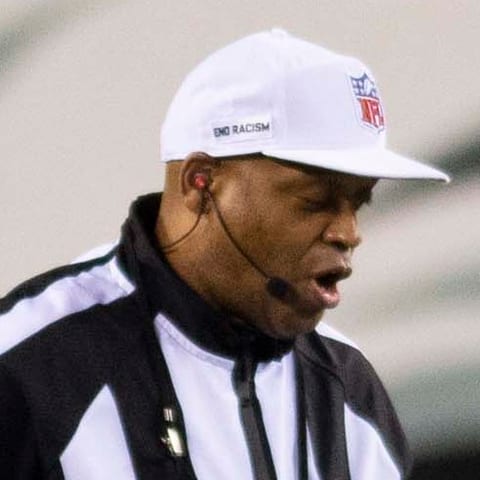
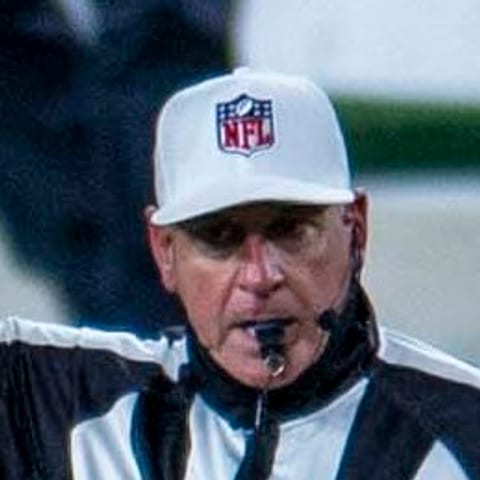
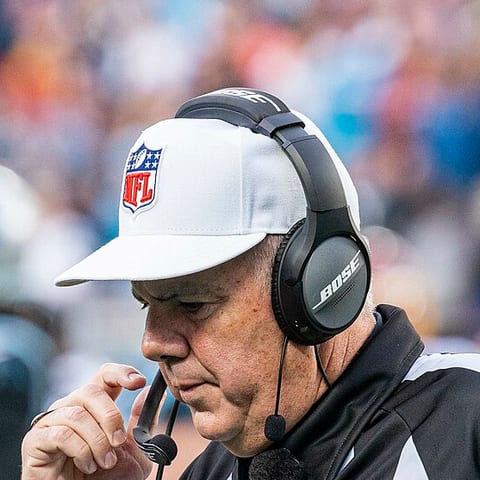
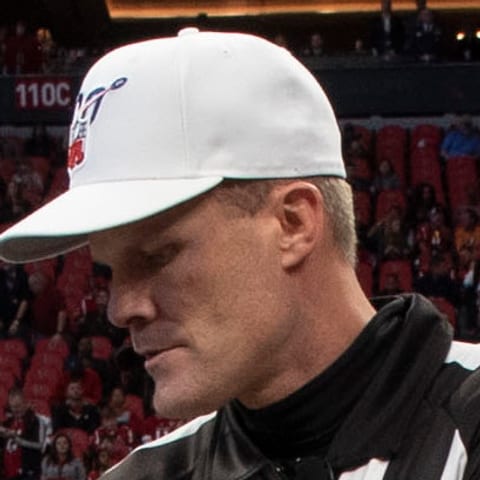
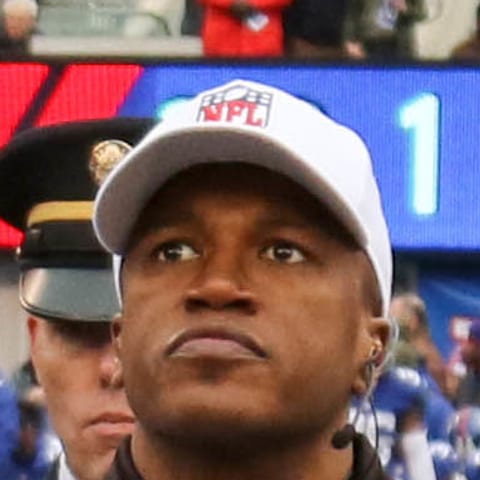
Referee photos from Wikimedia Commons, cropped: Scott Novak by All-Pro Reels (CC BY-SA 2.0); Craig Wrolstad by All-Pro Reels (CC BY-SA 2.0); Adrian Hill by All-Pro Reels (CC BY-SA 2.0); Clete Blakeman by Arnie Papp (CC BY 2.0); Brad Allen by All-Pro Reels (CC BY-SA 4.0); Land Clark by Doctorindy (CC BY 4.0); Ronald Torbert by All-Pro Reels (CC BY-SA 2.0); John Hussey by All-Pro Reels (CC BY-SA 2.0); Bill Vinovich by All-Pro Reels (CC BY-SA 2.0); Clay Martin by Lisa Ferdinando (CC BY 2.0); Alex Kemp by All-Pro Reels (CC BY-SA 4.0); Carl Cheffers by Erik Drost (CC BY 2.0); Shawn Smith by Brandon O'Connor (Public domain); Brad Rogers by All-Pro Reels (CC BY-SA 4.0). Referees without a freely licensed photo are shown with their initials.