EPA allowed, better with
Opponents in the games with him were 4.6 pts stronger on average
With games:Deebo Samuel Sr. WR · 3/7, Jordan Watkins WR · 2/7, Mike Evans WR · 2/7
Before (Wks 1-2)-0.133→From Wk 3 on (Wks 3-6)-0.025
Over the last 4 games the run defense has allowed -0.34 EPA per rush (78 rushes), 1st among 32 teams over their own last 4. In the 4 games before: -0.06 EPA per rush (103 rushes), 19th.
Season EPA ranks ↓▼Emerging problemDropback offenseEPA per dropback1st→14thOver the last 4 games the dropback offense has posted +0.08 EPA per dropback (140 dropbacks), 14th among 32 teams over their own last 4. In the 4 games before: +0.57 EPA per dropback (122 dropbacks), 1st.
Season EPA ranks ↓⇄Usage shiftMalik Mustapha, Sdefensive snap share17%→95%Malik Mustapha has played 95% of defensive snaps over the last 4 games, up from 17% in the 4 games before. On the field in 4 of 4 and 4 of 4; a game without a snap counts as zero.
Snap counts, week by week ↓The San Francisco 49ers are 7-1 in the 2026 season, 1st in the NFC West and the No. 1 seed in the NFC, with a point differential of +79. On offense they rank 1st in the league in EPA per play (+0.180); on defense they rank 8th (-0.073 allowed). The Pigskin Nightly model gives them a 99% chance to make the playoffs and 22.6% to win the Super Bowl. The San Francisco 49ers play next on the road at the Dallas Cowboys on Sun, Nov 15, 4:25 PM ET (Week 10), on Fox.
7-1, 1st in the NFC West. Home 5-0, road 2-1, division 3-0, conference 4-1, current streak W1. Points: 235 scored, 156 allowed.
The San Francisco 49ers play next on the road at the Dallas Cowboys on Sun, Nov 15, 4:25 PM ET (Week 10), on Fox.
99% to make the playoffs, 95% to win the NFC West, 67% to earn the No. 1 seed and the bye, 42.1% to win the NFC and 22.6% to win the Super Bowl, from 10,000 simulations of the rest of the season (projected record 13.5-3.5).
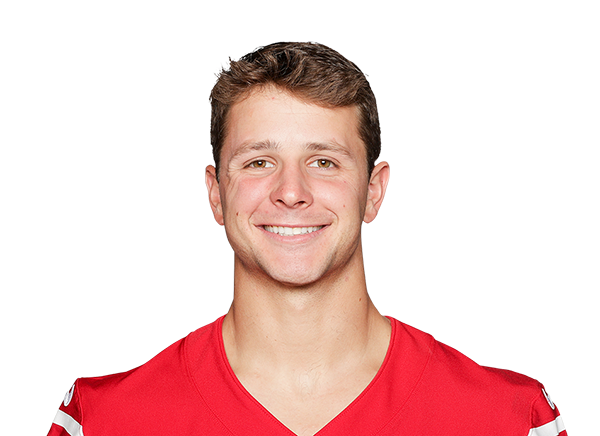
Brock Purdy is first on the 49ers depth chart at quarterback, with Mac Jones behind.
Out, doubtful or on injured reserve: Brandon Aiyuk (WR, out, personal), Deebo Samuel Sr. (WR, out, hamstring), Gracen Halton (DT, out, ankle), Mike Evans (WR, out, achilles), C.J. West (DT, injured reserve, knee), Christian Kirk (WR, injured reserve, knee - meniscus) and Nate Hobbs (CB, injured reserve, groin). Questionable: Deommodore Lenoir (CB, questionable, foot) and Renardo Green (CB, questionable, back).
Offense: 1st in EPA per play (+0.180), 1st on dropbacks, 3rd on runs, success rate 52.9%. Defense: 8th in EPA allowed (-0.073), 11th against the pass, 1st against the run.

Pigskin Nightly, “San Francisco 49ers 2026: record, EPA, depth chart and injuries”, https://pigskinnightly.com/teams/49ers (updated 2026-11-10).
Looking back, not ahead. Deserved wins grade how well a team has played, from every snap of the games already played. They are not a forecast of the games to come. How well they hold up
−0.1 luck wins · 18th luckiest in the NFL · net EPA per snap 2nd
Bars: deserved win probability, from the snaps50% line
↳Bottom lineEvery result so far matched the play or was a coin flip.
49ers earned it: the snaps said 49ers by 15.9, a deserved win probability of more than 99%.
Bars above the line are good: offense adding expected points, defense taking them away. The middle line is league average zero.Rest days and miles traveled, all 32 →
Pass rate over expected: +0.7% (6th most pass-heavy given down, distance and score). 467 offensive plays logged.
Fantasy points allowed per game: QB 16.1 (24th most) · RB 21.0 (18th most) · WR 27.6 (27th most) · TE 14.5 (13th most). Defense vs position
Quarterback · 262 dropbacksB.Purdy+0.306EPA / dropback+4.9CPOE8.1aDOT55%success| Rushing | Car | Yds | TD | EPA/car | Success |
|---|---|---|---|---|---|
| C.McCaffrey RB | 102 | 457 | 9 | +0.13 | 51% |
| K.Black RB | 68 | 303 | 1 | -0.08 | 44% |
| B.Purdy QB | 15 | 25 | 0 | -0.02 | 73% |
| D.Samuel WR | 9 | 78 | 0 | -0.30 | 44% |
| Targets | Tgt | Target share | Air share | aDOT | Yds | TD | EPA/tgt |
|---|---|---|---|---|---|---|---|
| G.Kittle TE | 53 | 23% | 23% | 8.2 | 483 | 5 | +0.28 |
| C.McCaffrey RB | 45 | 20% | 7% | 2.8 | 270 | 1 | +0.11 |
| M.Evans WR | 40 | 17% | 30% | 14.6 | 500 | 4 | +1.02 |
| D.Samuel WR | 20 | 9% | 3% | 2.5 | 126 | 2 | +0.39 |
| J.Watkins WR | 13 | 6% | 11% | 16.5 | 224 | 1 | +0.95 |
| J.Cowing WR | 11 | 5% | 7% | 12.1 | 52 | 0 | -0.53 |
| K.Juszczyk FB | 11 | 5% | 5% | 7.7 | 76 | 2 | +0.37 |
| D.Robinson WR | 10 | 4% | 6% | 10.7 | 106 | 1 | +0.50 |
| Offense | 1 | 2 | 3 | 4 | 5 | 6 | 7 | 9 |
|---|---|---|---|---|---|---|---|---|
| Colton McKivitzOL | 100 | 100 | 100 | 100 | 100 | 100 | 100 | 100 |
| Connor ColbyOL | 100 | 100 | 100 | 100 | 100 | 100 | 100 | 100 |
| Dominick PuniOL | 100 | 88 | 100 | 100 | 100 | 100 | 100 | 100 |
| Brock PurdyQB | 100 | 85 | 100 | 100 | 100 | 100 | 100 | 92 |
| Jake BrendelOL | 100 | 85 | 100 | 100 | 100 | 100 | 100 | 92 |
| Trent WilliamsT | 100 | 85 | 59 | 100 | 100 | 100 | 100 | 92 |
| George KittleTE | 46 | 48 | 85 | 91 | 92 | 89 | 91 | 78 |
| Jordan WatkinsWR | 28 | 38 | 37 | 76 | 76 | 77 | ||
| Christian McCaffreyRB | 55 | 52 | 83 | 74 | 82 | 85 | 52 | 68 |
| Kyle JuszczykFB | 51 | 44 | 56 | 41 | 56 | 48 | 52 | |
| Demarcus RobinsonWR | 63 | 31 | 51 | |||||
| Luke FarrellTE | 71 | 54 | 33 | 44 | 60 | 48 | 39 | 45 |
| Brandin CooksWR | 12 | 40 | 52 | 68 | 44 | |||
| Jacob CowingWR | 8 | 46 | 31 | 32 | 43 | 24 | 39 | 25 |
| Defense | 1 | 2 | 3 | 4 | 5 | 6 | 7 | 9 |
|---|---|---|---|---|---|---|---|---|
| Fred WarnerLB | 87 | 83 | 100 | 98 | 100 | 100 | 100 | 100 |
| Dre GreenlawLB | 66 | 69 | 71 | 85 | 41 | 91 | 98 | |
| Renardo GreenCB | 100 | 100 | 90 | 98 | 100 | 100 | 99 | 86 |
| Deommodore LenoirDB | 100 | 95 | 83 | 98 | 100 | 100 | 99 | 86 |
| Malik MustaphaS | 10 | 5 | 22 | 32 | 100 | 100 | 99 | 82 |
| Nick BosaDL | 59 | 68 | 78 | |||||
| Upton StoutCB | 59 | 58 | 63 | 55 | 48 | 42 | 74 | |
| DeForest BucknerDL | 68 | |||||||
| Ji'Ayir BrownS | 90 | 95 | 95 | 97 | 100 | 100 | 100 | 64 |
| Osa OdighizuwaDL | 59 | 69 | 82 | 77 | 75 | 75 | 72 | 60 |
| Marques SigleS | 100 | 100 | 83 | 68 | 56 | |||
| Romello HeightDL | 49 | 54 | 56 | 59 | 60 | 60 | 44 | |
| Keion WhiteDL | 49 | 54 | 69 | 74 | 68 | 75 | 54 | 42 |
| Mykel WilliamsDL | 37 | 45 | 49 | 40 |

Opponents in the games with him were 4.6 pts stronger on average
With games:Deebo Samuel Sr. WR · 3/7, Jordan Watkins WR · 2/7, Mike Evans WR · 2/7
Before (Wks 1-2)-0.133→From Wk 3 on (Wks 3-6)-0.025

Opponents in the games with him were 0.9 pts weaker on average
With games:Deebo Samuel Sr. WR · 3/6, Mike Evans WR · 2/6, Romello Height EDGE · 1/6
No games before his first absence (Wk 1)→From Wk 1 on (Wks 1-4)+0.291

Opponents in the games with him were 2.2 pts stronger on average
Without games:Deebo Samuel Sr. WR · 2/2
With games:Jordan Watkins WR · 2/6, Deebo Samuel Sr. WR · 1/6, Romello Height EDGE · 1/6
Before (Wks 3-6)+0.166→From Wk 7 on (Wks 7-9)+0.104

Opponents in the games with him were 2.2 pts stronger on average
Without games:Mike Evans WR · 2/3
With games:Jordan Watkins WR · 2/5, Romello Height EDGE · 1/5
Before (Wks 2-5)+0.219→From Wk 6 on (Wks 6-9)+0.137
Key 49ers starters who have taken the field in every game so far. A split appears here once one of them sits out a full game.
Bar = average share of his unit's snaps · all 11 starters →
Observed differences between groups of games, not the player's causal effect. Why sample size matters · What EPA is