Green Bay PackersMike's Mid-Week Chat | Nov. 11, 2026
 InjuryGarrett Wilson: Out → Questionablejust now
 InjuryLucas Patrick: Doubtful → Outjust now
 Pro Football RumorsGM Mike Borgonzi: Titans Would ‘Love To Have’ Tony Pollard Back In 2027
 San Francisco 49ersThe 49ers Acquire WR Keenan Allen
 New Orleans SaintsGame Preview: Panthers vs. Saints | 2026 NFL Week 10
 Texans DeskTexans offense posts its best EPA per play of the year in Week 916 min ago
 Rams DeskRams pass on 58% of early downs again after a 41% week, and Puka Nacua feeds on it17 min ago
 Panthers DeskCarolina's offense rebounds in Week 9 after two negative-EPA games27 min ago
 Falcons DeskFalcons' eighth-ranked run game has slipped as the offense sits 25th27 min ago
 Kansas City ChiefsCinco cosas que debes saber sobre Josh Downs, el nuevo receptor de Chiefs
 InjuryDenzel Boston: Active → Questionable34 min ago
 Eagles DeskEagles run defense ranks 31st while the offense stalls at a 24% success rate36 min ago
 Baltimore RavensMailbag: Will Jacoby Brissett Turn the Ravens' Season Around?
 Buccaneers DeskBuccaneers defense leads the league in EPA allowed while the passing game ranks 30th47 min ago
 Bears DeskBears pass on early downs 64% in Week 9 and the offense stalls47 min ago
 Pro Football RumorsColts Designate DE Arden Key For Return
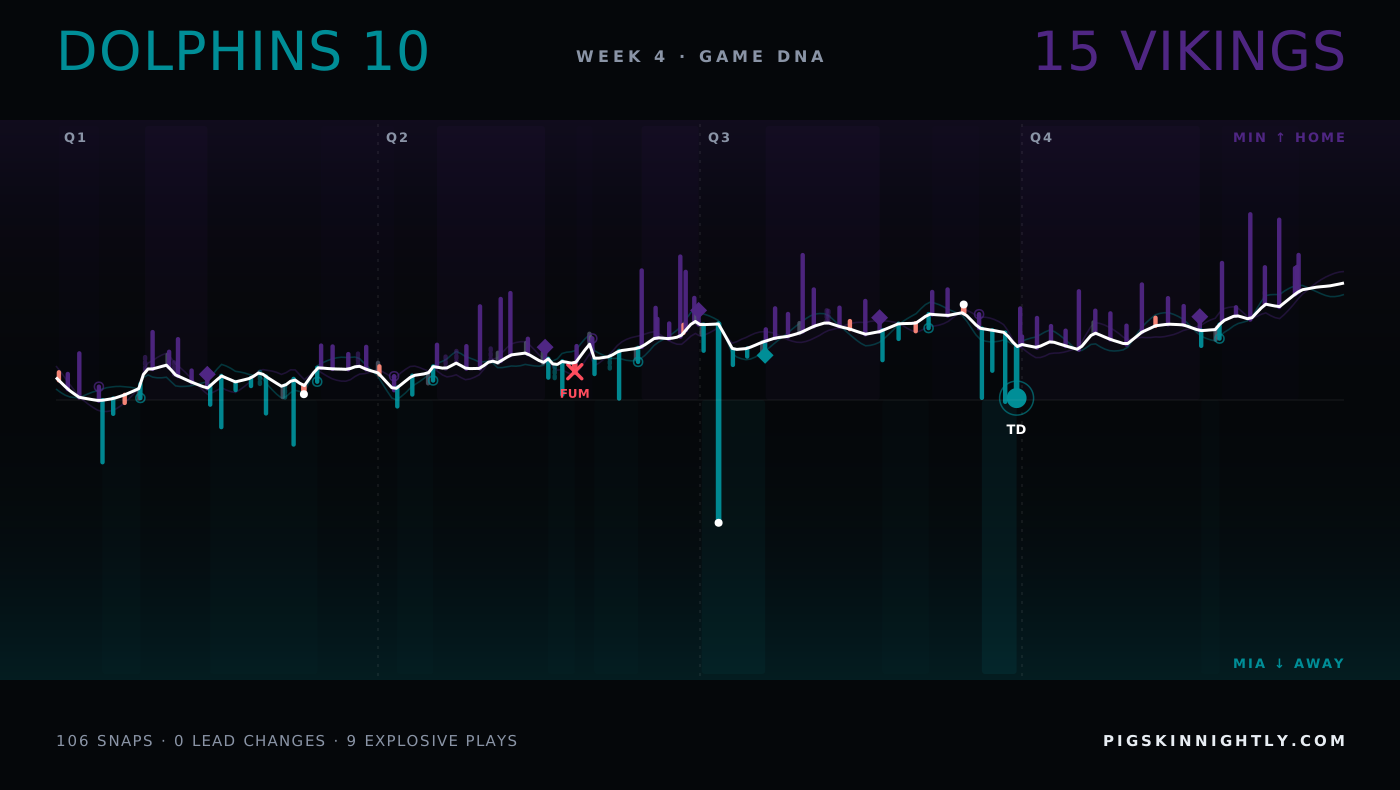
Week 4 · 2026Dolphins 10 · 15 Vikings
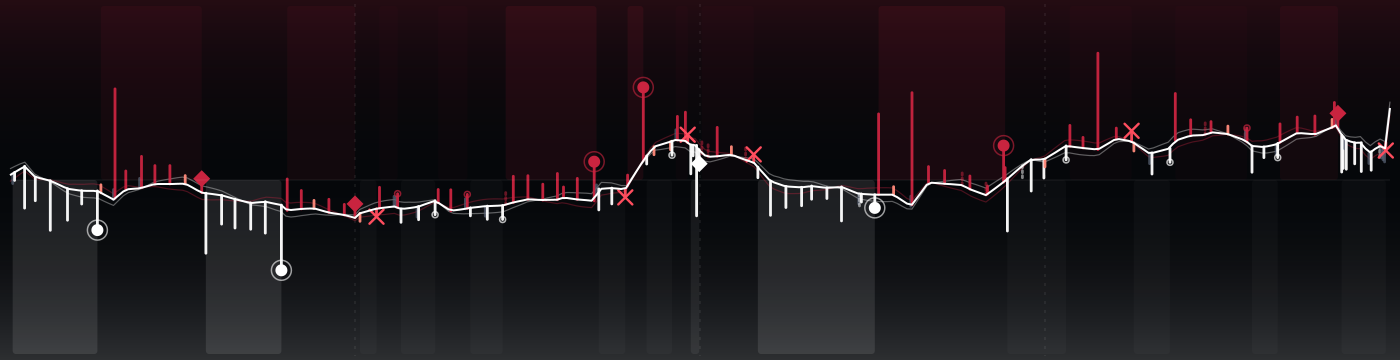
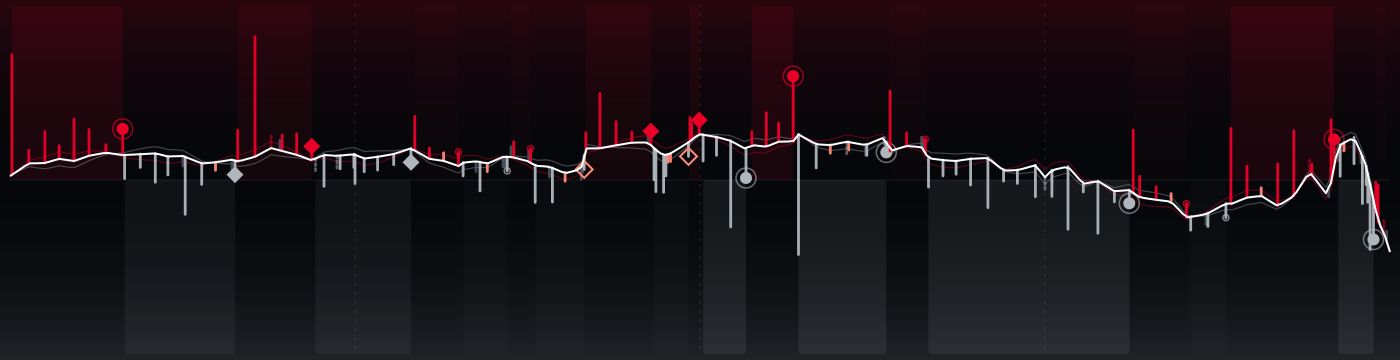
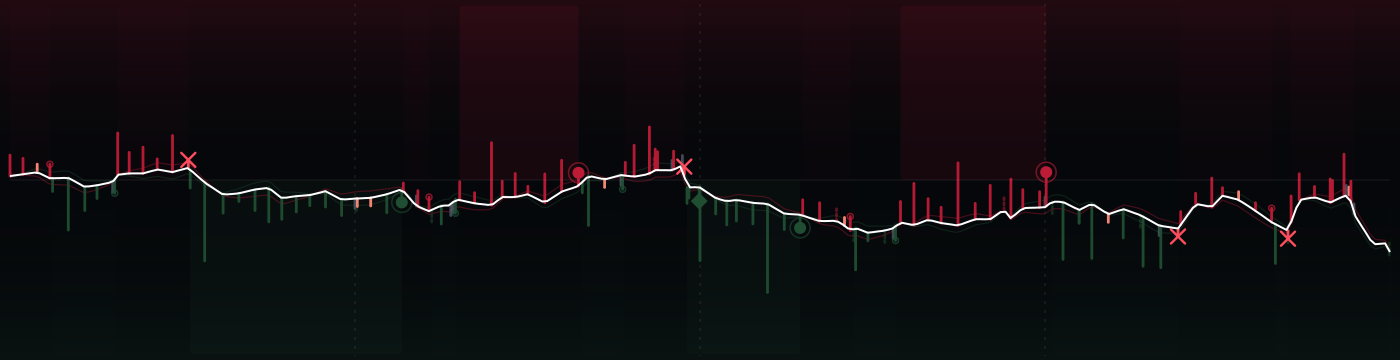
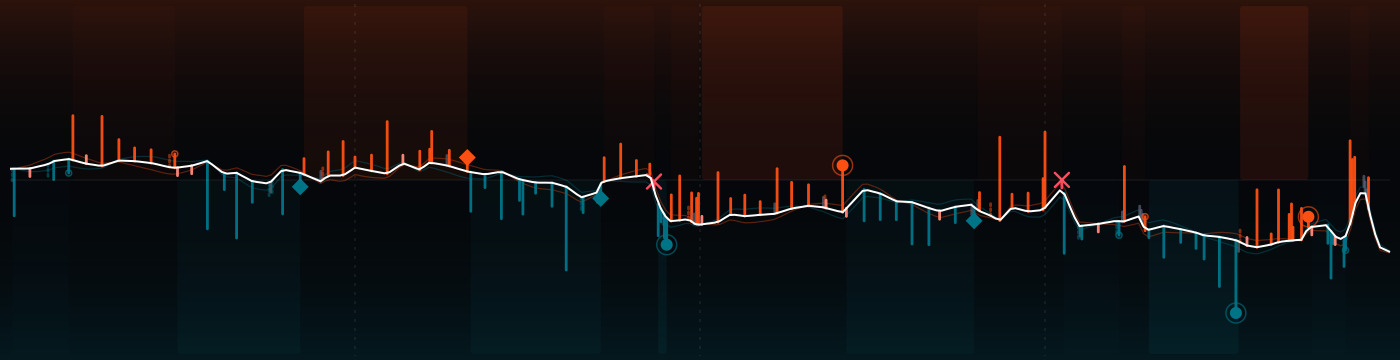
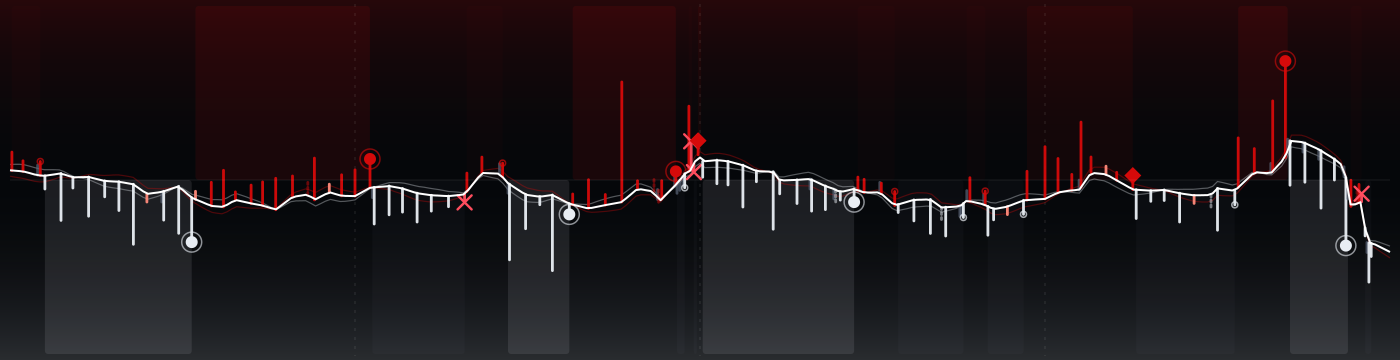
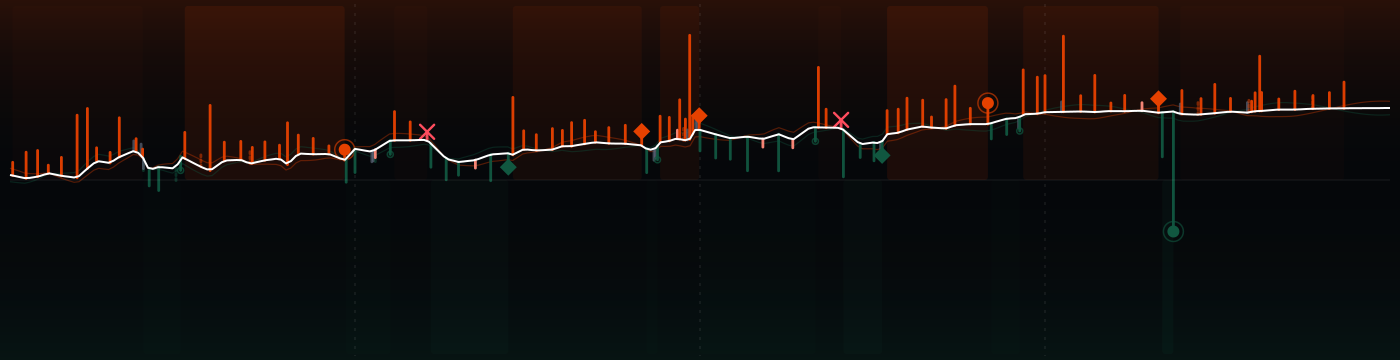
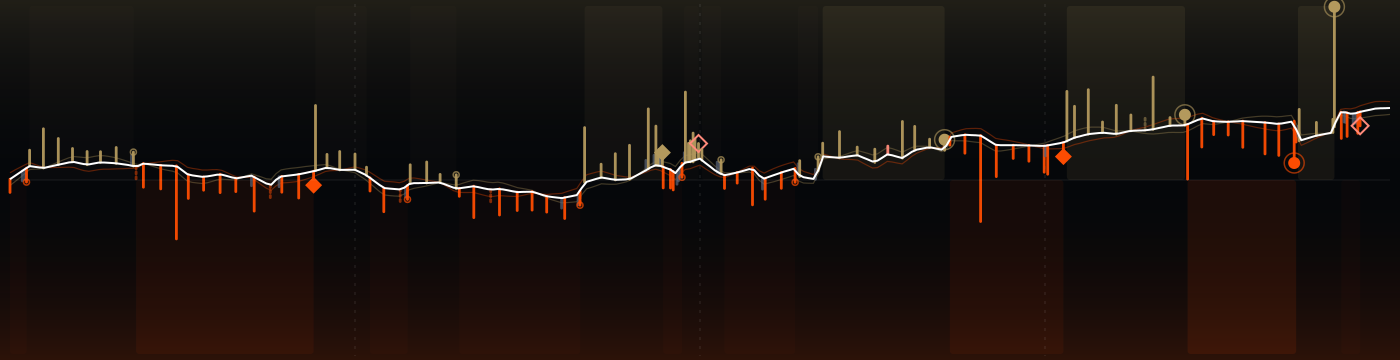
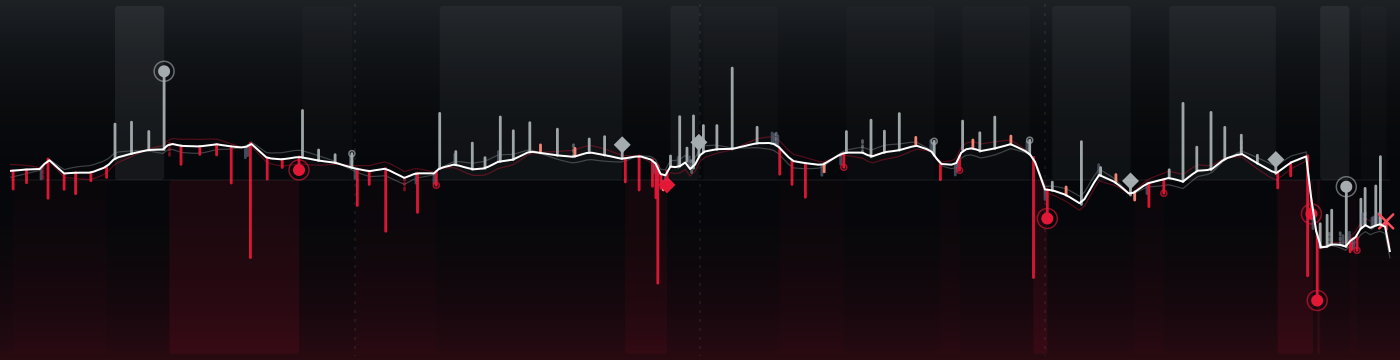
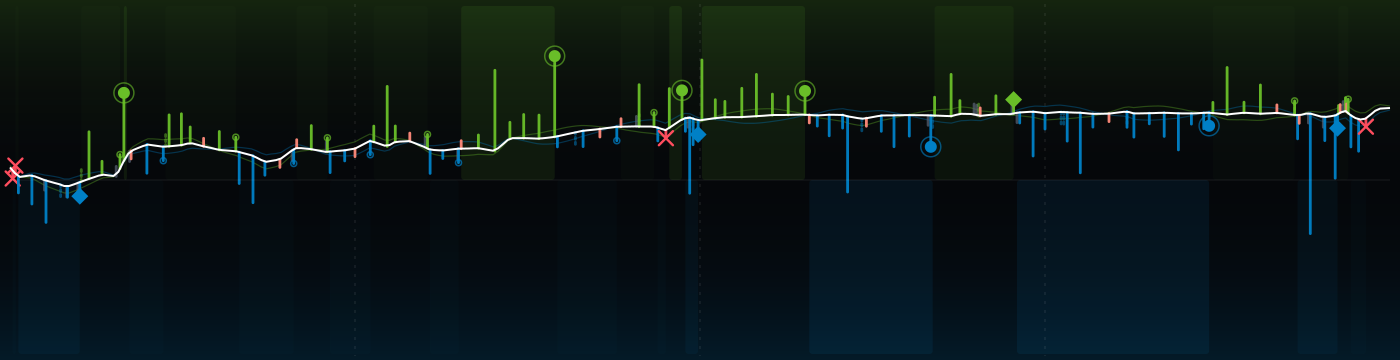
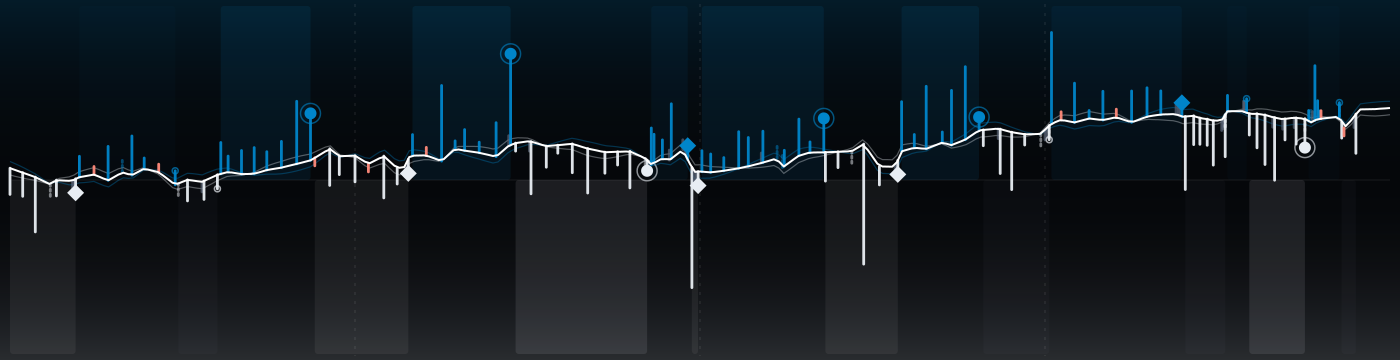
136 plays, one strand. Vikings won without the lead ever changing hands; Dolphins peaked at 50% to win, Vikings at 99%. The white spine is the win probability, every rung a snap: up for MIN, down for MIA, as long as the yards it gained.
↳Bottom lineThe lead never changed hands; Dolphins peaked at 50% to win, Vikings at 99%.
?How to read this chart
- Read it left to right:
- kickoff on the left, final whistle on the right.
- The white line
- is the chance that Vikings win, play by play. High = MIN in control, low = MIA in control, the middle is a coin flip. Each crossing of the middle is a change in who was more likely to win.
- Each little bar is one play:
- up for MIN on offense, down for MIA; the longer the bar, the more yards. The key under the picture explains the marks (touchdown, turnover, field goal, punt).
 Vikings ↑
 Dolphins ↓
The strands compared
?How to read this chart
- Each row compares the two teams
- on one stat: MIA on the left, MIN on the right. The longer bar is the bigger number.
- Explosive plays
- are long gains (big runs and passes). Peak win prob. is the highest chance to win each team reached at any moment.
Every possession
?How to read this chart
- Each tile is one possession,
- in game order, colored by the team that had the ball.
- Inside:
- the team, how it ended (TD = touchdown, FG = field goal, INT = interception, FUM = fumble, otherwise punt or downs) and the yards gained. Brighter tiles are drives that scored.
The plays that moved it most
↳Bottom lineThe biggest swing: play 1, 2.2 expected points against Dolphins.
?How to read this chart
- The strip is the game clock;
- each numbered dot is one of the plays below, placed when it happened and colored by the team on offense.
- EP (expected points)
- is how many points the play added to (+) or took away from (−) the offense's expected score. +3.5 EP is worth more than a field goal; big minus numbers are usually turnovers.
- 1Q1 11:04 · MIA · Punt−2.2 EP
48-B.Pinion punts 48 yards to MIN 26, Center-46-T.Addington. 4-M.Price ran ob at MIA 38 for 36 yards (84-R.Miller).
- 2Q1 3:27 · MIA · Sack−2.6 EP
2-M.Willis sacked at MIA 44 for -8 yards (15-D.Turner).
- 3Q2 14:56 · MIN · Sack−2.1 EP
1-K.Murray sacked at MIN 22 for -8 yards (9-J.Uche).
- 4Q2 5:50 · MIA · Fumble lost−4.7 EP
2-M.Willis pass incomplete short left to 5-J.Wright. Minnesota challenged the incomplete pass ruling, and the play was REVERSED. 2-M.Willis
- 5Q3 14:08 · MIA · Run+4.7 EP
0-O.Gordon left tackle pushed ob at MIN 11 for 53 yards (7-B.Murphy; 22-H.Smith).
- 6Q3 4:57 · MIA · Run−2.2 EP
5-J.Wright left guard to MIA 38 for -3 yards (17-K.Van Noy).
- 7Q3 2:43 · MIN · Sack−3.5 EP
1-K.Murray sacked at MIN 24 for -11 yards (44-C.Robinson).
- 8Q4 2:07 · MIN · Completion+2.5 EP
1-K.Murray pass short left to 87-T.Hockenson to MIA 2 for 8 yards (16-M.Taaffe).
The one play that could have changed it
?How to read this chart
- The line is win probability
- over the game (top = home team ahead). The dot marks the one play that could have gone either way; the big % is the losing team's chance right after it.
- Press Flip it
- to see where that chance would have gone if the play had gone the other way. Only that instant is priced: the rest of the game never happened.
If the Dolphins had stopped that fourth-and-1
Q4 10:08 33-A.Jones up the middle to MIA 27 for 3 yards (9-J.Uche; 20-J.Brooks).
 24@27
 24@36

 34@30
 22@17


 29@26


 14@24

 23@30

 26@32