InjuryJosh Jacobs: Questionable → Out29 min ago
 Vikings DeskVikings pass more on early downs each week, and the offense keeps sliding30 min ago
 Chiefs DeskChiefs fix their early-down mix and the offense follows in Week 930 min ago
 Atlanta FalconsFalcons 'feel good' about Corey Levin stepping in as starting center
 Baltimore RavensKyle Hamilton Practicing, Jaylinn Hawkins Returns
 New York JetsJets Stock Report | Dylan Parham, Breece Hall Boost Already Strong Run Game
 ESPNMike Tomlin: 'Excited' about broadcast role, hasn't considered coaching return
 Tampa Bay Buccaneers2026 Rookie Class Bye Week Check-In
 Dallas CowboysCowboys sign RB Kendre Miller to practice squad
 Titans DeskTitans offense ranks 27th in EPA per play and the defense gives it back1 h ago
 Los Angeles ChargersLos Angeles Chargers Name Stalwart Law Group Official Law Firm in Multiyear Partnership
 Carolina PanthersPanthers in the power rankings before Week 10 against the New Orleans Saints
 Pro Football RumorsColts Turned Down Pair Of Day 3 Picks For DT Grover Stewart
 Seahawks DeskSeahawks defense ranks fifth in EPA allowed while the offense sits 23rd1 h ago
 Jaguars DeskJaguars defense covers for an offense that slipped to 0.05 EPA a play1 h ago
Week 4 · 2026Cardinals 24 · 36 Giants
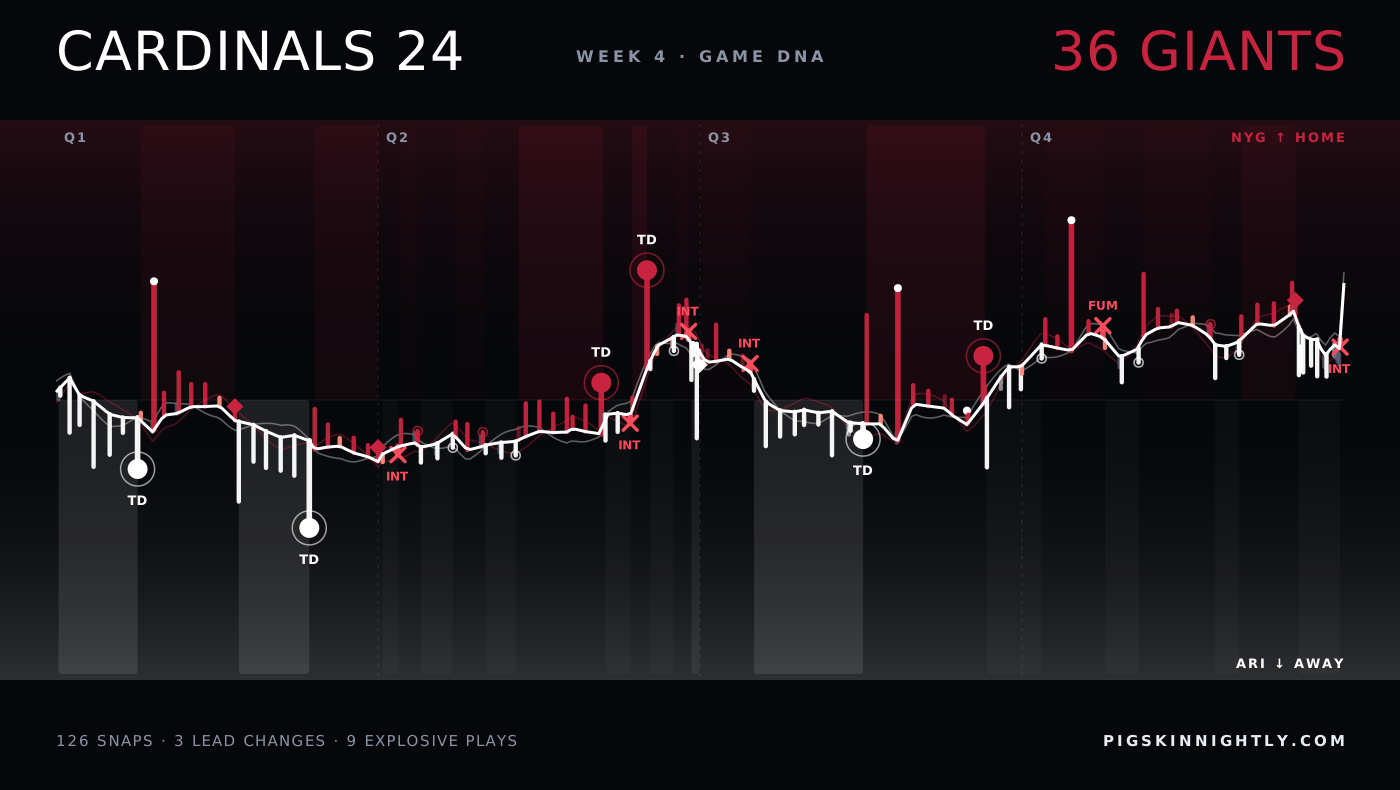
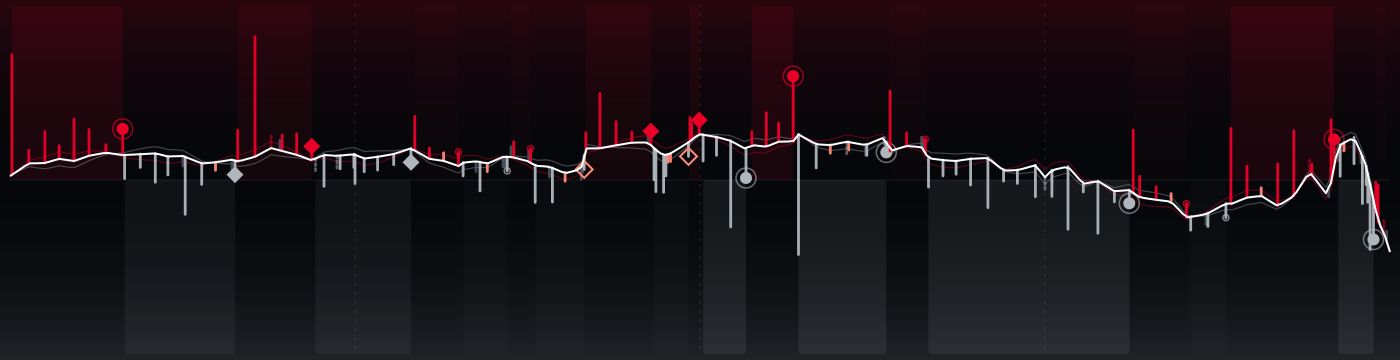
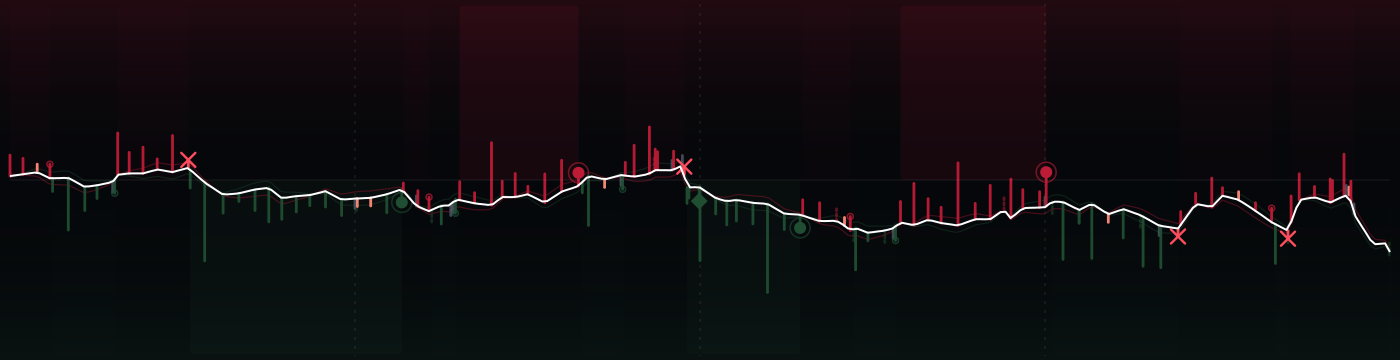
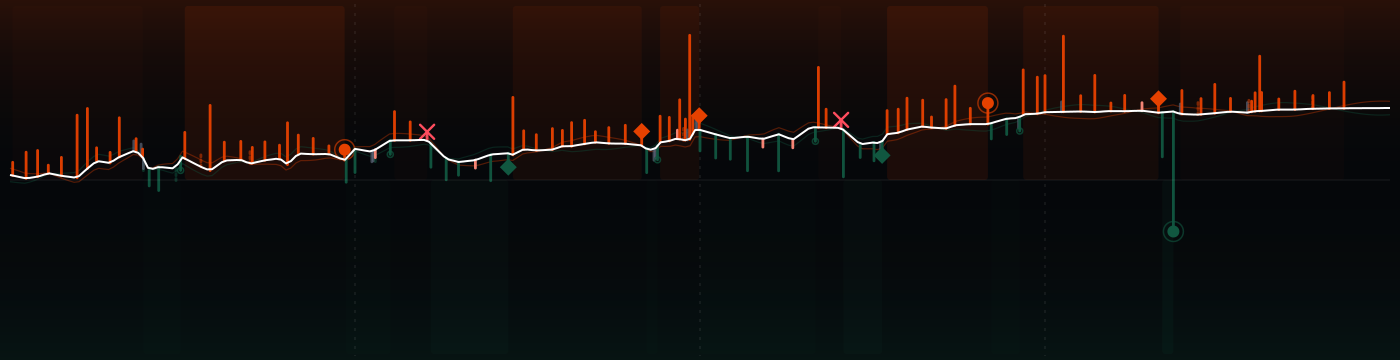
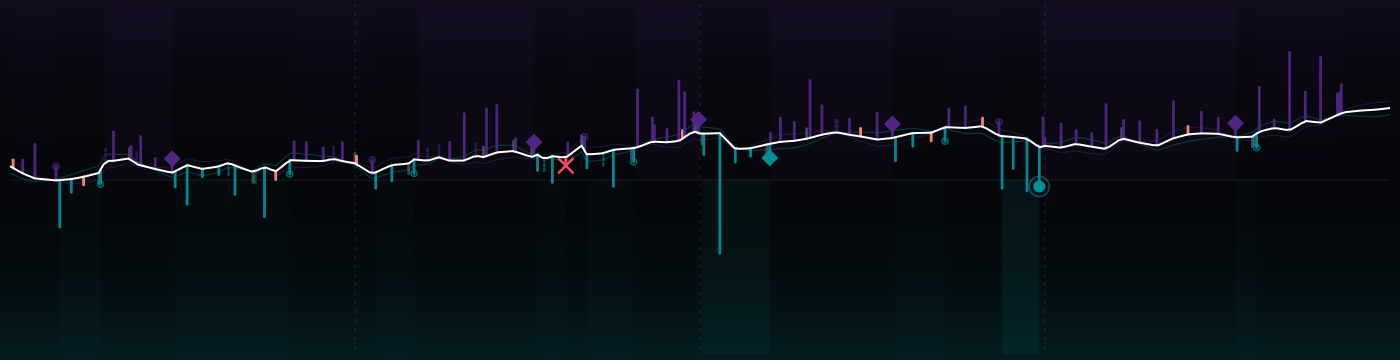
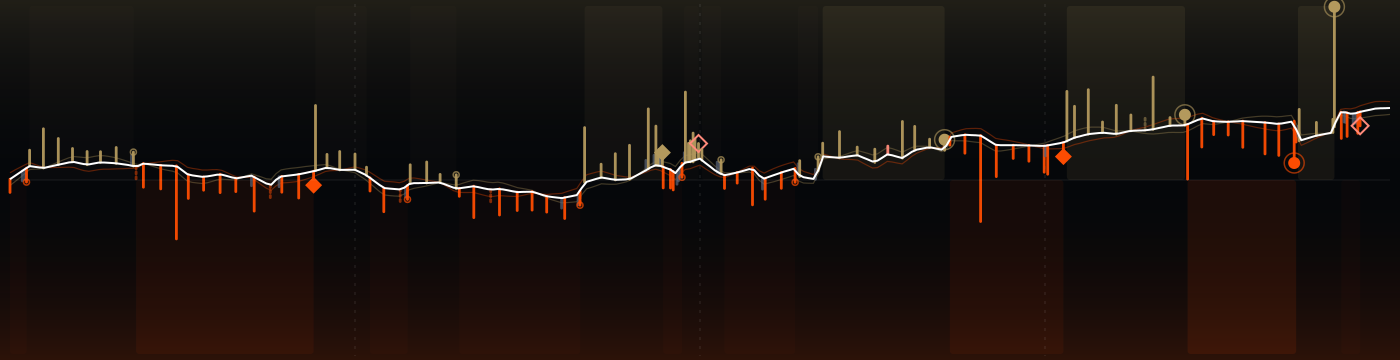
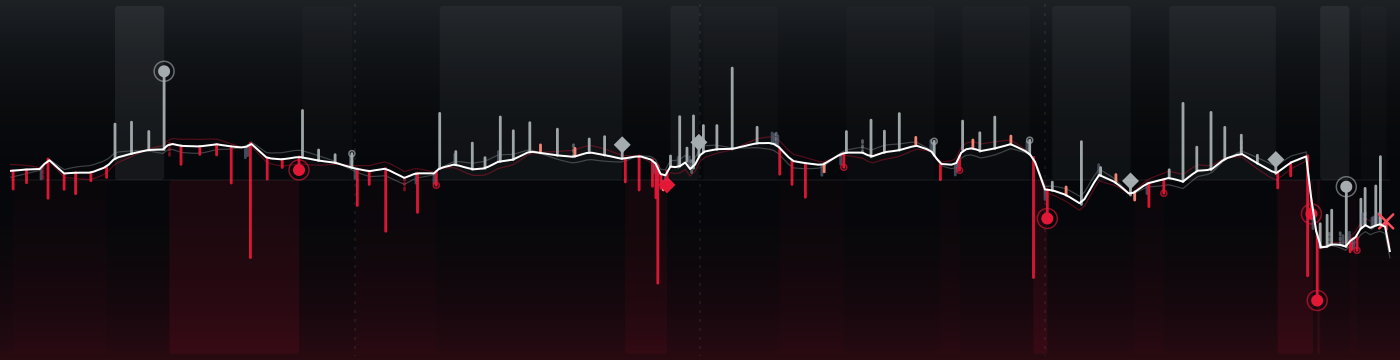
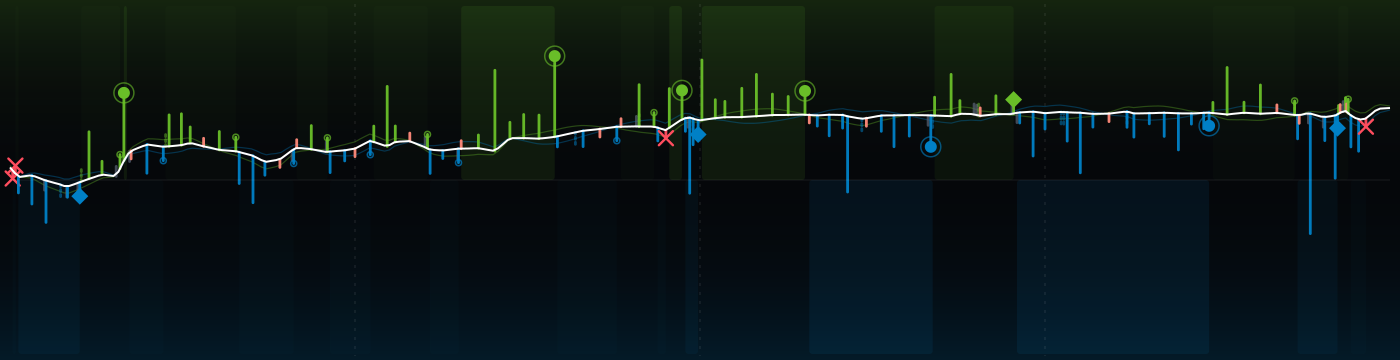
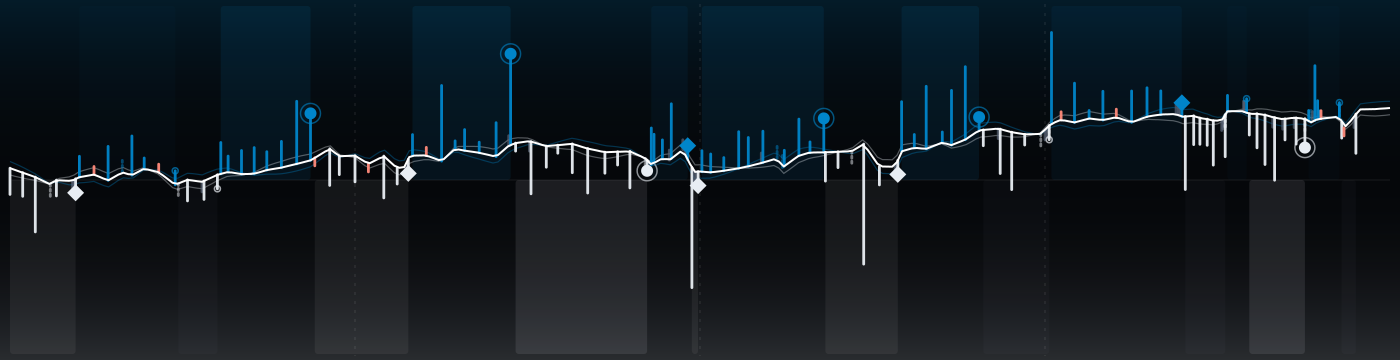
151 plays, one strand. Giants won after 3 lead changes; Cardinals peaked at 76% to win, Giants at 88%. The white spine is the win probability, every rung a snap: up for NYG, down for ARI, as long as the yards it gained.
↳Bottom line3 lead changes; Cardinals peaked at 76% to win, Giants at 88%.
?How to read this chart
- Read it left to right:
- kickoff on the left, final whistle on the right.
- The white line
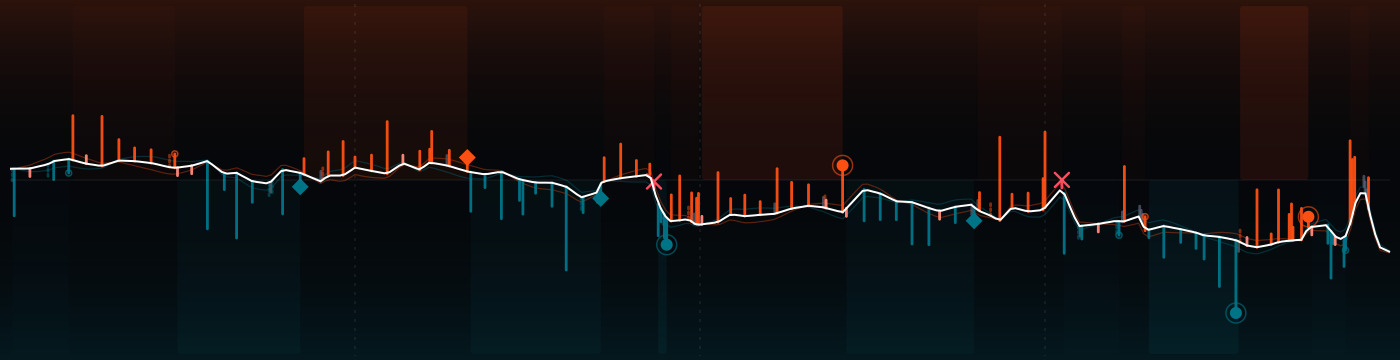
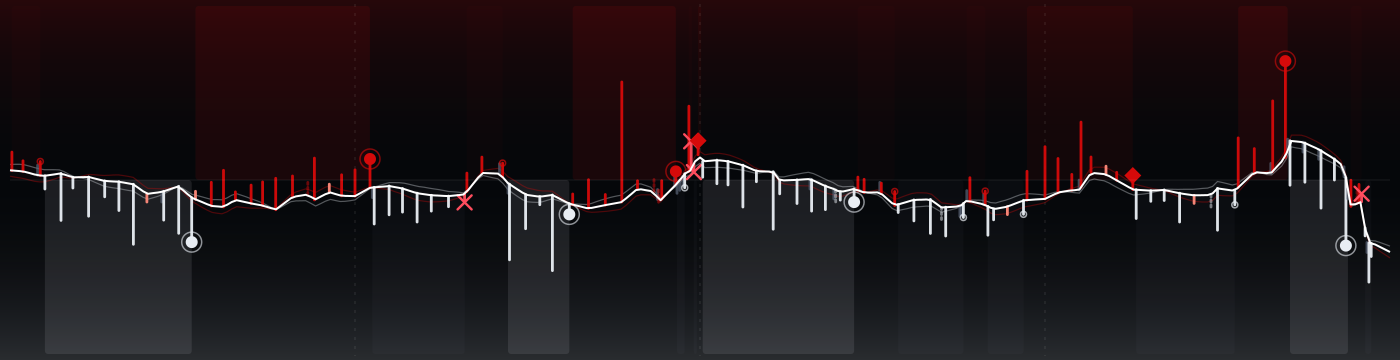
- is the chance that Giants win, play by play. High = NYG in control, low = ARI in control, the middle is a coin flip. Each crossing of the middle is a change in who was more likely to win.
- Each little bar is one play:
- up for NYG on offense, down for ARI; the longer the bar, the more yards. The key under the picture explains the marks (touchdown, turnover, field goal, punt).
 Giants ↑
 Cardinals ↓
The strands compared
?How to read this chart
- Each row compares the two teams
- on one stat: ARI on the left, NYG on the right. The longer bar is the bigger number.
- Explosive plays
- are long gains (big runs and passes). Peak win prob. is the highest chance to win each team reached at any moment.
Every possession
?How to read this chart
- Each tile is one possession,
- in game order, colored by the team that had the ball.
- Inside:
- the team, how it ended (TD = touchdown, FG = field goal, INT = interception, FUM = fumble, otherwise punt or downs) and the yards gained. Brighter tiles are drives that scored.
The plays that moved it most
↳Bottom lineThe biggest swing: play 1, 4.4 expected points for Giants.
?How to read this chart
- The strip is the game clock;
- each numbered dot is one of the plays below, placed when it happened and colored by the team on offense.
- EP (expected points)
- is how many points the play added to (+) or took away from (−) the offense's expected score. +3.5 EP is worth more than a field goal; big minus numbers are usually turnovers.
- 1Q1 10:26 · NYG · Completion+4.4 EP
19-J.Winston pass deep right to 1-M.Nabers to ARI 40 for 39 yards (28-A.Wingard). NYG-1-M.Nabers was injured during the play.
- 2Q2 4:36 · NYG · Touchdown+2.8 EP
19-J.Winston pass short right to 88-M.Fields for 12 yards, TOUCHDOWN.
- 3Q2 3:15 · ARI · Interception−4.7 EP
7-J.Brissett pass short left intended for 14-Mi.Wilson INTERCEPTED by 52-A.Reese (93-S.Harris) at ARI 34. 52-A.Reese to ARI 26 for 8 yards (
- 4Q2 2:28 · NYG · Touchdown+3.6 EP
19-J.Winston pass deep middle to 1-M.Nabers for 25 yards, TOUCHDOWN [55-D.Stills].
- 5Q3 5:47 · NYG · Completion+4.3 EP
19-J.Winston pass deep left to 88-M.Fields pushed ob at ARI 18 for 40 yards (31-W.Williams).
- 6Q4 12:42 · NYG · Completion+3.1 EP
19-J.Winston pass deep right to 9-I.Likely to ARI 44 for 34 yards (3-B.Baker; 31-W.Williams).
- 7Q4 11:14 · NYG · Fumble lost−4.5 EP
23-N.Harris left guard to ARI 41 for 2 yards (1-Ma.Wilson; 55-D.Stills). FUMBLES (1-Ma.Wilson), RECOVERED by ARI-25-Z.Collins at ARI 42.
- 8Q4 0:11 · ARI · Interception−9.6 EP
7-J.Brissett pass short left intended for 14-Mi.Wilson INTERCEPTED by 2-D.Banks at NYG 2. 2-D.Banks for 98 yards, TOUCHDOWN.
The one play that could have changed it
?How to read this chart
- The line is win probability
- over the game (top = home team ahead). The dot marks the one play that could have gone either way; the big % is the losing team's chance right after it.
- Press Flip it
- to see where that chance would have gone if the play had gone the other way. Only that instant is priced: the rest of the game never happened.
If the 39-yard kick had missed
Q1 6:40 34-D.Zvada 39 yard field goal is GOOD, Center-58-B.Mann, Holder-15-J.Stout.





 24@20

 29@26



 10@15
 14@24


 26@32