Green Bay PackersMike's Mid-Week Chat | Nov. 11, 2026
 InjuryLuke Goedeke: Active → Cleared5 min ago
 Houston TexansH-Town History Is About to Light Up the Sky
 Cincinnati BengalsBengals Week 10 NFL Power Rankings Roundup
 Atlanta FalconsFalcons release kicker Nick Folk, sign Jake Moody
 Jacksonville JaguarsScout's Take: Bucky Brooks Examines Jaguars' Week 10 vs. Titans, Takeaways from 33-10 Win Over Ravens
 Minnesota VikingsDeeJay Dallas Salutes Sibling & Family History of Service
 Dallas CowboysCowboys quiet at trade deadline after active year of trades
 New York GiantsInside the Numbers: Thursday Night Football Edition
 San Francisco 49ersMorning Report: Dugger and Rookies Stepping Up, Latest Rankings 🗞️
 Arizona CardinalsHow To Watch: Cardinals vs. Rams, Week 10
 Patriots DeskPatriots threw on 73% of early downs in Week 9 and the offense stalled50 min ago
 Bills DeskJosh Allen's passing efficiency has cooled while his legs still pay off50 min ago
 Indianapolis ColtsColts to celebrate military heroes during 2026 'Salute To Service' game
 InjuryPuka Nacua: Questionable → Doubtful55 min ago
 InjuryDeshaun Watson: Active → Out55 min ago
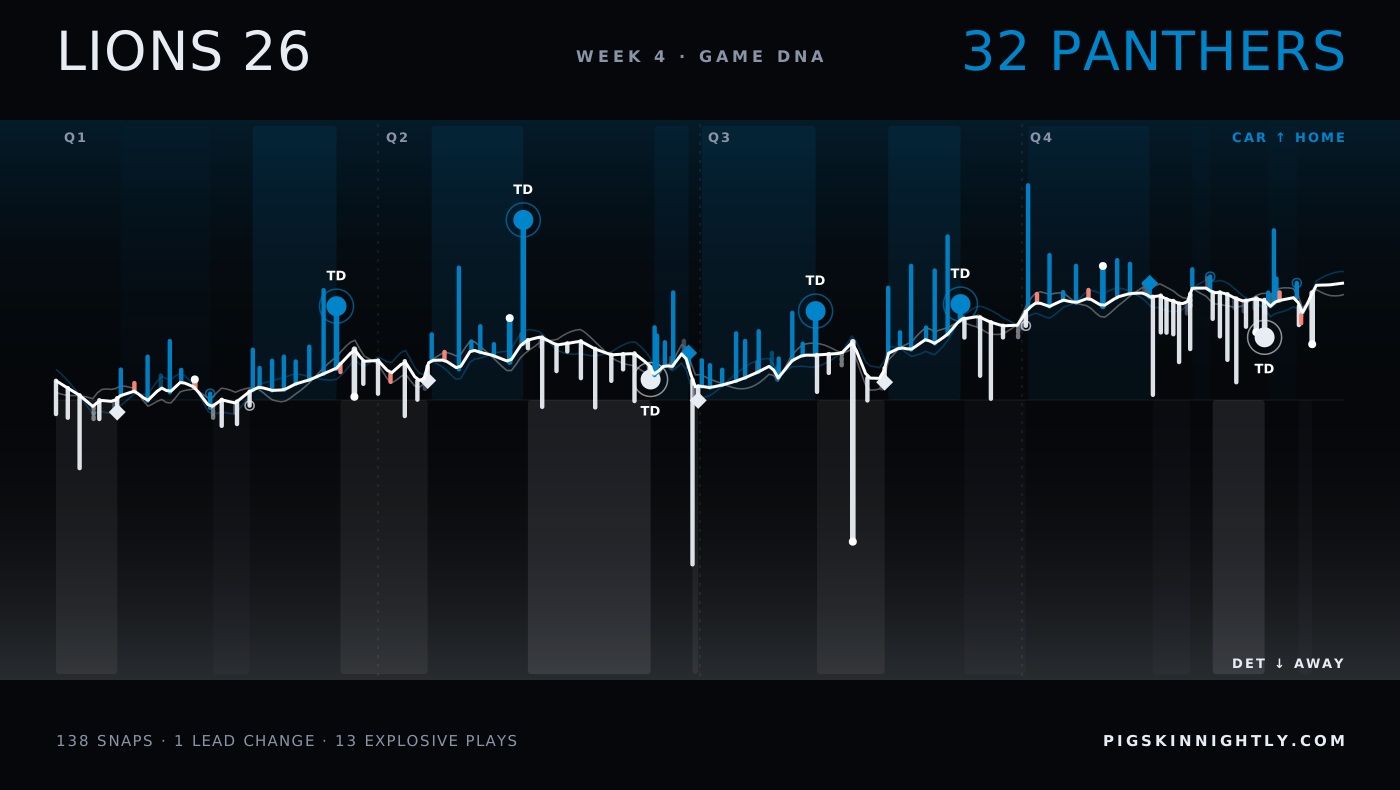
Week 4 · 2026Lions 26 · 32 Panthers
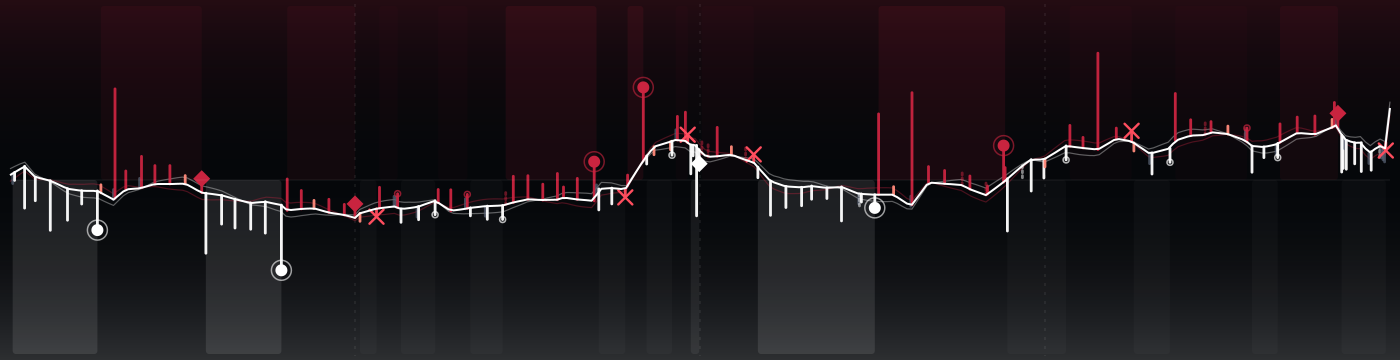
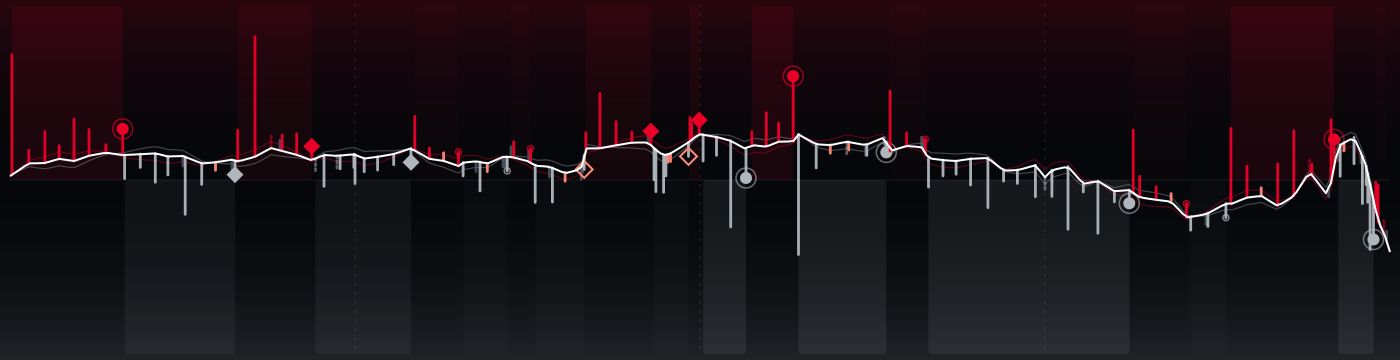
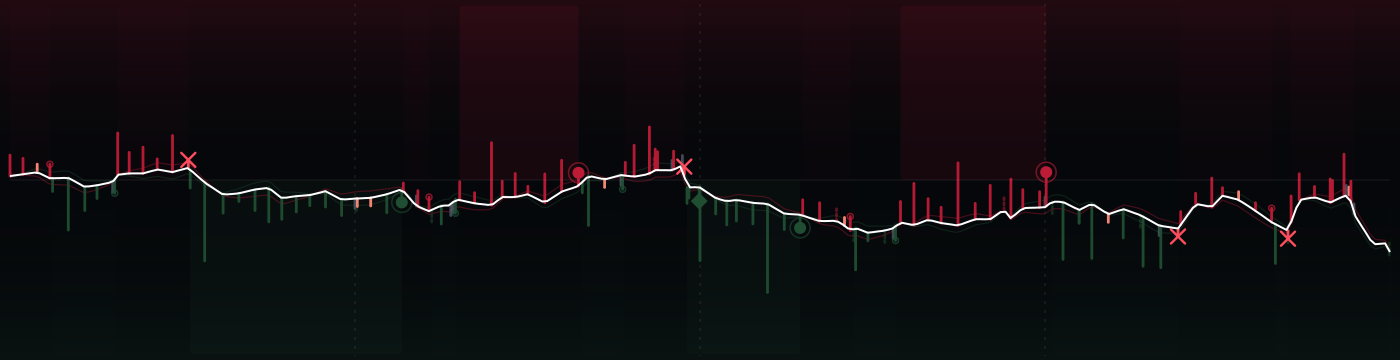
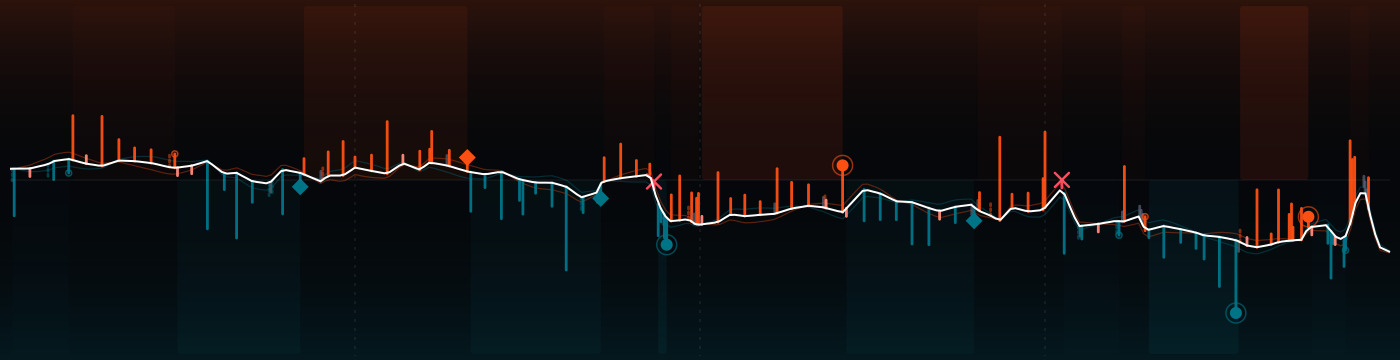
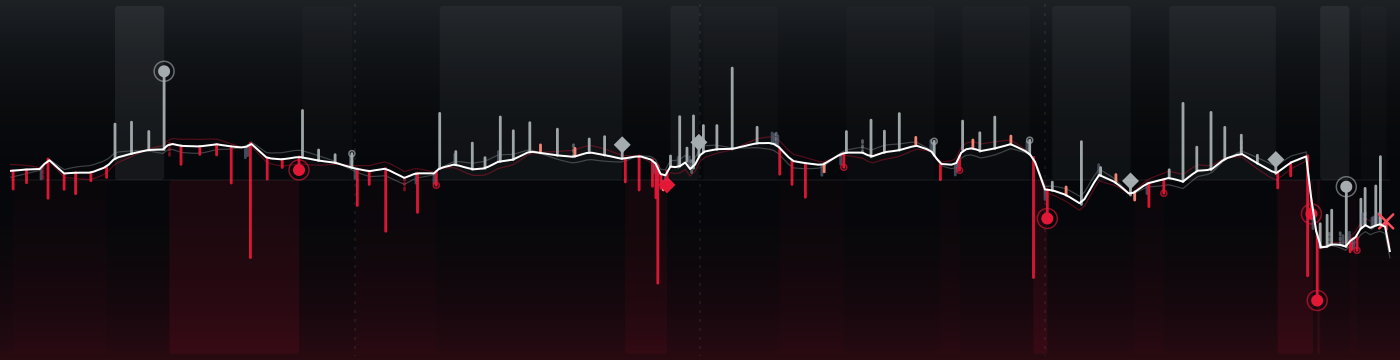
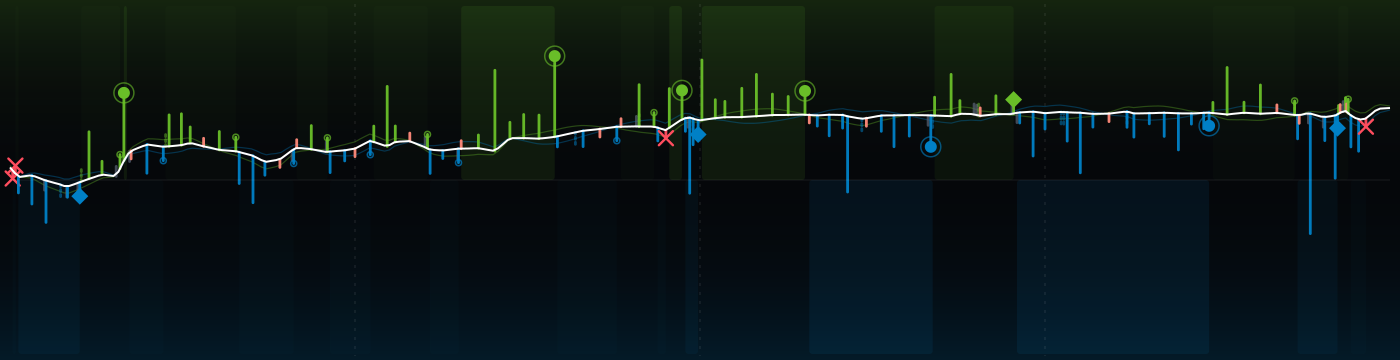
163 plays, one strand. Panthers won after 1 lead change; Lions peaked at 53% to win, Panthers at 99%. The white spine is the win probability, every rung a snap: up for CAR, down for DET, as long as the yards it gained.
↳Bottom line1 lead change; Lions peaked at 53% to win, Panthers at 99%.
?How to read this chart
- Read it left to right:
- kickoff on the left, final whistle on the right.
- The white line
- is the chance that Panthers win, play by play. High = CAR in control, low = DET in control, the middle is a coin flip. Each crossing of the middle is a change in who was more likely to win.
- Each little bar is one play:
- up for CAR on offense, down for DET; the longer the bar, the more yards. The key under the picture explains the marks (touchdown, turnover, field goal, punt).
 Panthers ↑
 Lions ↓
The strands compared
?How to read this chart
- Each row compares the two teams
- on one stat: DET on the left, CAR on the right. The longer bar is the bigger number.
- Explosive plays
- are long gains (big runs and passes). Peak win prob. is the highest chance to win each team reached at any moment.
Every possession
?How to read this chart
- Each tile is one possession,
- in game order, colored by the team that had the ball.
- Inside:
- the team, how it ended (TD = touchdown, FG = field goal, INT = interception, FUM = fumble, otherwise punt or downs) and the yards gained. Brighter tiles are drives that scored.
The plays that moved it most
↳Bottom lineThe biggest swing: play 1, 2.9 expected points against Panthers.
?How to read this chart
- The strip is the game clock;
- each numbered dot is one of the plays below, placed when it happened and colored by the team on offense.
- EP (expected points)
- is how many points the play added to (+) or took away from (−) the offense's expected score. +3.5 EP is worth more than a field goal; big minus numbers are usually turnovers.
- 1Q1 8:32 · CAR · Sack−2.9 EP
9-B.Young sacked at CAR 45 for -10 yards (54-A.McNeill).
- 2Q1 1:06 · DET · Completion+2.6 EP
16-J.Goff pass short right to 87-S.LaPorta to DET 36 for 11 yards (55-D.Lloyd). PENALTY on CAR-52-T.Gipson, Roughing the Passer, 15 yards, e
- 3Q2 8:52 · CAR · Completion+3.0 EP
9-B.Young pass short middle to 13-J.Metchie to DET 32 for 10 yards (36-C.Clark).
- 4Q2 8:14 · CAR · Touchdown+3.8 EP
9-B.Young pass deep right to 4-T.McMillan for 32 yards, TOUCHDOWN [98-D.Wonnum].
- 5Q3 7:53 · DET · Completion+4.0 EP
16-J.Goff pass deep left to 18-I.TeSlaa to CAR 12 for 57 yards (29-A.Evans).
- 6Q4 11:14 · CAR · Completion+3.3 EP
9-B.Young pass short right to 88-D.Waller to DET 28 for 9 yards (27-J.Mills).
- 7Q4 4:05 · DET · Completion+3.1 EP
16-J.Goff pass short right to 87-S.LaPorta to CAR 3 for 7 yards (55-D.Lloyd; 20-Z.Wheatley).
- 8Q4 1:29 · DET · Completion−2.5 EP
16-J.Goff pass short middle to 18-I.TeSlaa to DET 22 for 12 yards (22-L.Ransom; 24-W.Lee).
The one play that could have changed it
?How to read this chart
- The line is win probability
- over the game (top = home team ahead). The dot marks the one play that could have gone either way; the big % is the losing team's chance right after it.
- Press Flip it
- to see where that chance would have gone if the play had gone the other way. Only that instant is priced: the rest of the game never happened.
26@32Week 4Changes the winnerIf the Lions had stopped that fourth-and-4
Q2 8:52 9-B.Young pass short middle to 13-J.Metchie to DET 32 for 10 yards (36-C.Clark).
 24@27



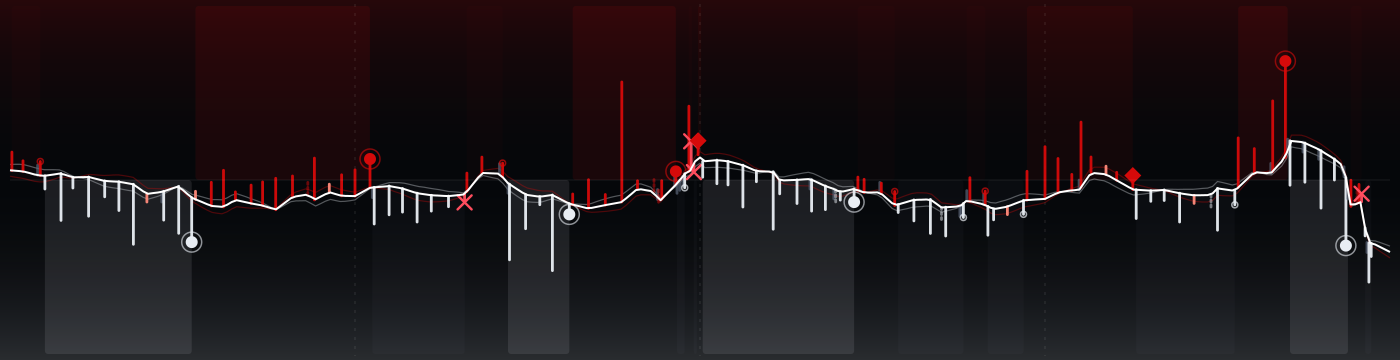
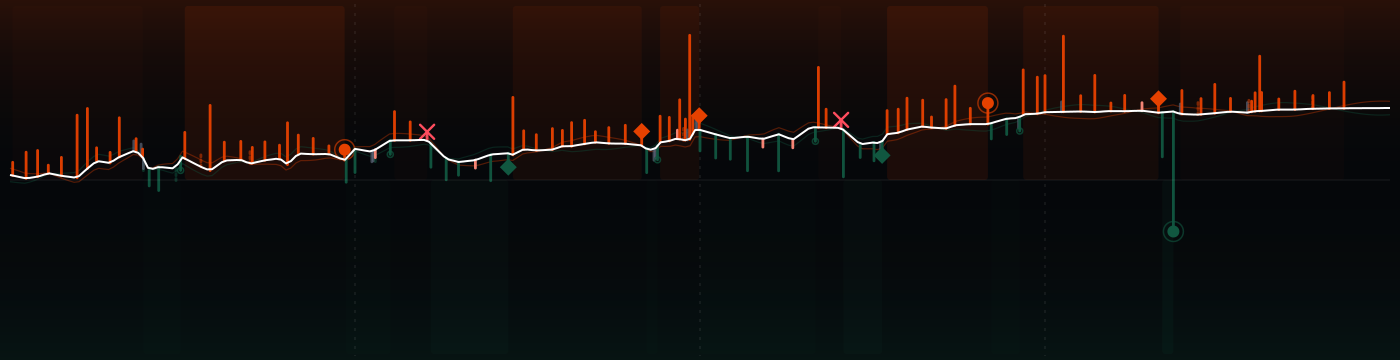
 12@23


 18@24

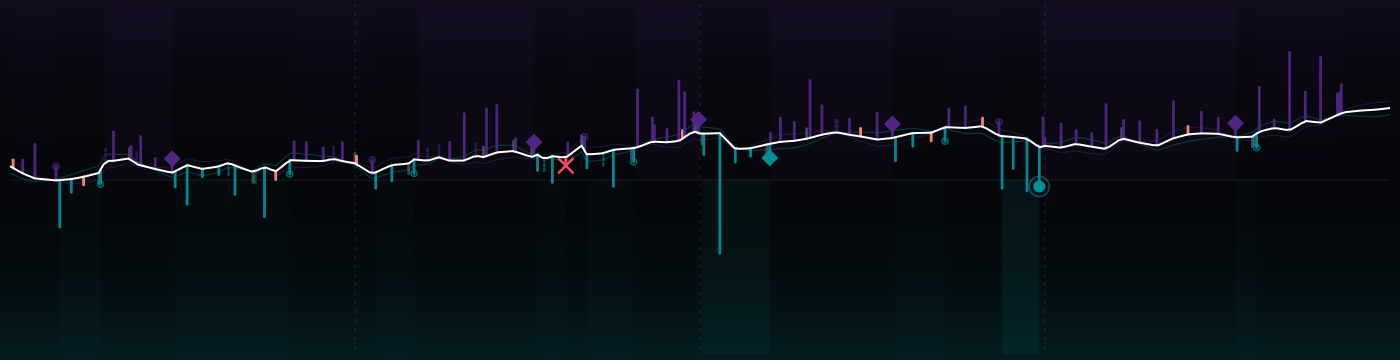
 10@15
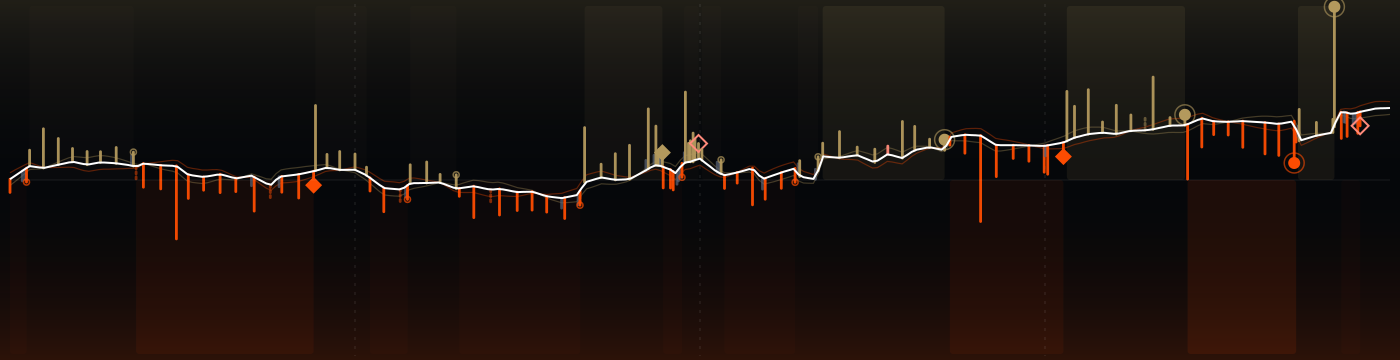
 14@24
 30@27

 23@30