 Pittsburgh SteelersAsked and Answered: Nov. 10
 New York GiantsGiants Now: Michael Strahan offers high praise of Arvell Reese
 Philadelphia EaglesAAA Official Review: What did the Eagles, Joe Milton learn from the QB's first start?
 Buffalo Bills'There's no panic' | The Bills stay strong through early struggles and injuries in MNF win over the Minnesota Vikings
 ESPNVikings left at QB crossroads after Carson Wentz's poor MNF showing vs. Bills
 Broncos DeskBroncos are 7-2, but the snaps say 4.1 wins and the 11th seed in the conference5 h ago
 InjuryCarl Granderson: Active → Cleared7 h ago
 ESPNCarson Beck next man up for Cardinals
The LabEvery contract against the field
 Seattle SeahawksThe cap file
66 contracts count $300M against the 2026 cap. 88% of it belongs to players on the field, 2nd of 32. $9.2M is injured and $27.3M is healthy but not playing. The biggest building: defensive line, $79.7M, 5th in the league.
↳Bottom line88% of the Seahawks cap is on the field (2nd of 32). The most money goes to defensive line: $79.7M, 5th in the league.
?How to read this chart
- The skyline above:
- one building per position group, as tall as the cap hit (this season's salary-cap charge) Seahawks spend on it, on the same scale as every other team. Lit windows are the share of that money on players who are actually on the field; dark windows are injured or idle money.
- The cards below:
- the same money in numbers. The bar fills with the share on the field, and "in spend" ranks the team among all 32 for that group.
Quarterbacks$42.1M97% on the field · 6th in spend
Running backs$9.3M29% on the field · 20th in spend
Wide receivers$38.9M92% on the field · 4th in spend
Tight ends$7.4M17% on the field · 29th in spend
Offensive line$47.4M93% on the field · 17th in spend
Defensive line$79.7M92% on the field · 5th in spend
Linebackers$17.5M86% on the field · 13th in spend
Secondary$44.8M85% on the field · 15th in spend
Specialists$12.4M100% on the field · 1st in spend
Best value on the roster
Earning more than they cost
↳Bottom lineBest value on the roster: Jalen Sundell, played 87th and paid 30th among OLs.
?How to read the contract tables
- One row = one contract.
- 2026 cap hit, average per year and years left.
- Paid / played bars:
- the gold bar is where his pay ranks among players at his position across the league, the green bar where his play ranks (EPA, expected points added, for QB, RB, WR, TE; share of snaps for everyone else). Full bar = top of the league.
- Gap:
- played rank minus paid rank, in percentile points. Positive (green) means he gives more than he costs; negative (red) means the opposite.
3 contracts
Quarterbacks $42.1M
Player2026 capPer yearPaid / playedGapEPA
 Sam DarnoldQB$37.9M$33.5M · 2 yrs left−41-10.6 EPA
 Drew LockQB$2.8M$2.5M · 1 yr left+35+32.0 EPA
 Jalen MilroeQB$1.4M$1.6M · 3 yrs left−44+0.0 EPA
5 contracts
Running backs $9.3M
8 contracts
Wide receivers $38.9M
Player2026 capPer yearPaid / playedGapEPA
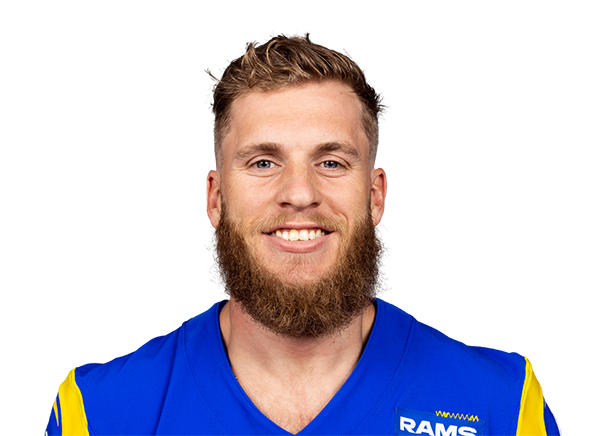 Cooper KuppWR$17.5M$15.0M · 2 yrs left−14+10.0 EPA
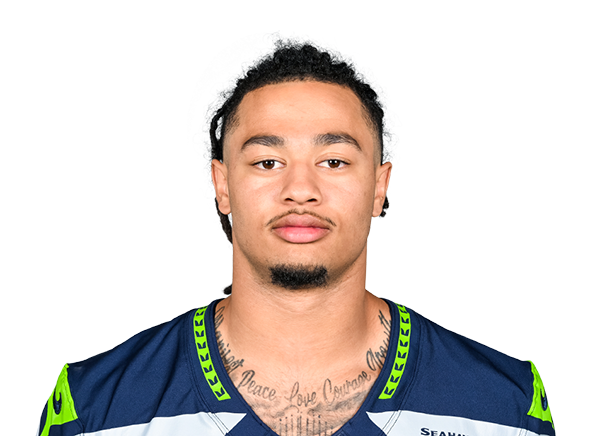 Jaxon Smith-NjigbaWR$10.4M$42.1M · 4 yrs left+8+65.4 EPA
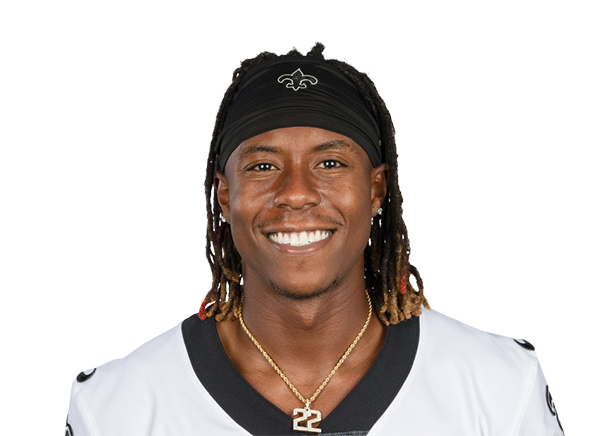 Rashid ShaheedWR$7.0M$17.0M · 3 yrs left−54-15.4 EPA
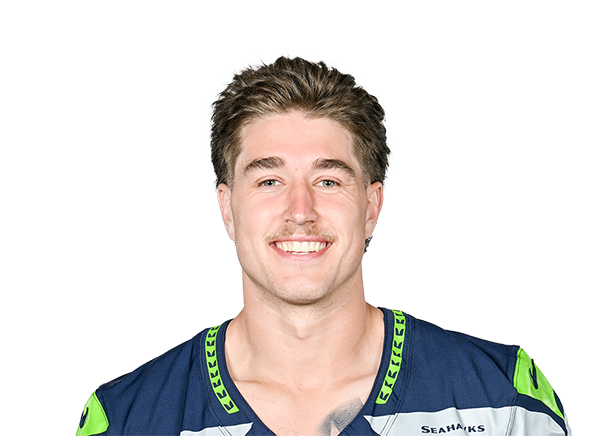 Jake BoboWR · injured$2.3M$2.8M · 2 yrs left−65+0.0 EPA
 Tory HortonWR$1.1M$1.1M · 3 yrs left+33+5.5 EPA
 Ricky White IIIWR$248K$248K · 1 yr left−7+0.0 EPA
 Emmanuel Henderson Jr.WR$248K$248K · 1 yr left−7+0.0 EPA
 Montorie Foster Jr.WR$151K$248K · 1 yr left0+0.0 EPA
6 contracts
Tight ends $7.4M
Player2026 capPer yearPaid / playedGapEPA
 Brady RussellTE$2.3M$2.4M · 2 yrs left+5+3.0 EPA
 Elijah ArroyoTE · injured$2.0M$2.2M · 3 yrs left−20-3.7 EPA
 AJ BarnerTE$1.3M$1.2M · 2 yrs left−12-11.8 EPA
 Nick KallerupTE$1.0M$997K · 2 yrs left−24+0.0 EPA
 Robbie OuztsTE · injured$620K$1.1M · 3 yrs left−20+0.0 EPA
 Ben SimsTE$202K$330K · 1 yr left−1+0.0 EPA
11 contracts
Offensive line $47.4M
Player2026 capPer yearPaid / playedGapSnaps
 Charles CrossLT$10.9M$26.1M · 4 yrs left−2176% snaps
 Abraham LucasRT$10.4M$15.3M · 2 yrs left−3100% snaps
 Quenton NelsonLG$9.8M$20.0M · final year−1589% snaps
 Grey ZabelLT$4.2M$4.6M · 3 yrs left+14100% snaps
 Josh JonesLT$4.0M$4.0M · 1 yr left−1725% snaps
 Anthony BradfordRG$3.9M$1.2M · 1 yr left−1431% snaps
 Beau StephensLG$1.2M$1.2M · 4 yrs left+1023% snaps
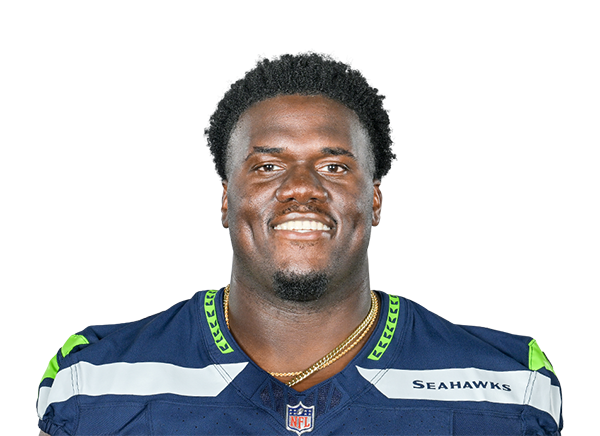 Olu OluwatimiC$1.2M$1.0M · 1 yr left−61% snaps
 Jalen SundellLT$1.1M$943K · 1 yr left+57100% snaps
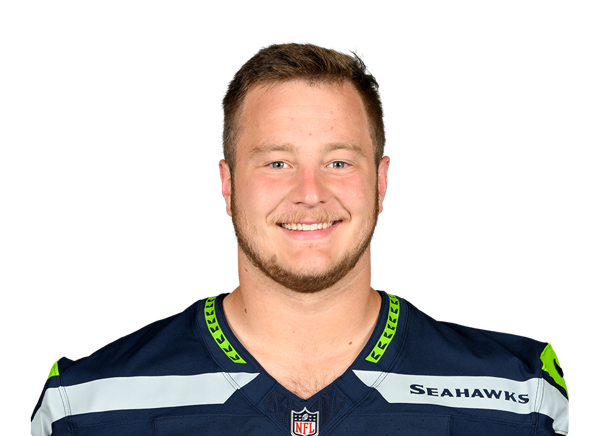 Mason RichmanLT · injured$571K$1.1M · 3 yrs left−180% snaps
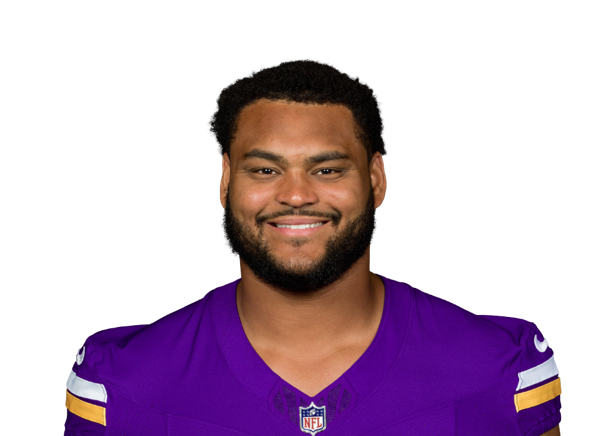 Logan BrownRT$248K$248K · 1 yr left−40% snaps
12 contracts
Defensive line $79.7M
Player2026 capPer yearPaid / playedGapSnaps
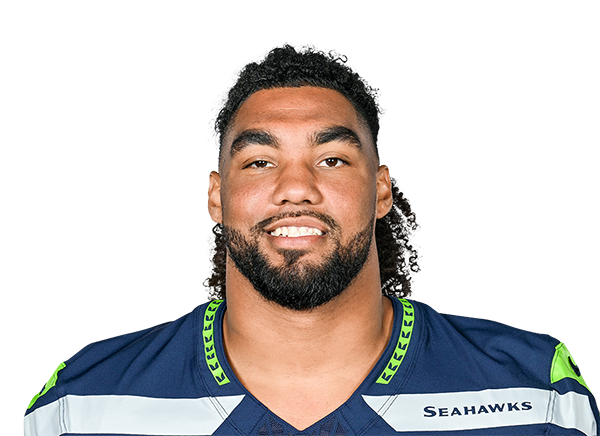 Leonard WilliamsIDL$22.0M$30.0M · 3 yrs left−1064% snaps
 Uchenna NwosuED$20.0M$9.8M · 1 yr left−3540% snaps
 DeMarcus LawrenceED$11.8M$10.8M · 2 yrs left−463% snaps
 Jarran ReedIDL$7.4M$7.3M · 2 yrs left−948% snaps
 Derick HallED$6.2M$14.0M · 3 yrs left−355% snaps
 Byron Murphy IIIDL$4.4M$4.0M · 2 yrs left+1970% snaps
 Dante Fowler Jr.ED$2.5M$2.5M · 1 yr left−1818% snaps
 Brandon PiliIDL$1.7M$1.8M · 1 yr left−243% snaps
 Mike MorrisED$1.2M$1.0M · 1 yr left−214% snaps
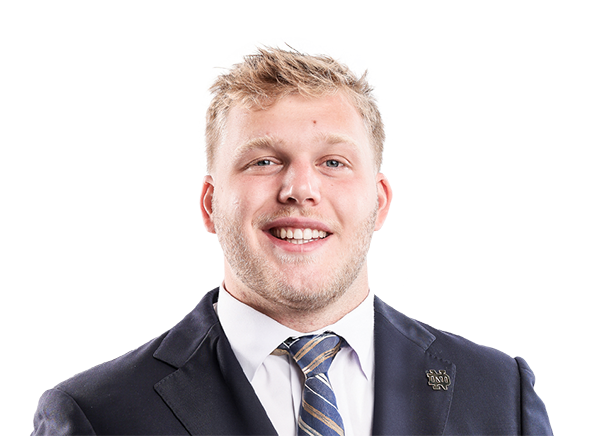 Rylie MillsIDL$1.1M$1.2M · 3 yrs left+1626% snaps
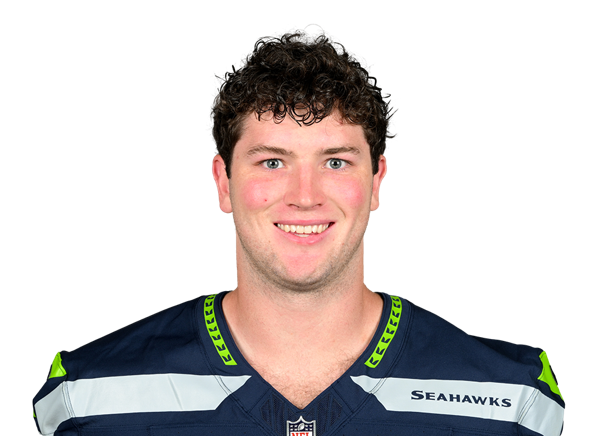 Connor O'TooleIDL$1.0M$998K · 2 yrs left+43% snaps
 Aidan HubbardED$248K$248K · 1 yr left−60% snaps
4 contracts
Linebackers $17.5M

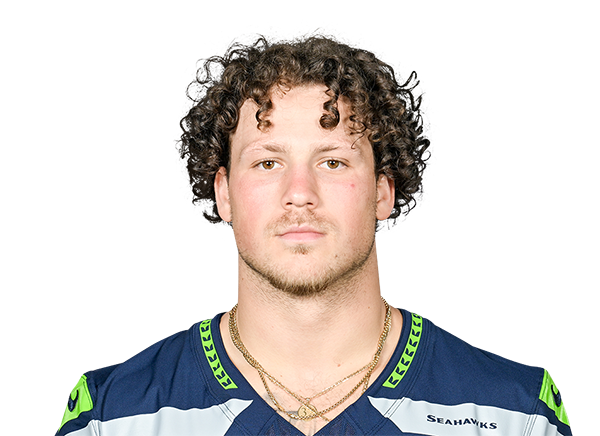
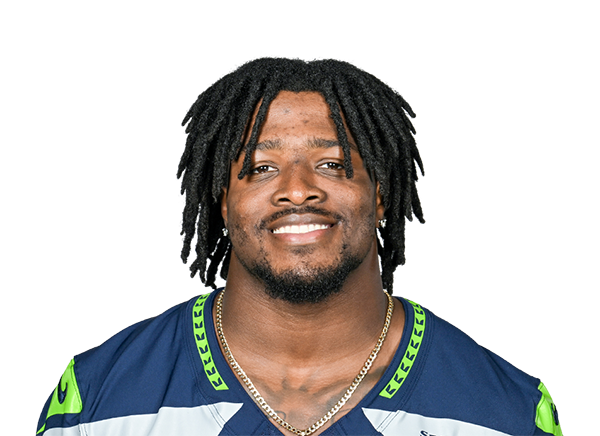
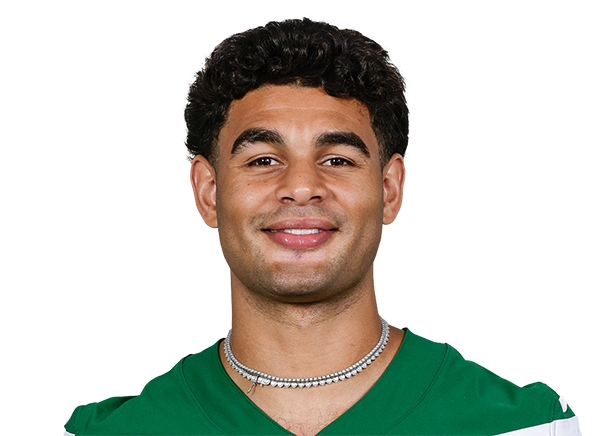
14 contracts
Secondary $44.8M
Player2026 capPer yearPaid / playedGapSnaps
 Devon WitherspoonCB$15.3M$33.0M · 4 yrs left−299% snaps
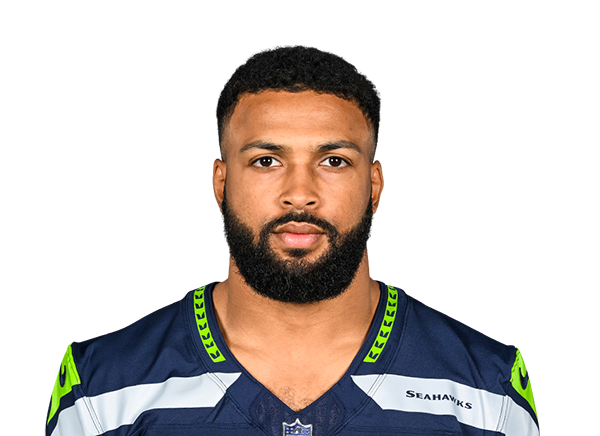 Julian LoveS$12.9M$11.0M · 1 yr left−1186% snaps
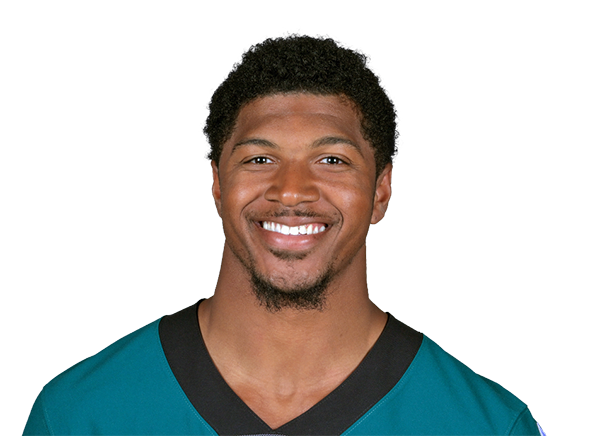 Josh JobeCB$4.8M$8.0M · 3 yrs left+1499% snaps
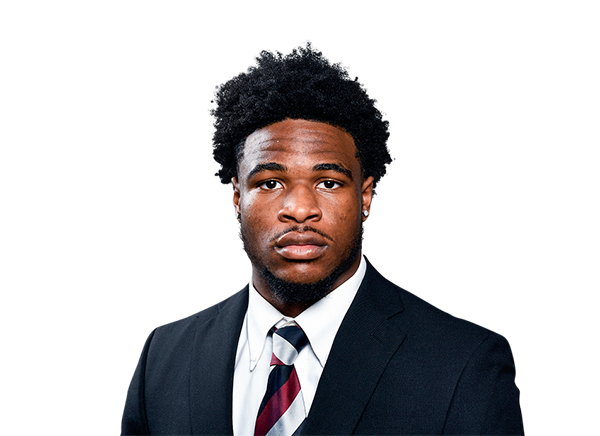 Nick EmmanworiS$2.6M$2.9M · 3 yrs left+769% snaps
 Bud ClarkS · injured$2.0M$2.0M · 4 yrs left−620% snaps
 Julian NealCB · injured$1.7M$1.7M · 4 yrs left−320% snaps
 Nehemiah PritchettCB$1.2M$1.1M · 2 yrs left+1835% snaps
 Ty OkadaCB$1.1M$1.1M · 1 yr left+3252% snaps
 Terrion ArnoldCB$1.1M$1.1M · 1 yr left−270% snaps
 Avery SmithCB$1.0M$1.0M · 3 yrs left−240% snaps
 AJ FinleyS$320K$411K · 1 yr left+2813% snaps
 Trevon DiggsCB$251K$411K · 1 yr left+245% snaps
 Michael DansbyCB$248K$248K · 1 yr left−50% snaps
 Andre FullerCB$248K$248K · 1 yr left−50% snaps
3 contracts
Specialists $12.4M
Player2026 capPer yearPaid / playedGapSnaps
 Jason MyersK$7.2M$5.3M · 1 yr left−1614% snaps
 Michael DicksonP$3.8M$4.0M · 3 yrs left−4413% snaps
 Chris StollLS$1.4M$1.5M · 2 yrs left−613% snaps
Gold bar: where the player's pay ranks among his position group league-wide. Green bar: where his play ranks (EPA for skill players, share of snaps for everyone else). Gap = played minus paid, in percentile points.