 Pittsburgh SteelersAsked and Answered: Nov. 10
 New York GiantsGiants Now: Michael Strahan offers high praise of Arvell Reese
 Philadelphia EaglesAAA Official Review: What did the Eagles, Joe Milton learn from the QB's first start?
 Buffalo Bills'There's no panic' | The Bills stay strong through early struggles and injuries in MNF win over the Minnesota Vikings
 ESPNVikings left at QB crossroads after Carson Wentz's poor MNF showing vs. Bills
 Broncos DeskBroncos are 7-2, but the snaps say 4.1 wins and the 11th seed in the conference5 h ago
 Pro Football RumorsSeahawks Interested In Adding WR Depth
 InjuryCarl Granderson: Active → Cleared7 h ago
 ESPNCarson Beck next man up for Cardinals
The LabEvery contract against the field
 Dallas CowboysThe cap file
66 contracts count $262M against the 2026 cap. 83% of it belongs to players on the field, 12th of 32. $6.2M is injured and $37.3M is healthy but not playing. The biggest building: wide receivers, $55.3M, 1st in the league.
↳Bottom line83% of the Cowboys cap is on the field (12th of 32). The most money goes to wide receivers: $55.3M, 1st in the league.
?How to read this chart
- The skyline above:
- one building per position group, as tall as the cap hit (this season's salary-cap charge) Cowboys spend on it, on the same scale as every other team. Lit windows are the share of that money on players who are actually on the field; dark windows are injured or idle money.
- The cards below:
- the same money in numbers. The bar fills with the share on the field, and "in spend" ranks the team among all 32 for that group.
Quarterbacks$46.2M94% on the field · 4th in spend
Running backs$8.2M47% on the field · 22nd in spend
Wide receivers$55.3M87% on the field · 1st in spend
Tight ends$10.3M73% on the field · 22nd in spend
Offensive line$40.9M86% on the field · 21st in spend
Defensive line$42.4M79% on the field · 25th in spend
Linebackers$8.3M78% on the field · 30th in spend
Secondary$45.1M78% on the field · 14th in spend
Specialists$5.6M100% on the field · 14th in spend
Best value on the roster
Earning more than they cost
↳Bottom lineBest value on the roster: Shemar James, played 70th and paid 35th among LBs.
?How to read the contract tables
- One row = one contract.
- 2026 cap hit, average per year and years left.
- Paid / played bars:
- the gold bar is where his pay ranks among players at his position across the league, the green bar where his play ranks (EPA, expected points added, for QB, RB, WR, TE; share of snaps for everyone else). Full bar = top of the league.
- Gap:
- played rank minus paid rank, in percentile points. Positive (green) means he gives more than he costs; negative (red) means the opposite.
3 contracts
Quarterbacks $46.2M
Player2026 capPer yearPaid / playedGapEPA
 Dak PrescottQB$43.5M$60.0M · 2 yrs left−3+57.7 EPA
 Sam HowellQB$2.5M$2.5M · 1 yr left−53+0.0 EPA
 Kyle TraskQB$220K$330K · 1 yr left−2+0.0 EPA
4 contracts
Running backs $8.2M

8 contracts
Wide receivers $55.3M
Player2026 capPer yearPaid / playedGapEPA
 George PickensWR$27.3M$27.3M · 1 yr left−3+25.4 EPA
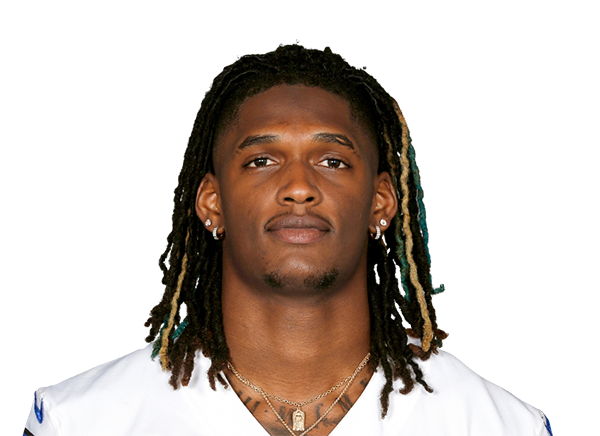 CeeDee LambWR$19.2M$34.0M · 2 yrs left0+33.0 EPA
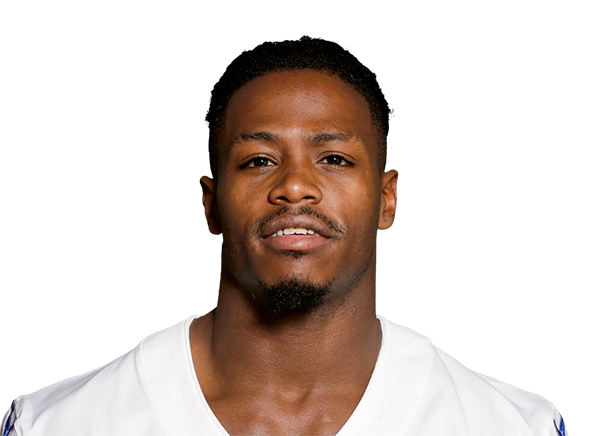 KaVontae TurpinWR$4.6M$4.5M · 2 yrs left−12+3.4 EPA
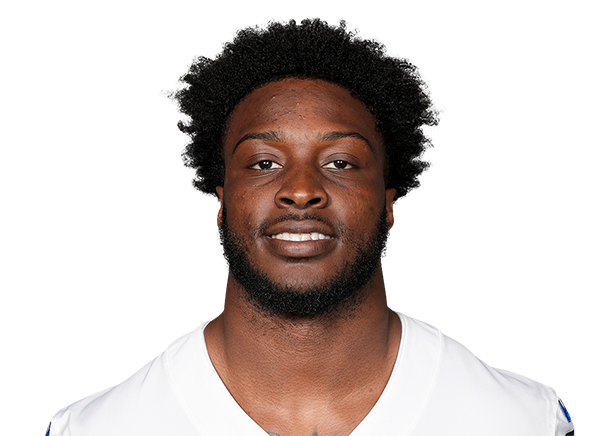 Ryan FlournoyWR$1.6M$4.5M · 1 yr left+33+18.1 EPA
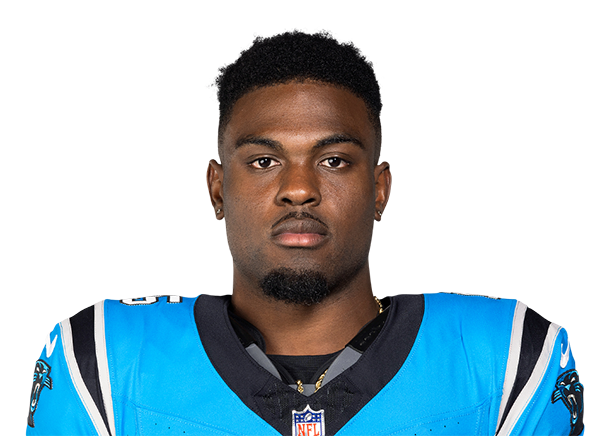 Jonathan MingoWR$1.1M$1.1M · 1 yr left+10-0.5 EPA
 Camden BrownWR$1.0M$1.0M · 3 yrs left−34+0.0 EPA
 Anthony SmithWR$248K$248K · 1 yr left−7+0.0 EPA
 Jordan HudsonWR$248K$248K · 1 yr left+43-0.5 EPA
5 contracts
Tight ends $10.3M
Player2026 capPer yearPaid / playedGapEPA
 Jake FergusonTE$5.6M$12.5M · 3 yrs left−40-2.2 EPA
 Luke SchoonmakerTE$2.0M$1.6M · 1 yr left+8+2.1 EPA
 Brevyn Spann-FordTE$1.9M$6.0M · 3 yrs left+18+3.4 EPA
 Princeton FantTE · injured$540K$1.1M · 2 yrs left−18+0.0 EPA
 Michael TriggTE$248K$248K · 1 yr left−4+0.0 EPA
12 contracts
Offensive line $40.9M
Player2026 capPer yearPaid / playedGapSnaps
 Tyler SmithLG$10.3M$24.0M · 3 yrs left−2558% snaps
 Terence SteeleRT$8.7M$11.0M · 3 yrs left+1100% snaps
 T.J. BassRG$5.8M$5.8M · 1 yr left−2042% snaps
 Tyler BookerLG$5.1M$5.6M · 3 yrs left+9100% snaps
 Tyler GuytonLT$3.6M$3.3M · 2 yrs left+1399% snaps
 Cooper BeebeC$1.6M$1.5M · 2 yrs left+32100% snaps
 Broderick JonesLT$1.6M$4.2M · 1 yr left−107% snaps
 Drew SheltonRT$1.4M$1.4M · 4 yrs left−151% snaps
 Matt HennessyC · injured$1.3M$1.4M · 1 yr left−440% snaps
 Ajani CorneliusRT$1.1M$1.1M · 3 yrs left−300% snaps
 Wanya MorrisLT$330K$330K · 1 yr left−150% snaps
 Marcellus JohnsonLT$248K$248K · 1 yr left−40% snaps
15 contracts
Defensive line $42.4M
Player2026 capPer yearPaid / playedGapSnaps
 Quinnen WilliamsIDL$8.6M$35.3M · 3 yrs left+567% snaps
 Kenny ClarkIDL$6.7M$21.3M · 1 yr left+967% snaps
 Rashan GaryED$5.7M$16.0M · 2 yrs left+1167% snaps
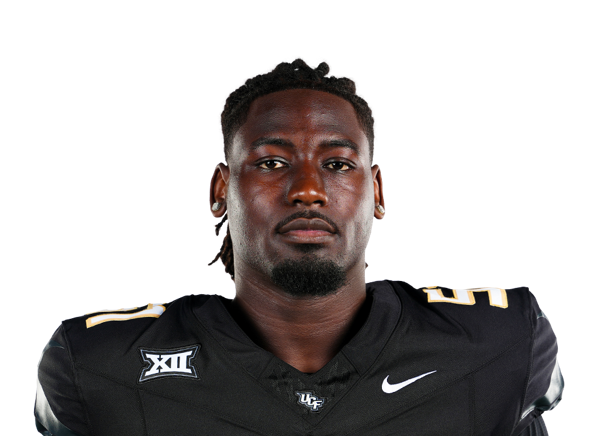 Malachi LawrenceED · injured$5.1M$5.1M · 4 yrs left−1637% snaps
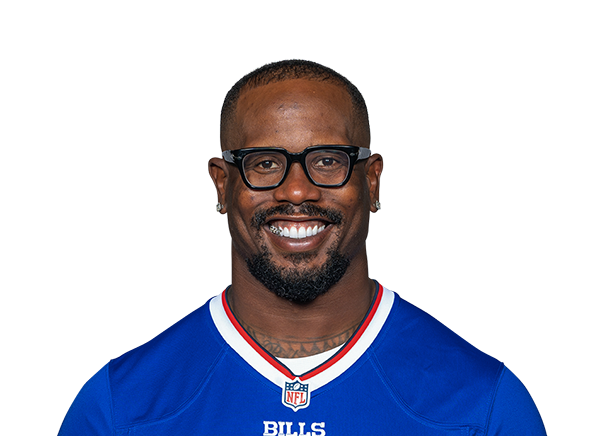 Von MillerED$3.1M$5.5M · 1 yr left−1623% snaps
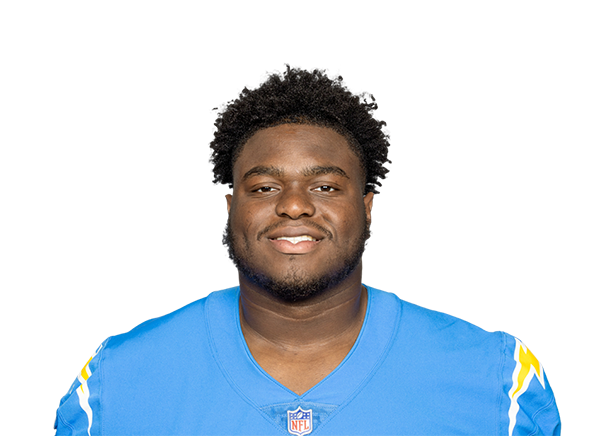 Otito OgbonniaIDL$2.4M$2.8M · 1 yr left+845% snaps
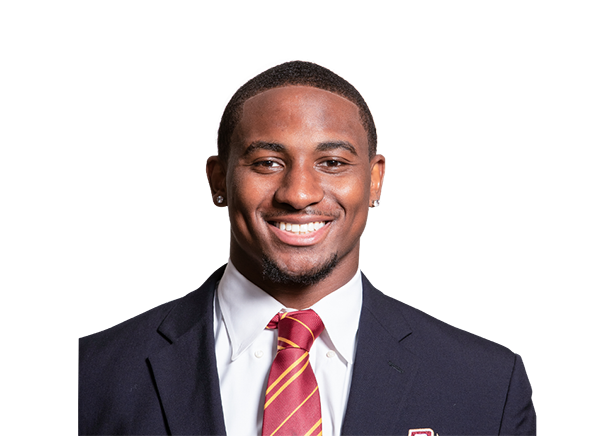 Donovan EzeiruakuED$2.3M$2.5M · 3 yrs left+3166% snaps
 Jonathan BullardIDL · injured$1.9M$2.0M · 1 yr left−1911% snaps
 Jaishawn BarhamED$1.7M$1.7M · 4 yrs left+2653% snaps
 LT OvertonIDL$1.3M$1.3M · 4 yrs left+830% snaps
 Tyrus WheatED$1.2M$1.2M · 1 yr left−123% snaps
 James HoustonED$1.1M$1.1M · 1 yr left+111% snaps
 Kelvin Gilliam Jr.IDL · injured$1.0M$1.0M · 3 yrs left−250% snaps
 Tommy Dunn Jr.IDL$248K$248K · 1 yr left−60% snaps
 Adedayo OdeleyeED$0K$248K · 1 yr left00% snaps
5 contracts
Linebackers $8.3M
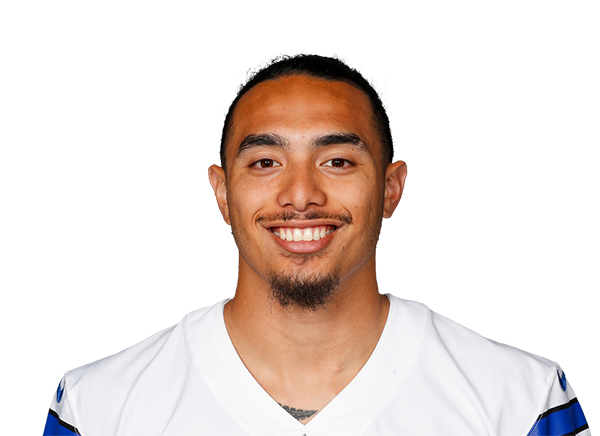
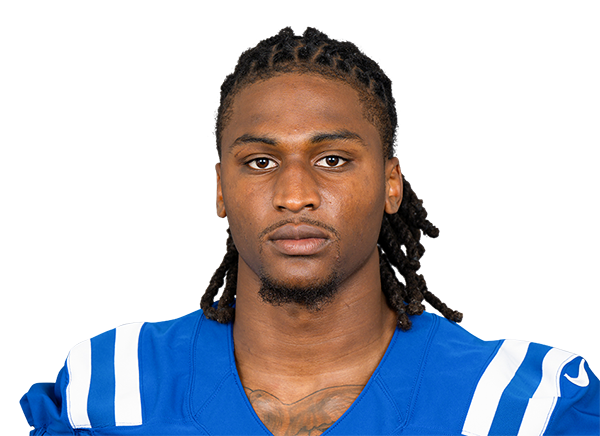
12 contracts
Secondary $45.1M
Player2026 capPer yearPaid / playedGapSnaps
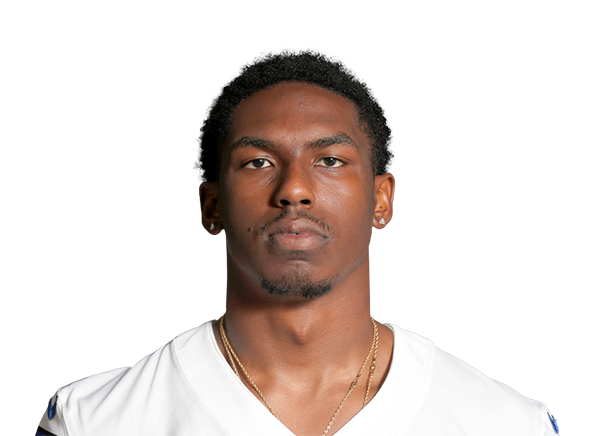 DaRon BlandCB$8.4M$22.5M · 3 yrs left+799% snaps
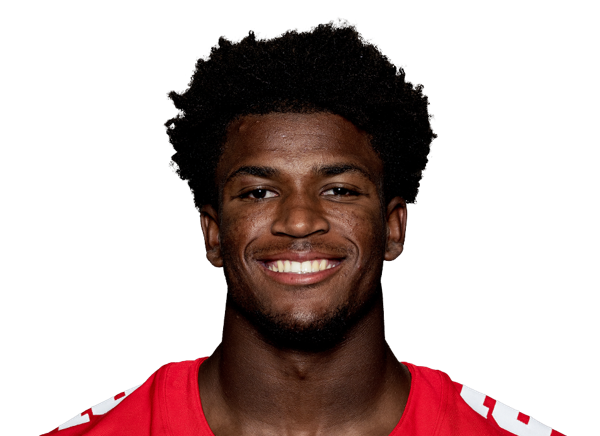 Caleb DownsS$7.2M$7.2M · 4 yrs left+294% snaps
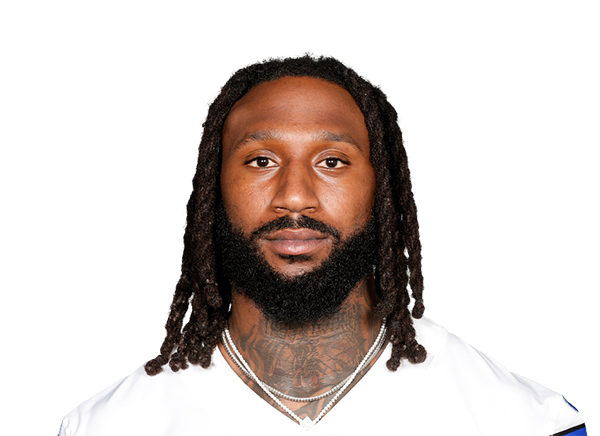 Malik HookerS$6.6M$5.0M · 1 yr left−2150% snaps
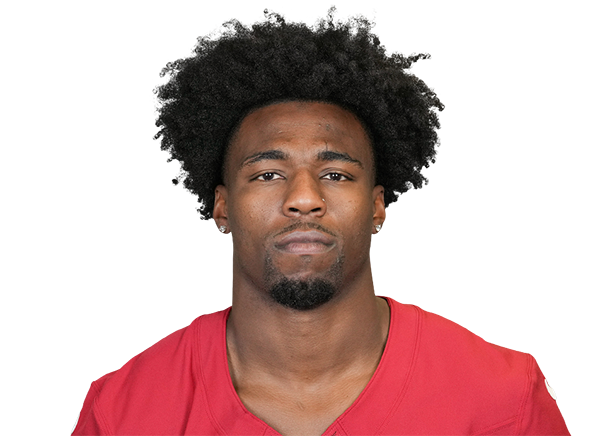 Jalen ThompsonS · injured$4.6M$11.0M · 3 yrs left−2927% snaps
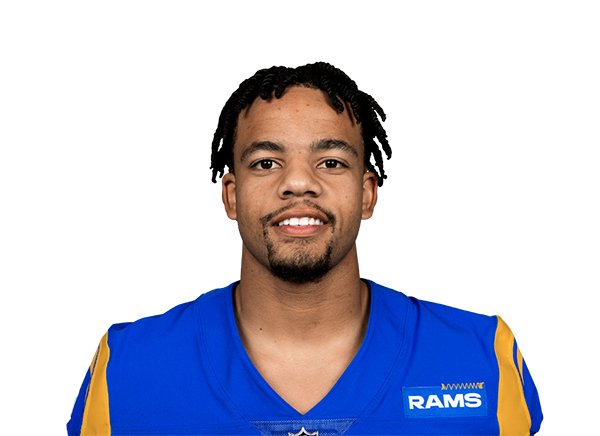 Cobie DurantCB$4.0M$4.0M · 1 yr left−2137% snaps
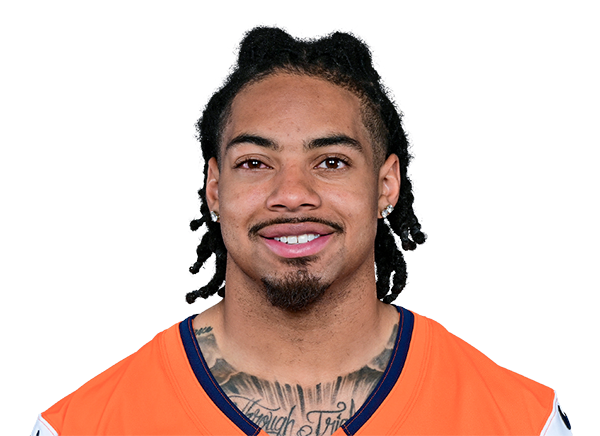 P.J. LockeS$4.0M$4.0M · 1 yr left−2923% snaps
 Joey Porter Jr.CB$3.3M$2.4M · 1 yr left−2324% snaps
 Markquese BellS$2.8M$3.0M · 2 yrs left−1237% snaps
 Shavon Revel Jr.CB$1.5M$1.6M · 3 yrs left−426% snaps
 Devin MooreCB · injured$1.4M$1.4M · 4 yrs left−490% snaps
 Ameer SpeedCB$1.1M$1.2M · 2 yrs left+1423% snaps
 Tyrek FunderburkCB$206K$248K · 1 yr left−30% snaps
2 contracts
Specialists $5.6M
Player2026 capPer yearPaid / playedGapSnaps
 Bryan AngerP$4.1M$3.2M · 1 yr left−7511% snaps
 Trent SiegLS$1.5M$1.5M · 2 yrs left−3811% snaps
Gold bar: where the player's pay ranks among his position group league-wide. Green bar: where his play ranks (EPA for skill players, share of snaps for everyone else). Gap = played minus paid, in percentile points.