 Pittsburgh SteelersAsked and Answered: Nov. 10
 New York GiantsGiants Now: Michael Strahan offers high praise of Arvell Reese
 Philadelphia EaglesAAA Official Review: What did the Eagles, Joe Milton learn from the QB's first start?
 Buffalo Bills'There's no panic' | The Bills stay strong through early struggles and injuries in MNF win over the Minnesota Vikings
 ESPNVikings left at QB crossroads after Carson Wentz's poor MNF showing vs. Bills
 Broncos DeskBroncos are 7-2, but the snaps say 4.1 wins and the 11th seed in the conference5 h ago
 Pro Football RumorsSeahawks Interested In Adding WR Depth
 InjuryCarl Granderson: Active → Cleared7 h ago
 ESPNCarson Beck next man up for Cardinals
The LabEvery contract against the field
 Kansas City ChiefsThe cap file
68 contracts count $275M against the 2026 cap. 87% of it belongs to players on the field, 4th of 32. $9.2M is injured and $25.8M is healthy but not playing. The biggest building: defensive line, $72.7M, 9th in the league.
↳Bottom line87% of the Chiefs cap is on the field (4th of 32). The most money goes to defensive line: $72.7M, 9th in the league.
?How to read this chart
- The skyline above:
- one building per position group, as tall as the cap hit (this season's salary-cap charge) Chiefs spend on it, on the same scale as every other team. Lit windows are the share of that money on players who are actually on the field; dark windows are injured or idle money.
- The cards below:
- the same money in numbers. The bar fills with the share on the field, and "in spend" ranks the team among all 32 for that group.
Quarterbacks$38.8M89% on the field · 10th in spend
Running backs$8.1M85% on the field · 23rd in spend
Wide receivers$15.0M70% on the field · 28th in spend
Tight ends$15.0M79% on the field · 9th in spend
Offensive line$48.7M84% on the field · 16th in spend
Defensive line$72.7M88% on the field · 9th in spend
Linebackers$27.9M92% on the field · 4th in spend
Secondary$38.7M92% on the field · 20th in spend
Specialists$10.3M98% on the field · 2nd in spend
Best value on the roster
Earning more than they cost
↳Bottom lineBest value on the roster: Kahlil Benson, played 87th and paid 27th among OLs.
?How to read the contract tables
- One row = one contract.
- 2026 cap hit, average per year and years left.
- Paid / played bars:
- the gold bar is where his pay ranks among players at his position across the league, the green bar where his play ranks (EPA, expected points added, for QB, RB, WR, TE; share of snaps for everyone else). Full bar = top of the league.
- Gap:
- played rank minus paid rank, in percentile points. Positive (green) means he gives more than he costs; negative (red) means the opposite.
3 contracts
Quarterbacks $38.8M
Player2026 capPer yearPaid / playedGapEPA
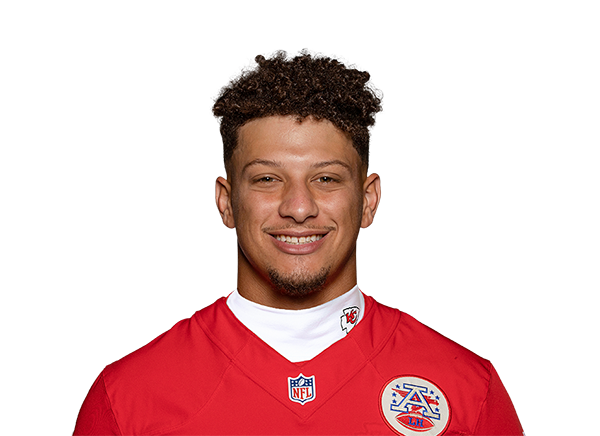 Patrick MahomesQB$34.7M$64.0M · 7 yrs left0+42.3 EPA
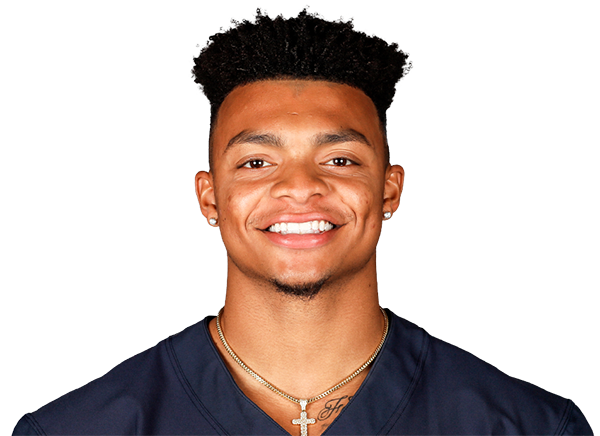 Justin FieldsQB$3.0M$11.0M · final year+1-6.6 EPA
 Garrett NussmeierQB$1.1M$1.1M · 4 yrs left−28+0.0 EPA
4 contracts
Running backs $8.1M
10 contracts
Wide receivers $15.0M
Player2026 capPer yearPaid / playedGapEPA
 Xavier WorthyWR$3.8M$3.4M · 2 yrs left−20+0.5 EPA
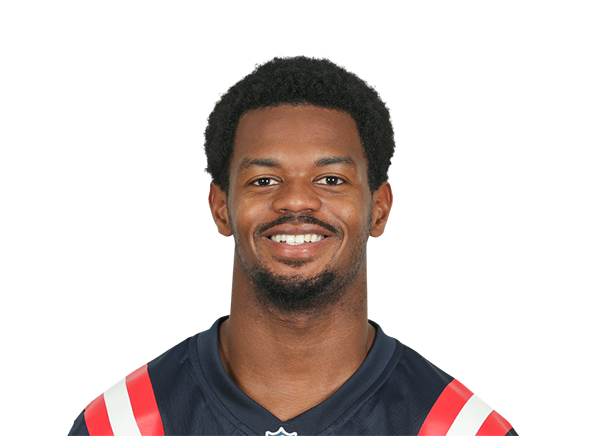 Tyquan ThorntonWR · injured$3.5M$5.5M · 2 yrs left+19+19.0 EPA
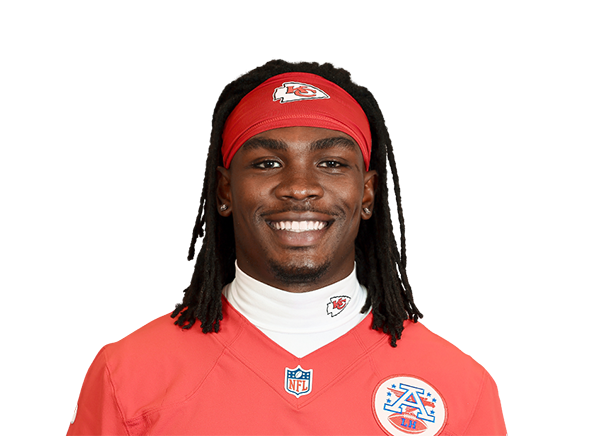 Rashee RiceWR$2.1M$1.6M · 1 yr left+9+6.1 EPA
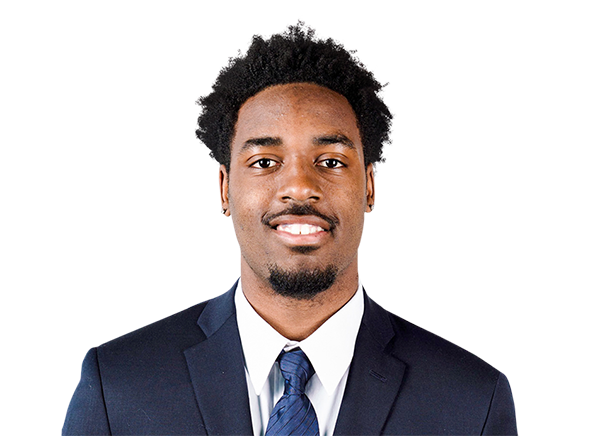 Jalen RoyalsWR$1.2M$1.3M · 3 yrs left−6-3.8 EPA
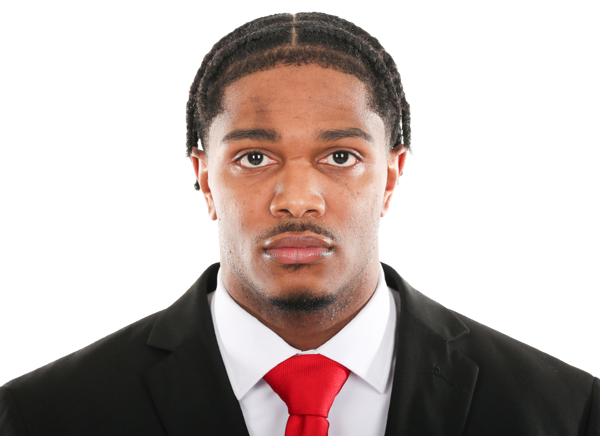 Cyrus AllenWR$1.2M$1.2M · 4 yrs left+5-0.6 EPA
 Nikko RemigioWR$1.1M$1.1M · 1 yr left−36+0.0 EPA
 Jeff CaldwellWR · injured$1.0M$1.0M · 3 yrs left−35+0.0 EPA
 Jimmy HolidayWR · injured$515K$885K · 1 yr left−26+0.0 EPA
 Justin WatsonWR$371K$411K · 1 yr left+33+0.8 EPA
 Omari EvansWR$248K$248K · 1 yr left−7+0.0 EPA
5 contracts
Tight ends $15.0M
Player2026 capPer yearPaid / playedGapEPA
 Noah GrayTE$7.0M$6.0M · 1 yr left−1+11.5 EPA
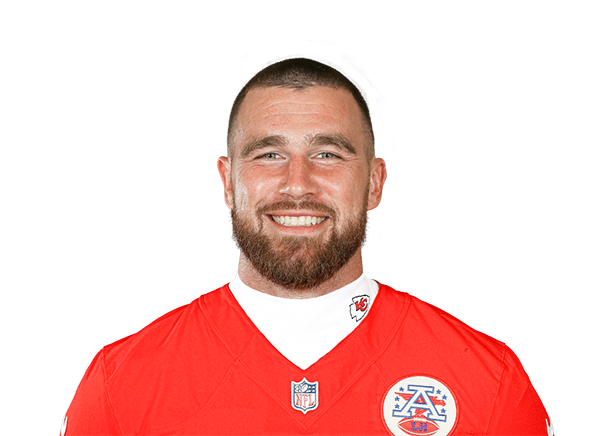 Travis KelceTE$4.9M$12.0M · 1 yr left+19+28.0 EPA
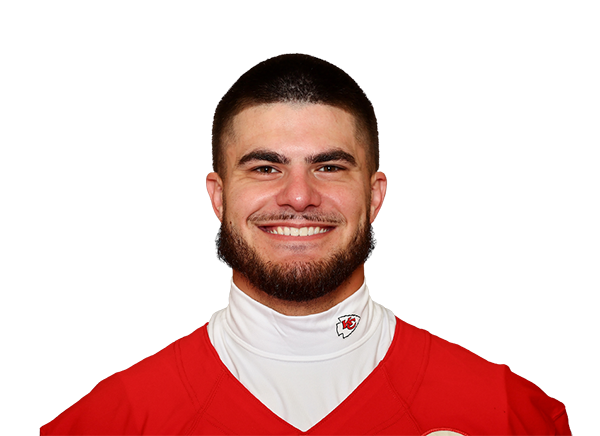 Jared WileyTE$1.2M$1.2M · 2 yrs left−43+0.0 EPA
 John Michael GyllenborgTE · injured$1.0M$1.0M · 3 yrs left−26+0.0 EPA
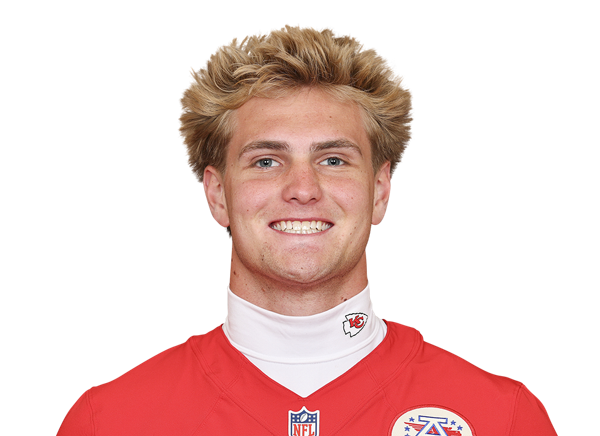 Jake BriningstoolTE$895K$998K · 2 yrs left+33-0.4 EPA
12 contracts
Offensive line $48.7M
Player2026 capPer yearPaid / playedGapSnaps
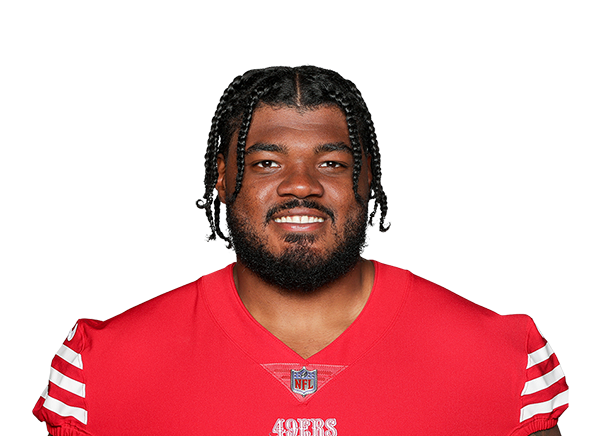 Jaylon MooreLT$18.7M$15.0M · 1 yr left−2778% snaps
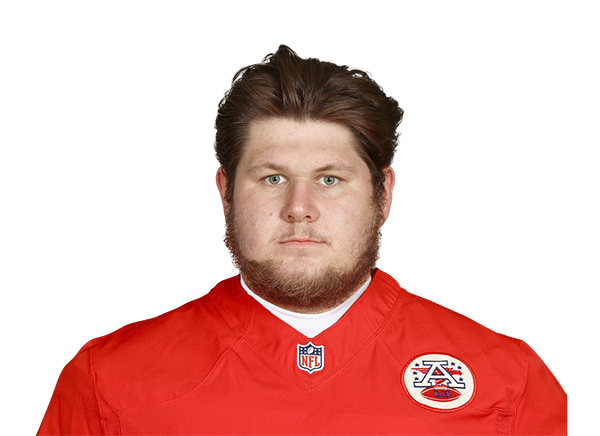 Creed HumphreyC$18.1M$18.0M · 2 yrs left−1399% snaps
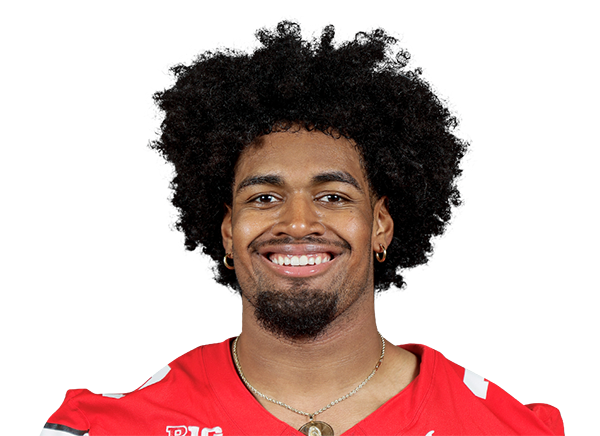 Josh SimmonsLT · injured$3.3M$3.7M · 3 yrs left−670% snaps
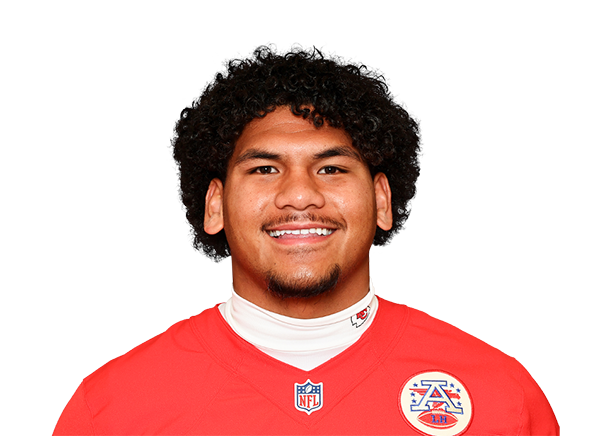 Kingsley SuamataiaLG$1.8M$1.6M · 2 yrs left+1074% snaps
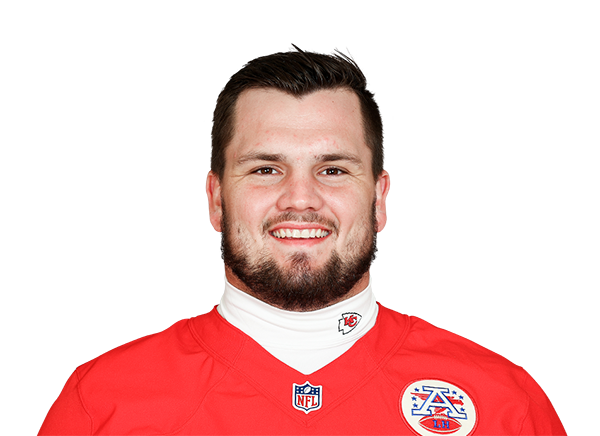 Mike CaliendoLG$1.4M$1.4M · 1 yr left+829% snaps
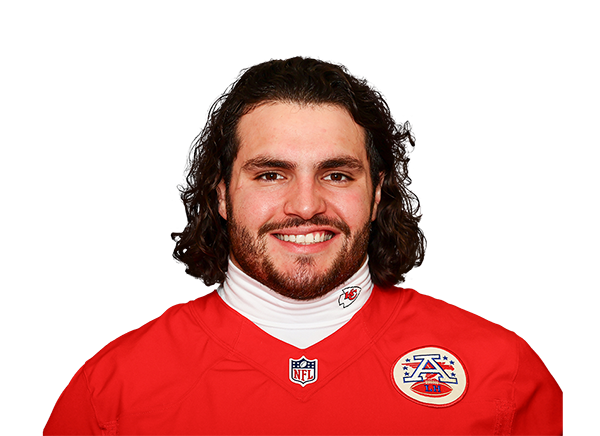 Hunter NourzadC$1.2M$1.1M · 2 yrs left+54% snaps
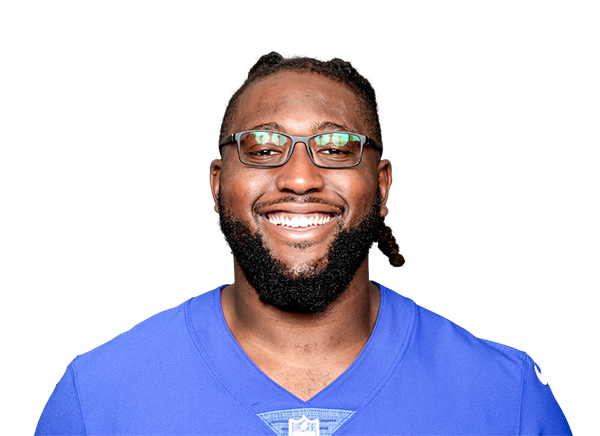 Joshua EzeuduLG$1.1M$1.3M · 1 yr left+1622% snaps
 Diego PoundsLT$1.0M$1.0M · 3 yrs left−290% snaps
 Kahlil BensonLG$1.0M$1.0M · 3 yrs left+60100% snaps
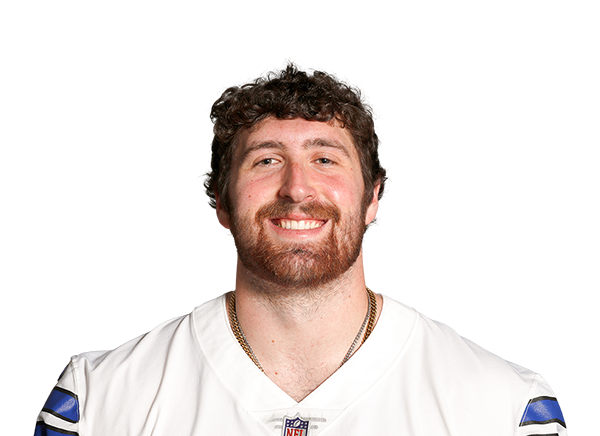 Matt WaletzkoRT · injured$565K$1.1M · 1 yr left−170% snaps
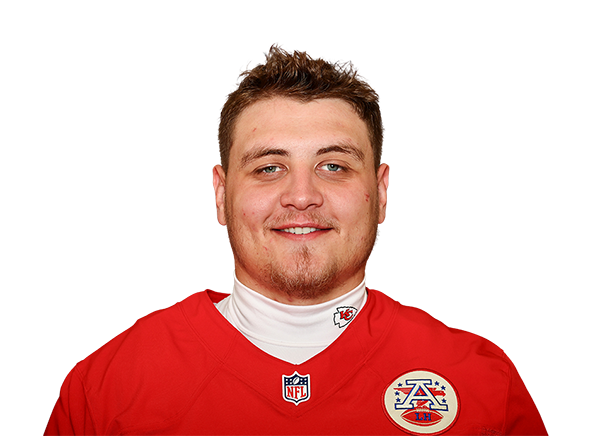 Ethan DriskellRT$248K$248K · 1 yr left−40% snaps
 Pete NygraC$248K$248K · 1 yr left−40% snaps
12 contracts
Defensive line $72.7M
Player2026 capPer yearPaid / playedGapSnaps
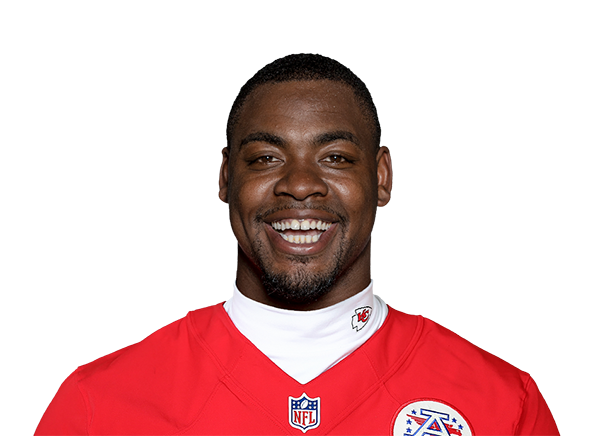 Chris JonesIDL$44.9M$31.8M · 3 yrs left−672% snaps
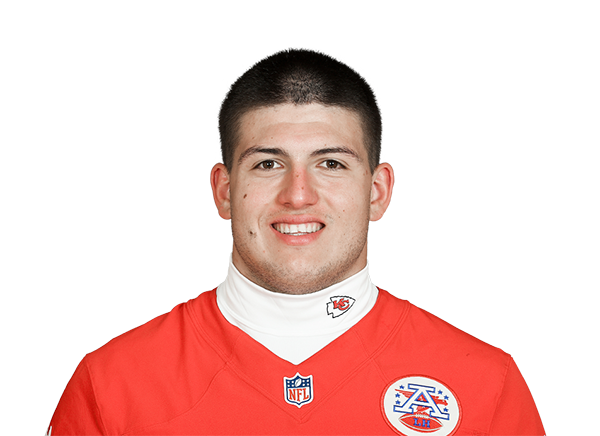 George KarlaftisED$7.4M$22.0M · 3 yrs left+1483% snaps
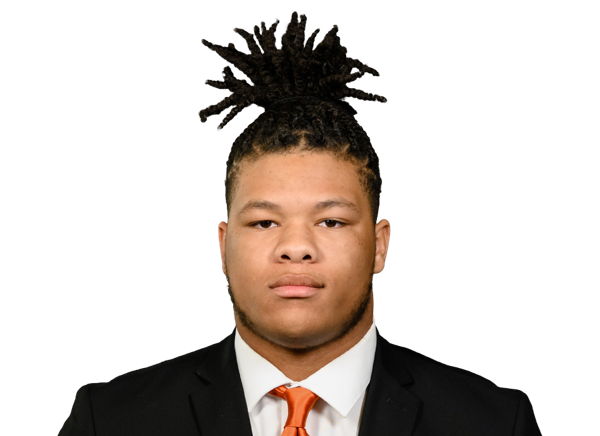 Peter WoodsIDL$4.5M$4.5M · 4 yrs left−740% snaps
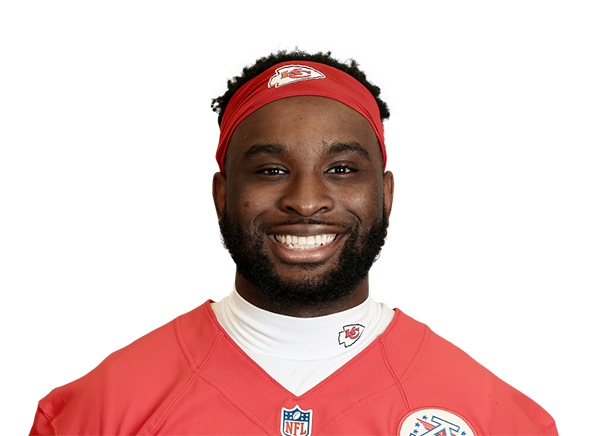 Felix Anudike-UzomahED$3.8M$3.0M · 1 yr left+952% snaps
 Khyiris TongaIDL$3.3M$7.0M · 3 yrs left+546% snaps
 R Mason ThomasED$3.0M$3.0M · 4 yrs left+445% snaps
 Omarr Norman-LottIDL · injured$1.6M$1.8M · 3 yrs left−510% snaps
 Ashton GillotteED$1.5M$1.7M · 3 yrs left+2651% snaps
 Bryson EasonIDL$1.0M$1.0M · 3 yrs left+78% snaps
 Jack PyburnED$1.0M$1.0M · 3 yrs left−260% snaps
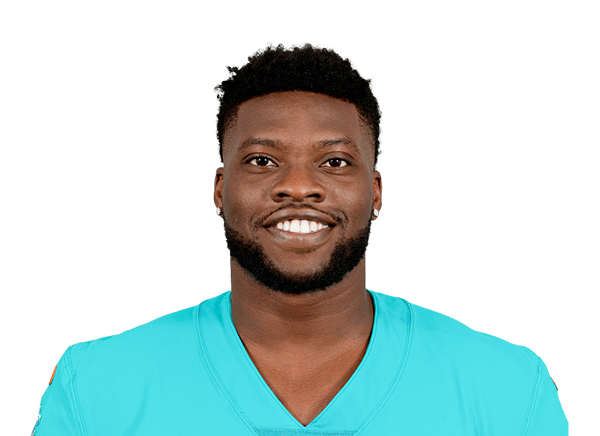 Emmanuel OgbahED$411K$411K · 1 yr left−160% snaps
 Michael HeldmanED$248K$248K · 1 yr left−60% snaps
6 contracts
Linebackers $27.9M
Player2026 capPer yearPaid / playedGapSnaps
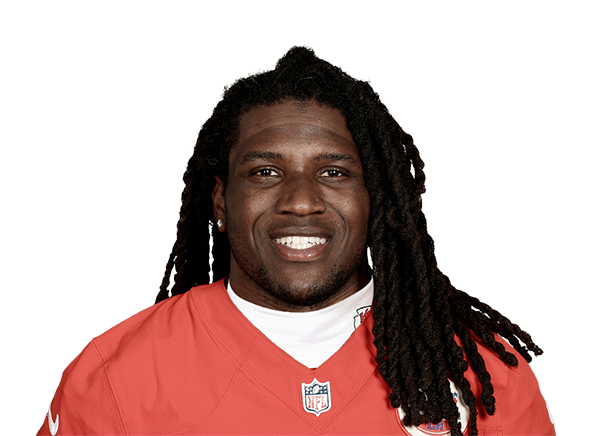 Nick BoltonLB$19.3M$15.0M · 2 yrs left−799% snaps
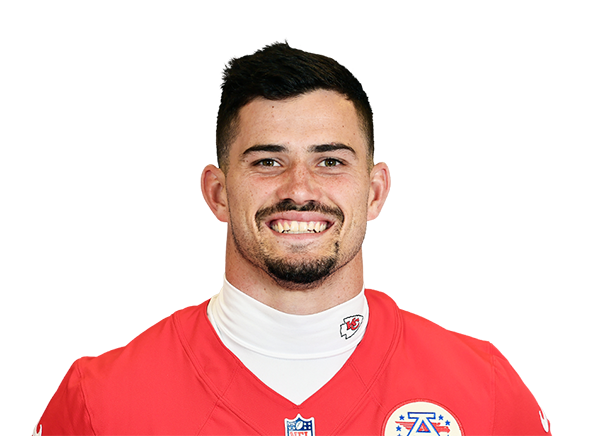 Drue TranquillLB$5.0M$3.5M · 1 yr left+188% snaps
 Jack CochraneLB$1.4M$1.4M · 1 yr left+225% snaps
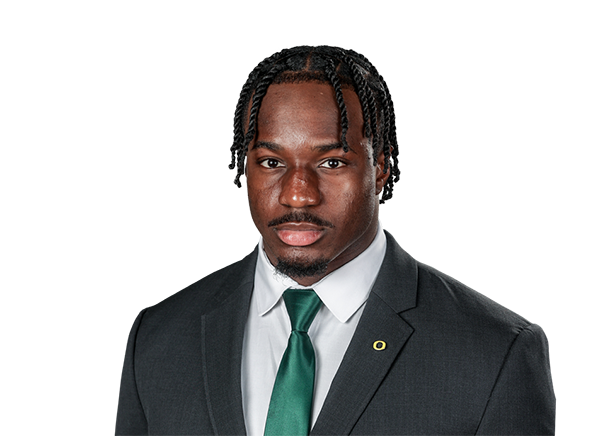 Jeffrey BassaLB$1.1M$1.2M · 3 yrs left+74% snaps
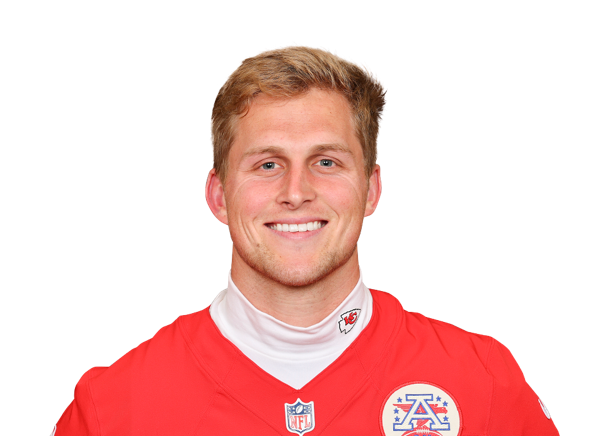 Cooper McDonaldLB$876K$988K · 2 yrs left+142% snaps
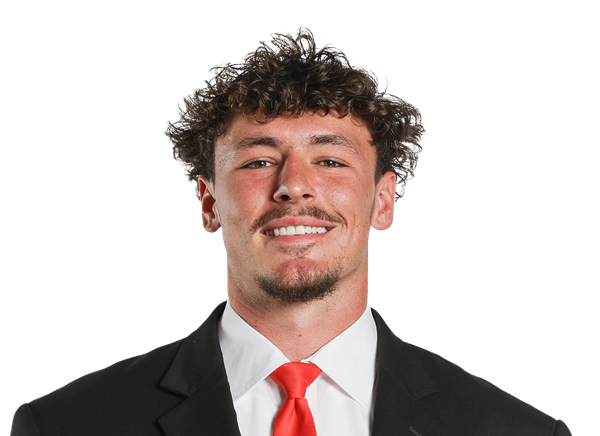 Aiden FisherLB$248K$248K · 1 yr left−10% snaps
12 contracts
Secondary $38.7M
Player2026 capPer yearPaid / playedGapSnaps
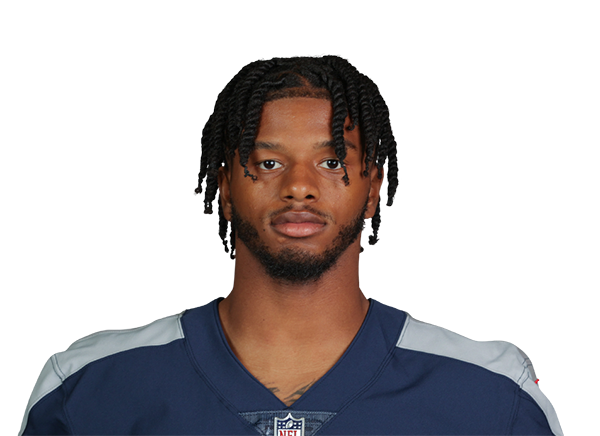 Kristian FultonCB$13.0M$10.0M · 1 yr left−3248% snaps
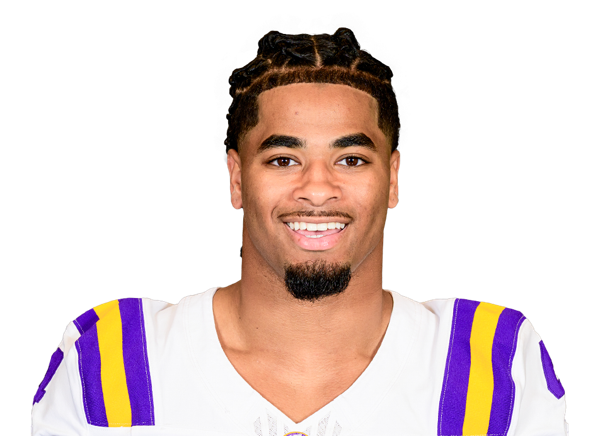 Mansoor DelaneCB$10.5M$10.5M · 4 yrs left−2654% snaps
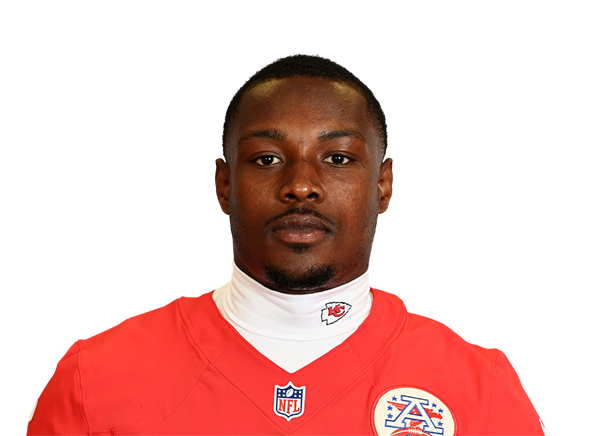 Chamarri ConnerS$3.9M$1.1M · 1 yr left−561% snaps
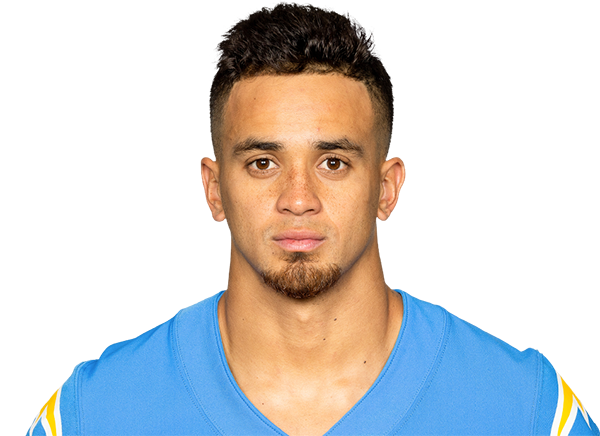 Alohi GilmanS$3.5M$8.0M · 3 yrs left+680% snaps
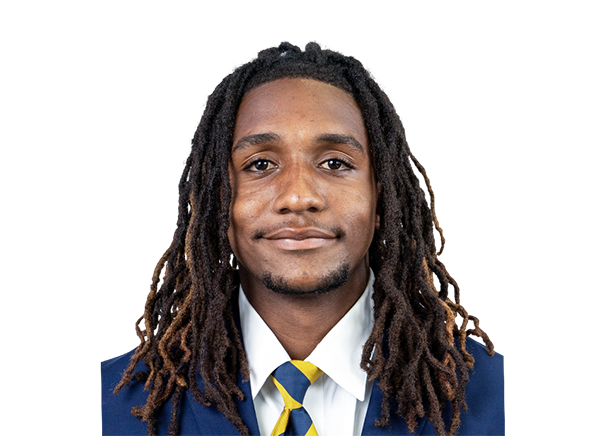 Nohl WilliamsCB$1.4M$1.6M · 3 yrs left+3693% snaps
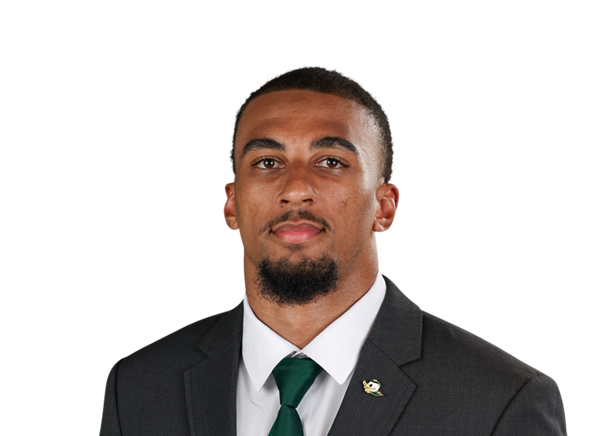 Jadon CanadyCB$1.4M$1.4M · 4 yrs left−174% snaps
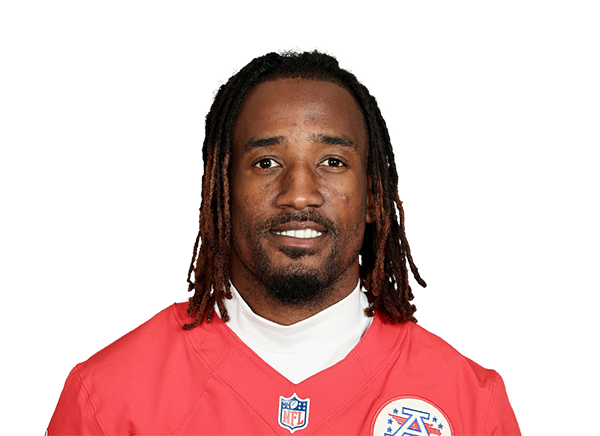 L'Jarius SneedCB · injured$1.2M$1.2M · 1 yr left+2448% snaps
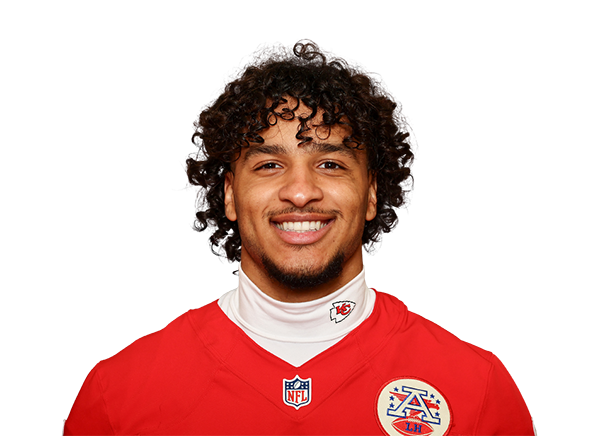 Jaden HicksS$1.2M$1.1M · 2 yrs left+3159% snaps
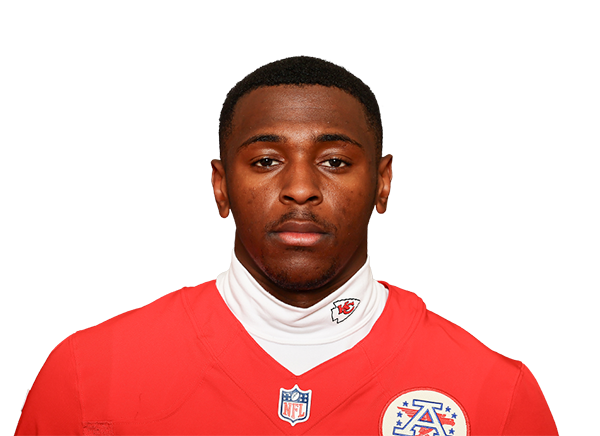 Chris Roland-WallaceCB$1.1M$945K · 1 yr left+2837% snaps
 Xavier NwankpaS$1.0M$1.0M · 3 yrs left+41% snaps
 D'Arco Perkins-McAllisterCB$248K$248K · 1 yr left−50% snaps
 DeShon SingletonS$248K$248K · 1 yr left−50% snaps
4 contracts
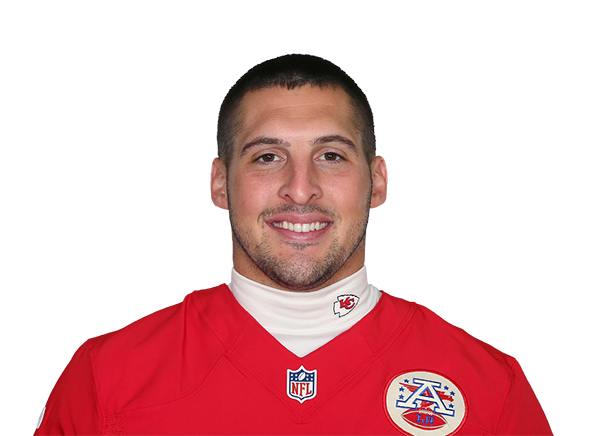
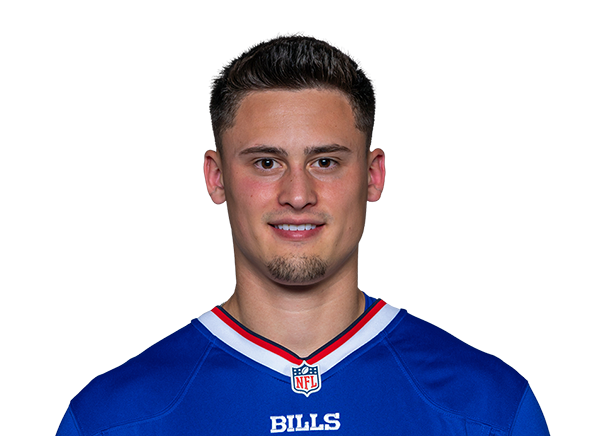
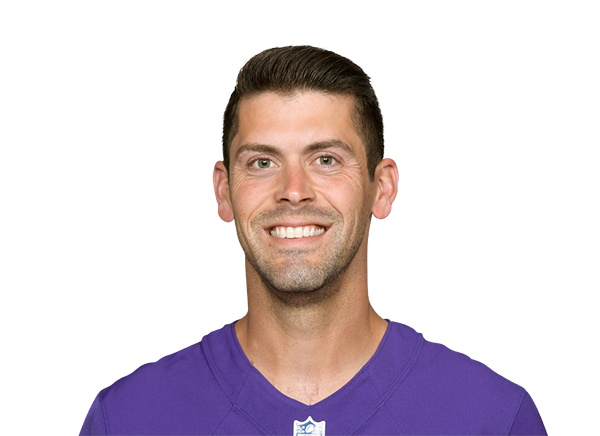
Specialists $10.3M
Gold bar: where the player's pay ranks among his position group league-wide. Green bar: where his play ranks (EPA for skill players, share of snaps for everyone else). Gap = played minus paid, in percentile points.