 Pittsburgh SteelersAsked and Answered: Nov. 10
 Philadelphia EaglesAAA Official Review: What did the Eagles, Joe Milton learn from the QB's first start?
 Buffalo Bills'There's no panic' | The Bills stay strong through early struggles and injuries in MNF win over the Minnesota Vikings
 ESPNVikings left at QB crossroads after Carson Wentz's poor MNF showing vs. Bills
 Broncos DeskBroncos are 7-2, but the snaps say 4.1 wins and the 11th seed in the conference5 h ago
 Pro Football RumorsSeahawks Interested In Adding WR Depth
 InjuryCarl Granderson: Active → Cleared7 h ago
 ESPNCarson Beck next man up for Cardinals
The LabEvery contract against the field
 New York GiantsThe cap file
66 contracts count $240M against the 2026 cap. 63% of it belongs to players on the field, 31st of 32. $65.8M is injured and $21.7M is healthy but not playing. The biggest building: defensive line, $80.8M, 2nd in the league.
↳Bottom line63% of the Giants cap is on the field (31st of 32). The most money goes to defensive line: $80.8M, 2nd in the league.
?How to read this chart
- The skyline above:
- one building per position group, as tall as the cap hit (this season's salary-cap charge) Giants spend on it, on the same scale as every other team. Lit windows are the share of that money on players who are actually on the field; dark windows are injured or idle money.
- The cards below:
- the same money in numbers. The bar fills with the share on the field, and "in spend" ranks the team among all 32 for that group.
Quarterbacks$8.3M53% on the field · 25th in spend
Running backs$8.0M83% on the field · 24th in spend
Wide receivers$15.7M81% on the field · 26th in spend
Tight ends$8.4M72% on the field · 27th in spend
Offensive line$43.3M88% on the field · 20th in spend
Defensive line$80.8M57% on the field · 2nd in spend
Linebackers$11.9M72% on the field · 25th in spend
Secondary$58.3M42% on the field · 3rd in spend
Specialists$4.7M100% on the field · 17th in spend
Best value on the roster
Earning more than they cost
↳Bottom lineBest value on the roster: J.J. McCarthy, played 81st and paid 17th among QBs.
?How to read the contract tables
- One row = one contract.
- 2026 cap hit, average per year and years left.
- Paid / played bars:
- the gold bar is where his pay ranks among players at his position across the league, the green bar where his play ranks (EPA, expected points added, for QB, RB, WR, TE; share of snaps for everyone else). Full bar = top of the league.
- Gap:
- played rank minus paid rank, in percentile points. Positive (green) means he gives more than he costs; negative (red) means the opposite.
3 contracts
Quarterbacks $8.3M
Player2026 capPer yearPaid / playedGapEPA
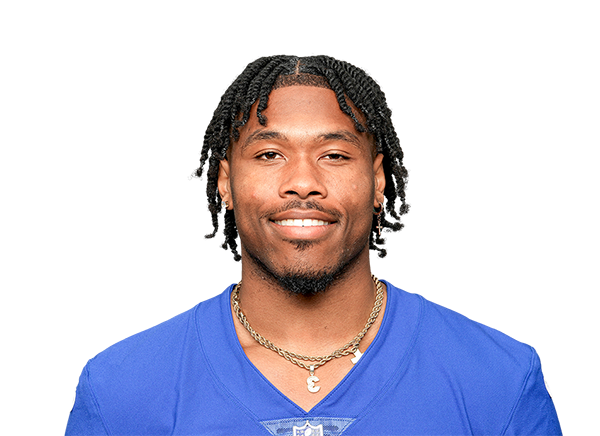
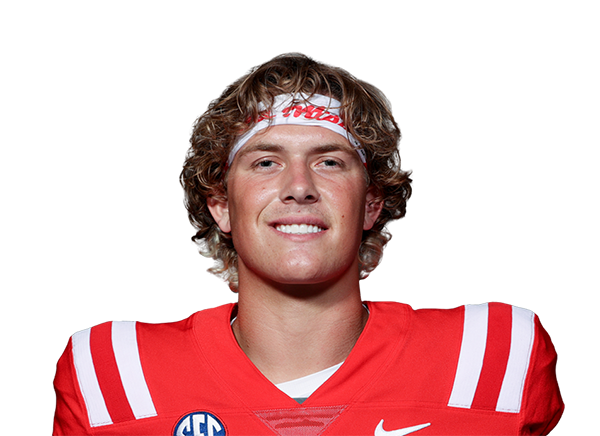 Jaxson DartQB · injured$3.9M$4.2M · 3 yrs left+21+24.5 EPA
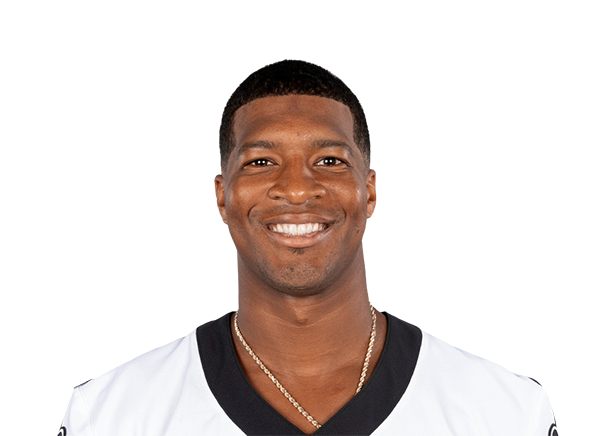 Jameis WinstonQB$3.5M$6.5M · 2 yrs left+6-1.6 EPA
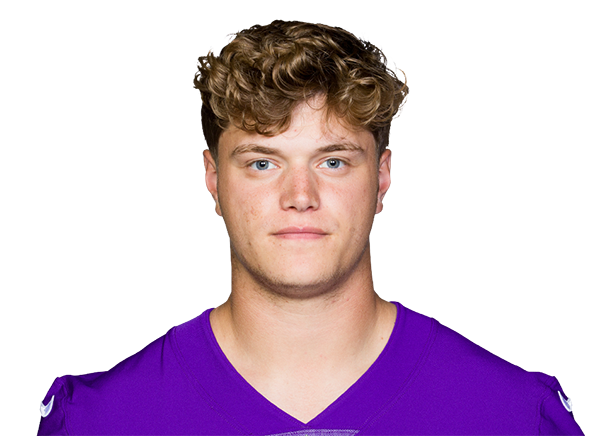 J.J. McCarthyQB$896K$5.5M · 2 yrs left+64+8.3 EPA
5 contracts
Running backs $8.0M
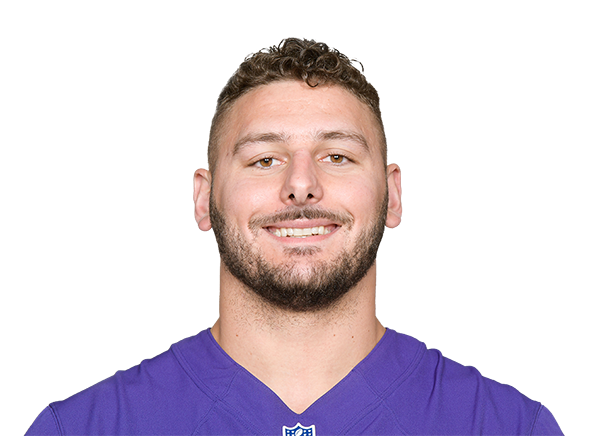
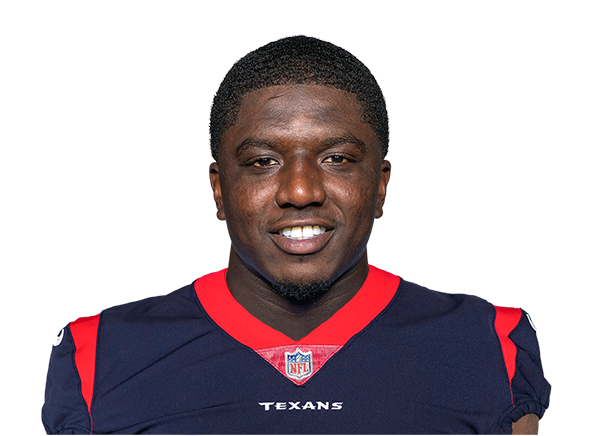
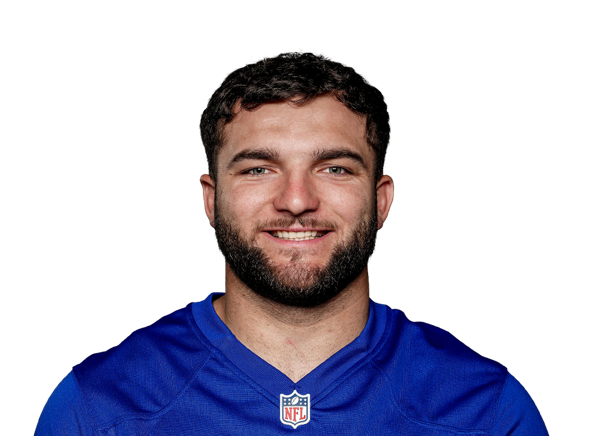
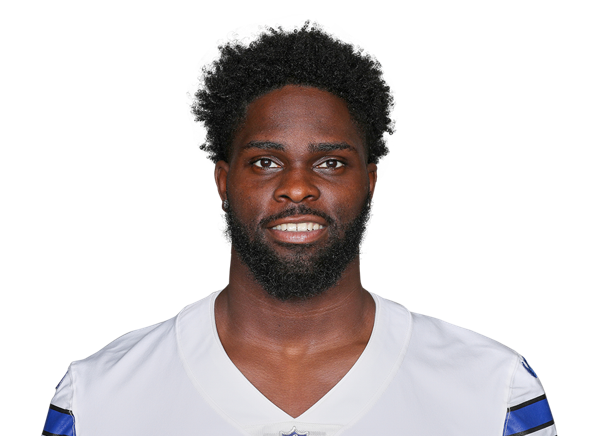
6 contracts
Wide receivers $15.7M
Player2026 capPer yearPaid / playedGapEPA
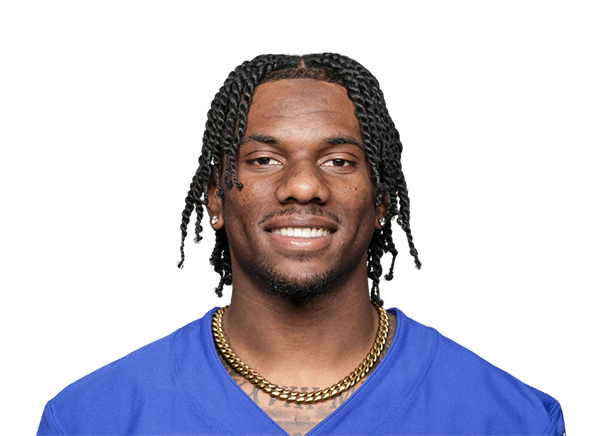 Malik NabersWR$8.0M$7.3M · 2 yrs left+2+17.2 EPA
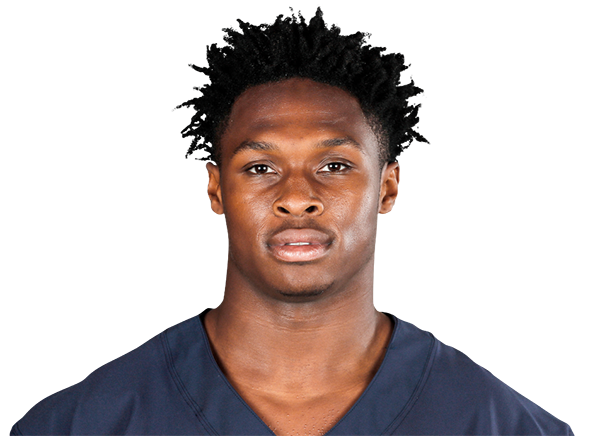 Darnell MooneyWR$3.0M$3.0M · 1 yr left+12+9.5 EPA
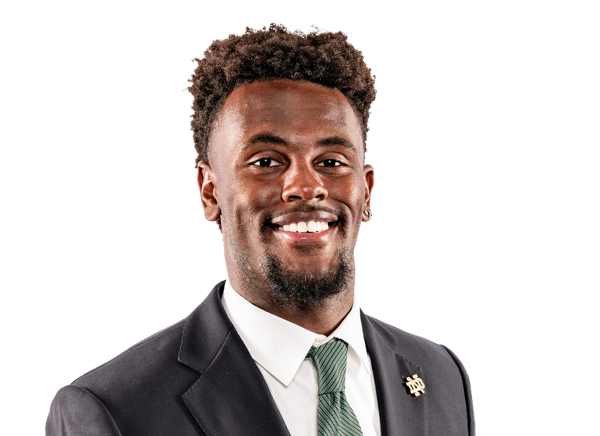 Malachi FieldsWR$1.8M$1.8M · 4 yrs left+18+8.4 EPA
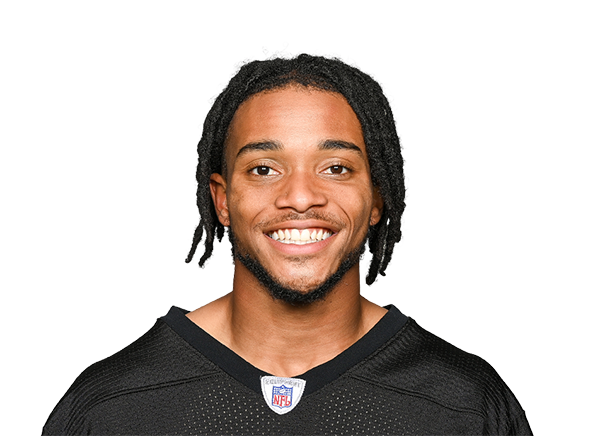 Calvin Austin IIIWR · injured$1.5M$1.5M · 1 yr left−54+0.0 EPA
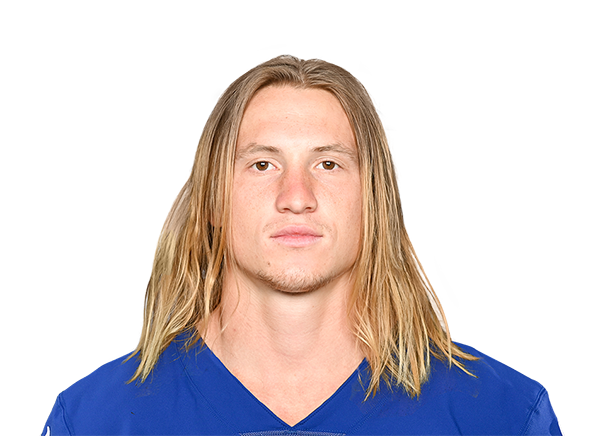 Gunner OlszewskiWR · injured$1.3M$1.4M · 1 yr left−47+0.0 EPA
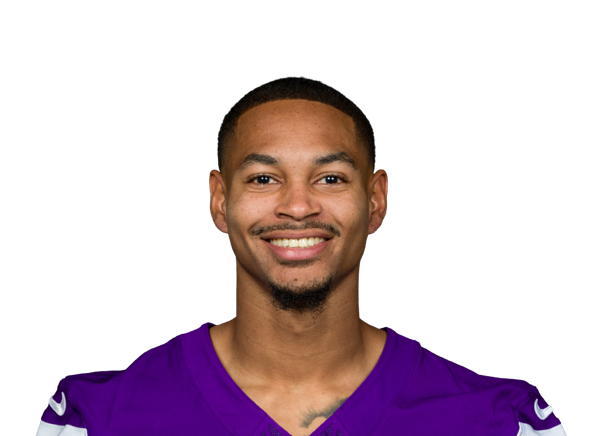 Dontae FlemingWR$193K$248K · 1 yr left−2+0.0 EPA
3 contracts
Tight ends $8.4M
Player2026 capPer yearPaid / playedGapEPA
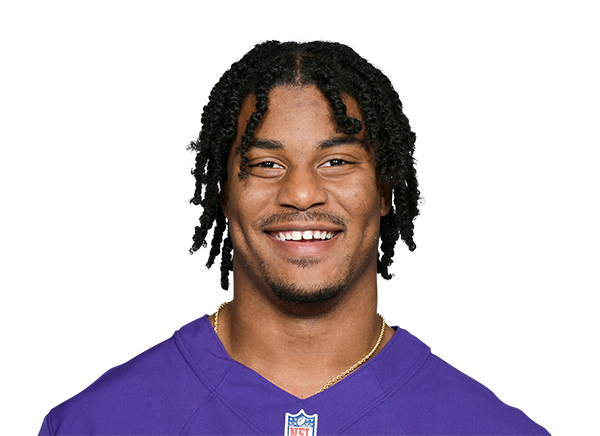 Isaiah LikelyTE$6.1M$13.3M · 3 yrs left+7+18.2 EPA
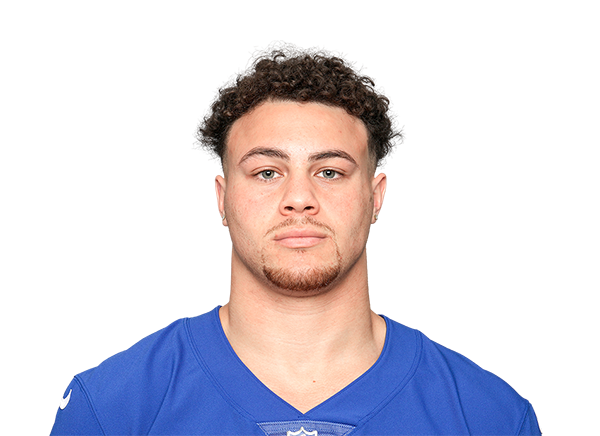 Theo JohnsonTE$1.3M$1.2M · 2 yrs left+21+2.3 EPA
 Thomas Fidone IITE$1.0M$1.1M · 3 yrs left+44+2.4 EPA
13 contracts
Offensive line $43.3M
Player2026 capPer yearPaid / playedGapSnaps
 Andrew ThomasLT$13.0M$23.5M · 2 yrs left−1696% snaps
 Francis MauigoaRG · injured$7.7M$7.7M · 4 yrs left+2100% snaps
 Jon RunyanLG$7.0M$11.0M · 2 yrs left+3100% snaps
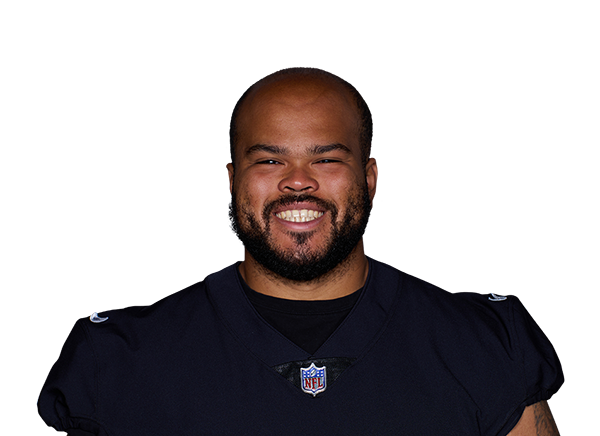 Jermaine EluemunorRT$5.9M$13.0M · 3 yrs left−1178% snaps
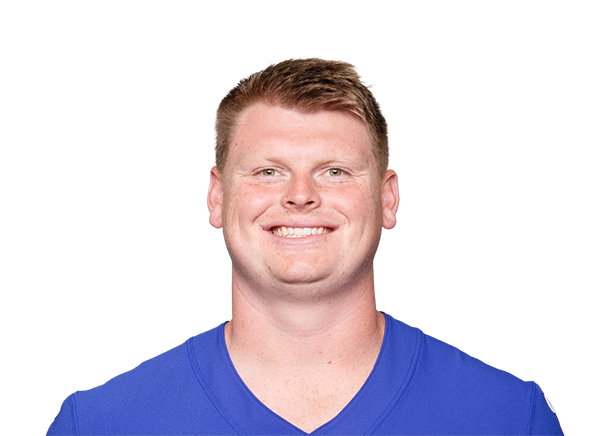 John Michael Schmitz Jr.C$4.3M$1.6M · 1 yr left−1634% snaps
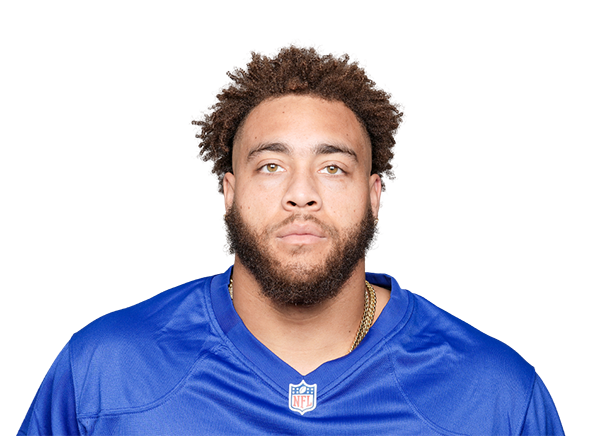 Aaron StinnieLG$1.3M$1.5M · 1 yr left−81% snaps
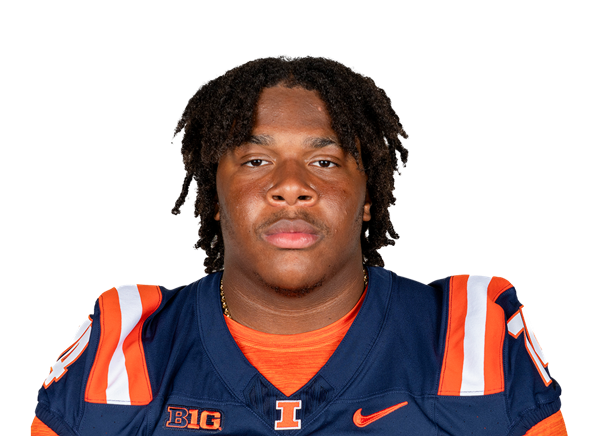 J.C. DavisRT$1.2M$1.2M · 4 yrs left+45% snaps
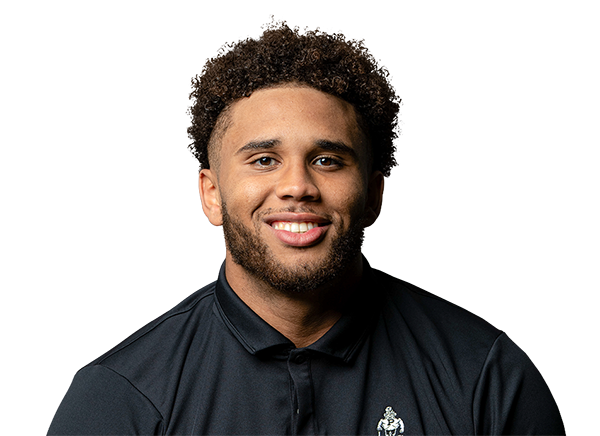 Marcus MbowRT$1.1M$1.2M · 3 yrs left+1822% snaps
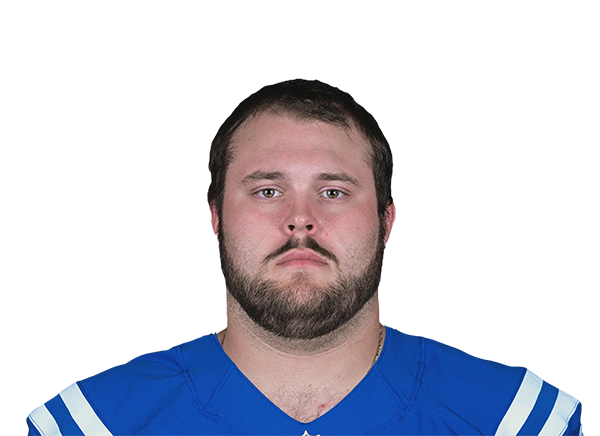 Josh SillsLG$763K$1.1M · 1 yr left−210% snaps
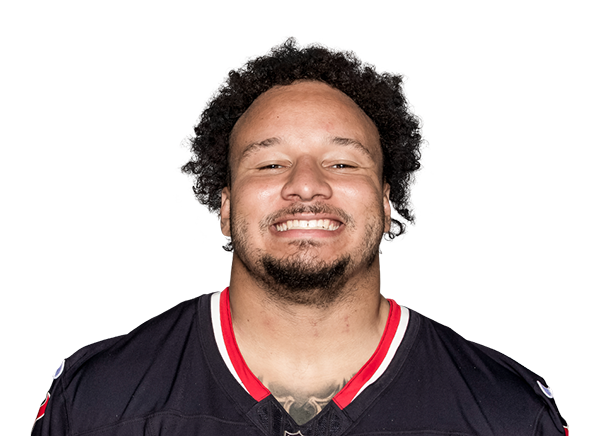 Kendrick GreenC$275K$330K · 1 yr left−150% snaps
 Josh GeskyLG$248K$248K · 1 yr left−40% snaps
 Geno VanDeMarkC$248K$248K · 1 yr left−40% snaps
 Jarrod GrayLT$248K$248K · 1 yr left−40% snaps
12 contracts
Defensive line $80.8M
Player2026 capPer yearPaid / playedGapSnaps
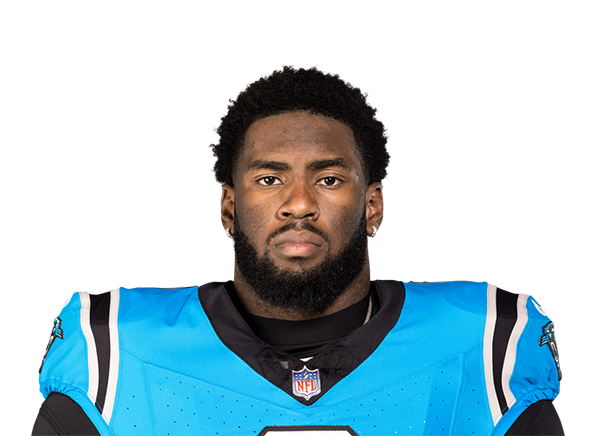 Brian BurnsED · injured$21.4M$28.2M · 3 yrs left−5023% snaps
 Kayvon ThibodeauxED$14.8M$7.8M · final year+175% snaps
 Arvell ReeseED$12.0M$12.0M · 4 yrs left+899% snaps
 Abdul CarterED$10.3M$11.3M · 3 yrs left+1086% snaps
 Roy Robertson-HarrisIDL · injured$5.8M$4.5M · 1 yr left−790% snaps
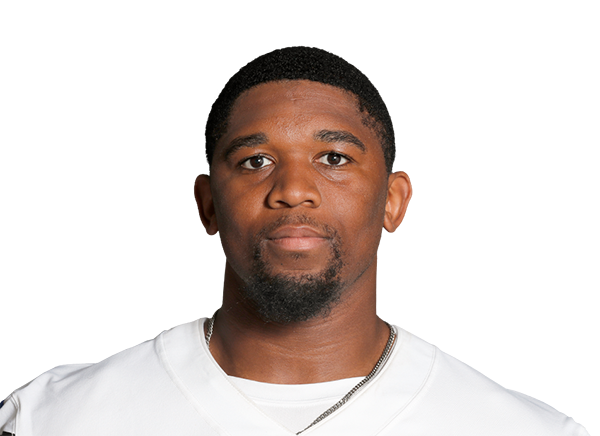 Chauncey GolstonED · injured$5.2M$6.0M · 2 yrs left−2825% snaps
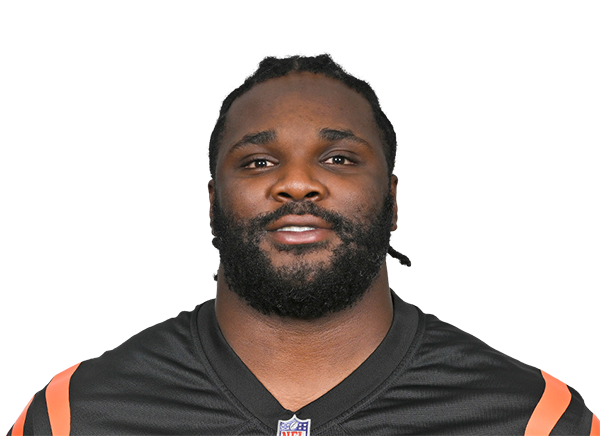 DJ ReaderIDL$4.5M$6.3M · 2 yrs left+757% snaps
 Shelby HarrisIDL$3.0M$3.0M · 1 yr left+1553% snaps
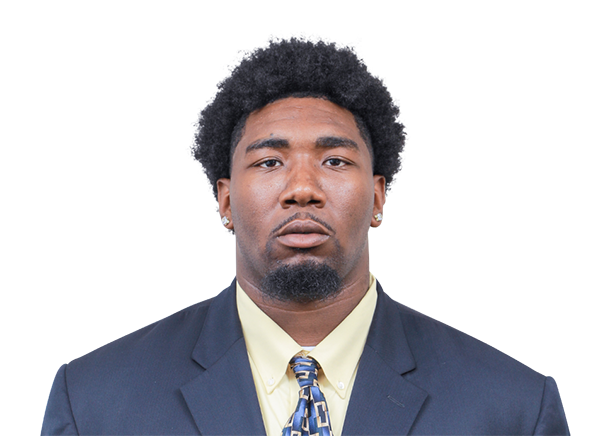 Darius AlexanderIDL$1.5M$1.7M · 3 yrs left+1239% snaps
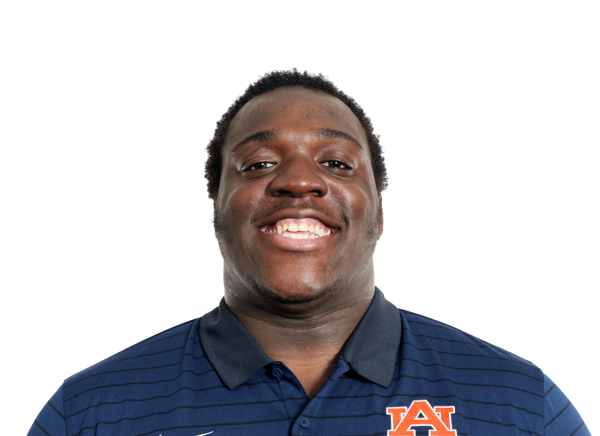 Bobby Jamison-TravisIDL$1.2M$1.2M · 4 yrs left−112% snaps
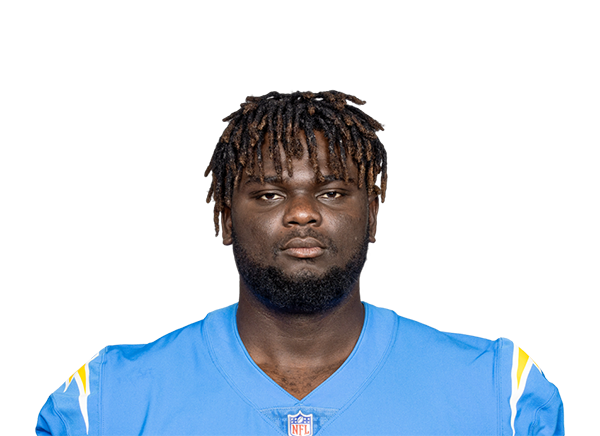 CJ OkoyeIDL$1.0M$1.0M · 1 yr left−220% snaps
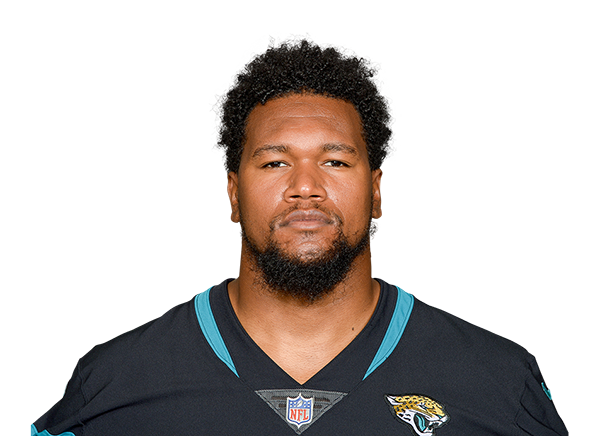 Dawuane SmootED$239K$330K · 1 yr left+287% snaps
6 contracts
Linebackers $11.9M
Player2026 capPer yearPaid / playedGapSnaps
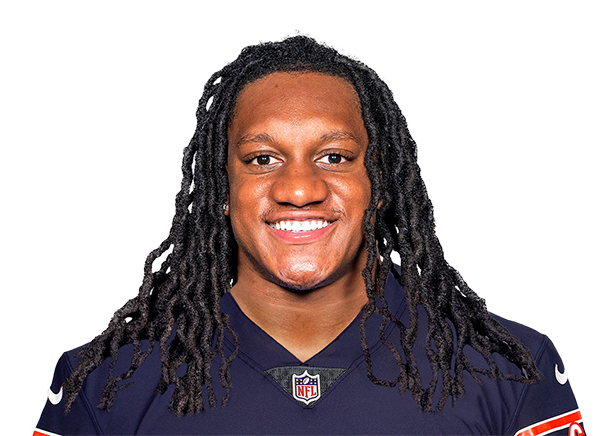 Tremaine EdmundsLB · injured$5.6M$12.0M · 3 yrs left−974% snaps
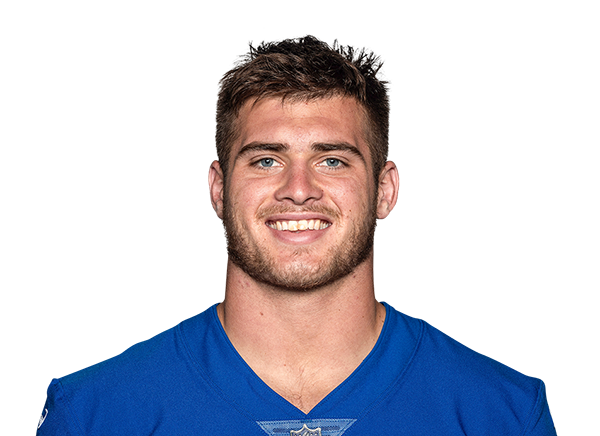 Micah McFaddenLB$3.0M$3.8M · 1 yr left−1326% snaps
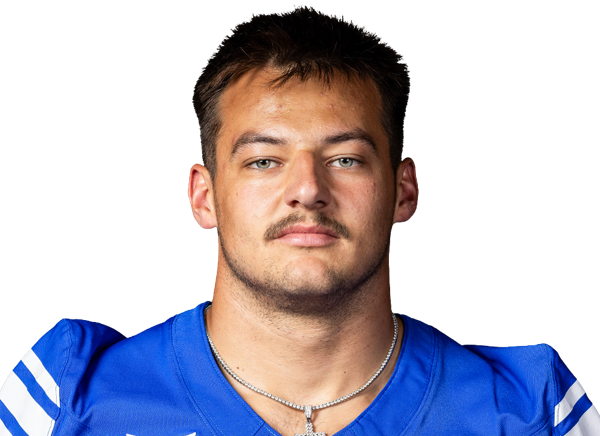 Jack KellyLB$1.2M$1.2M · 4 yrs left−120% snaps
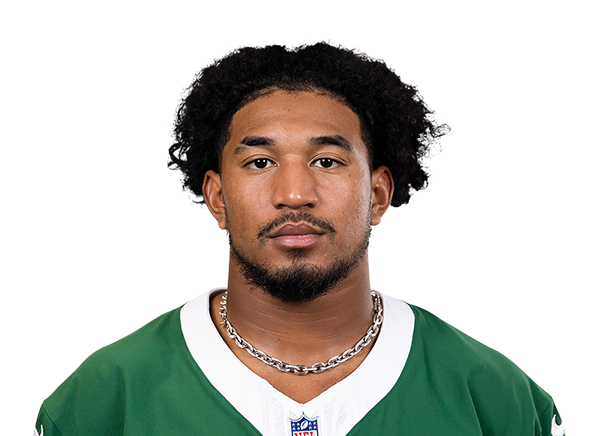 Zaire BarnesLB$1.1M$1.1M · 1 yr left−71% snaps
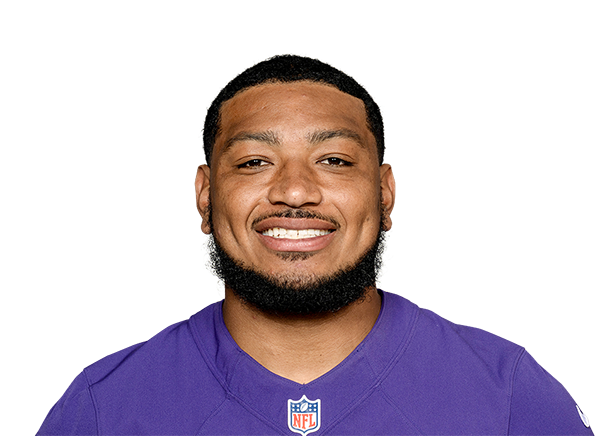 Malik HarrisonLB$776K$1.2M · 1 yr left+131% snaps
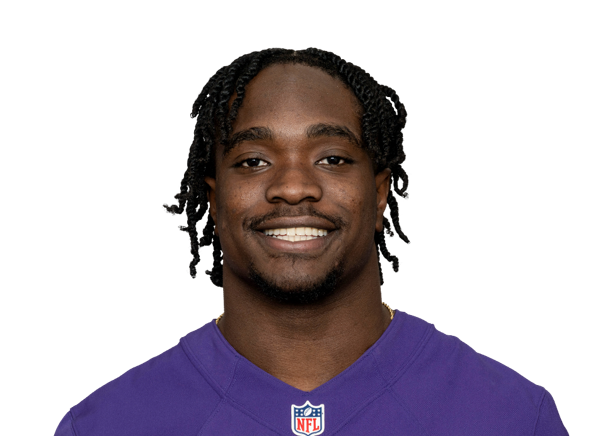 Chandler MartinLB$248K$248K · 1 yr left−10% snaps
15 contracts
Secondary $58.3M
Player2026 capPer yearPaid / playedGapSnaps
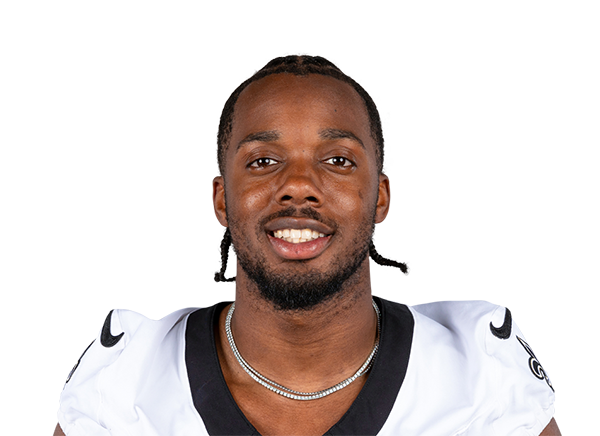 Paulson AdeboCB · injured$24.2M$18.0M · 2 yrs left−5614% snaps
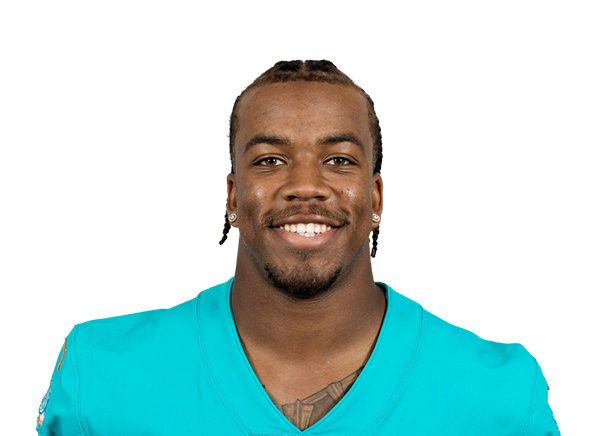 Jevon HollandS$12.7M$15.1M · 2 yrs left−988% snaps
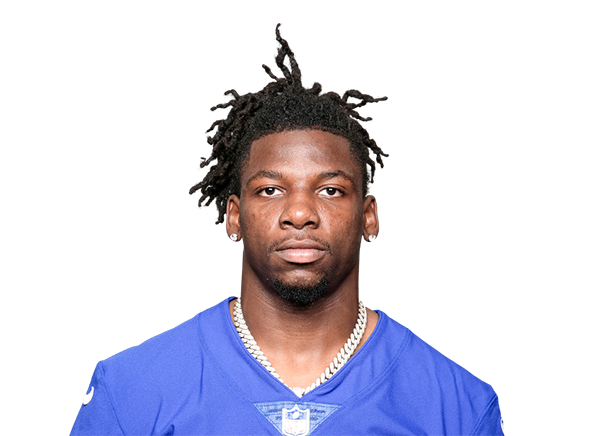 Deonte BanksCB$4.3M$3.4M · 1 yr left−374% snaps
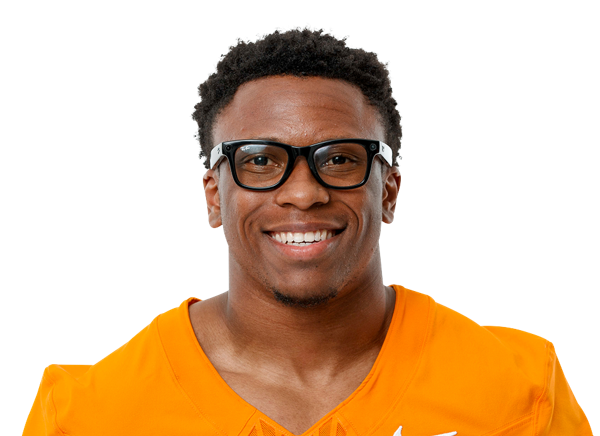 Colton HoodCB$3.2M$3.2M · 4 yrs left−2224% snaps
 Ar'Darius WashingtonS$2.6M$3.0M · 1 yr left−1236% snaps
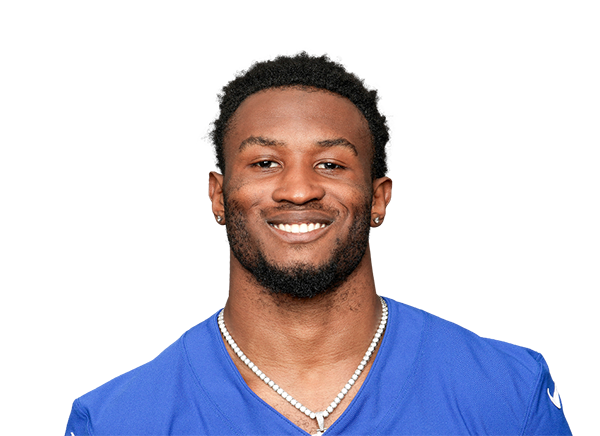 Tyler NubinS$2.2M$2.0M · 2 yrs left−541% snaps
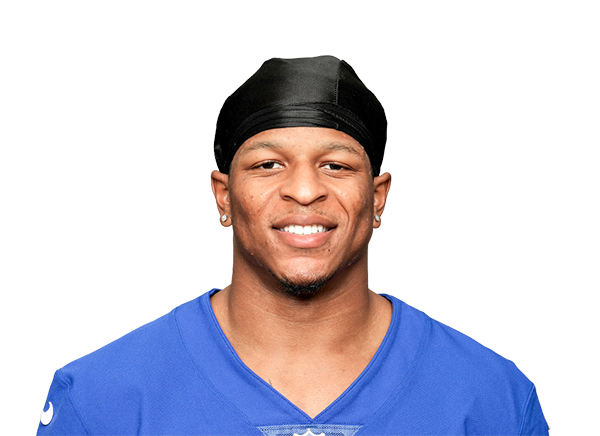 Dru PhillipsCB$1.6M$1.5M · 2 yrs left+2072% snaps
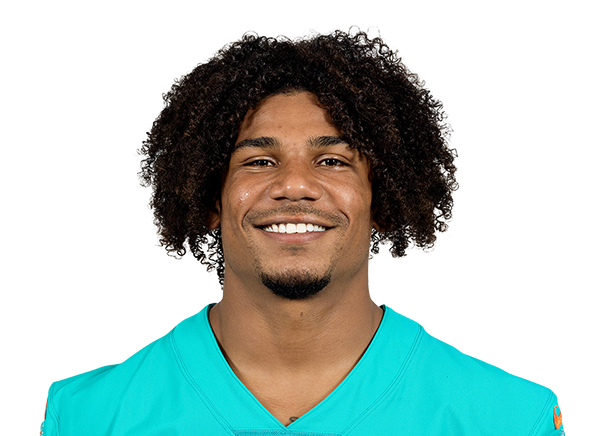 Elijah CampbellS$1.3M$1.4M · 1 yr left−440% snaps
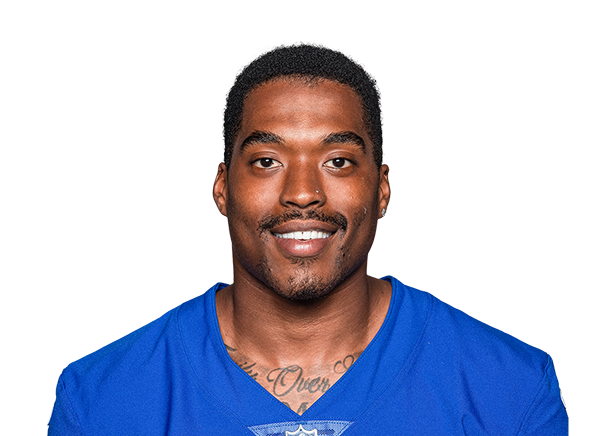 Jason PinnockS$1.3M$1.4M · 1 yr left+1539% snaps
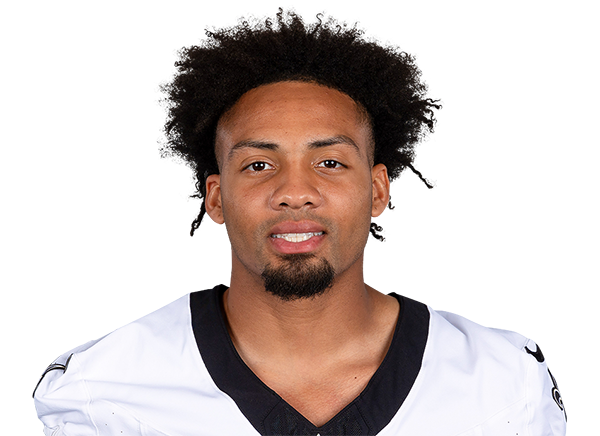 Rico PaytonCB · injured$1.1M$948K · 1 yr left−270% snaps
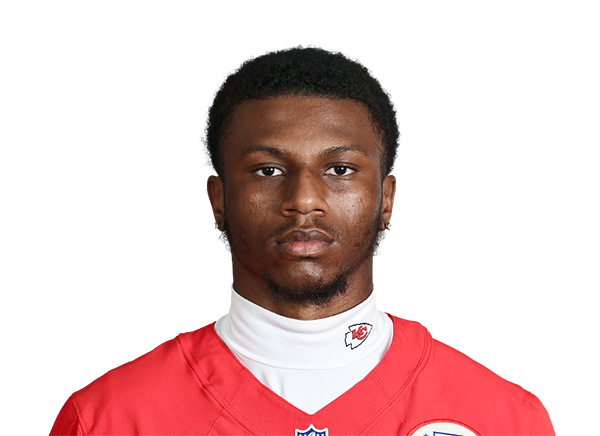 Nic JonesCB$1.1M$1.1M · 1 yr left+107% snaps
 Thaddeus DixonCB · injured$1.0M$1.0M · 3 yrs left−260% snaps
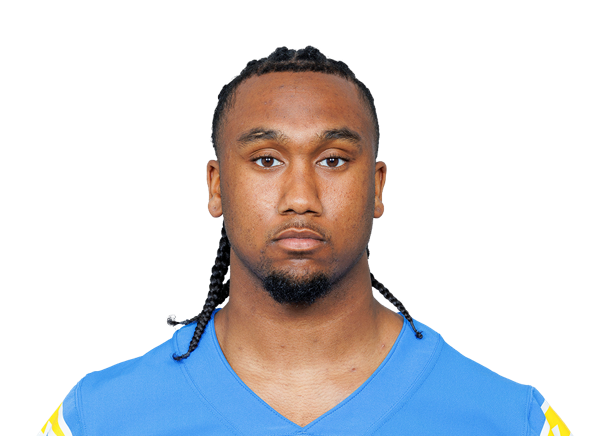 Nikko ReedCB$949K$1.0M · 1 yr left−200% snaps
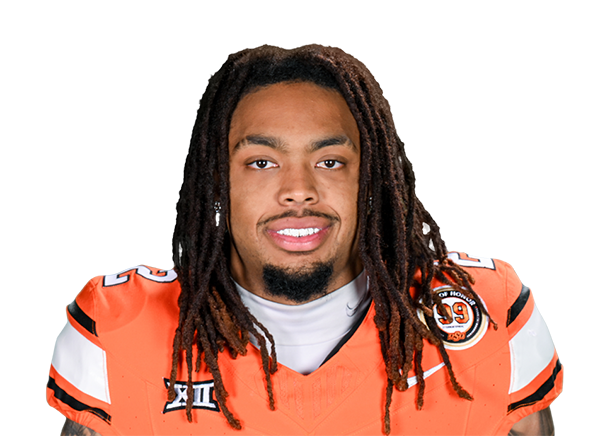 Korie BlackCB · injured$540K$923K · 1 yr left−150% snaps
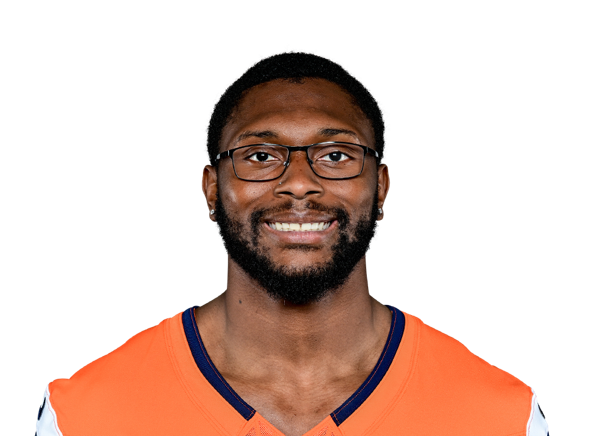 Jaden RobinsonCB$234K$248K · 1 yr left−50% snaps
3 contracts
Specialists $4.7M
Player2026 capPer yearPaid / playedGapSnaps
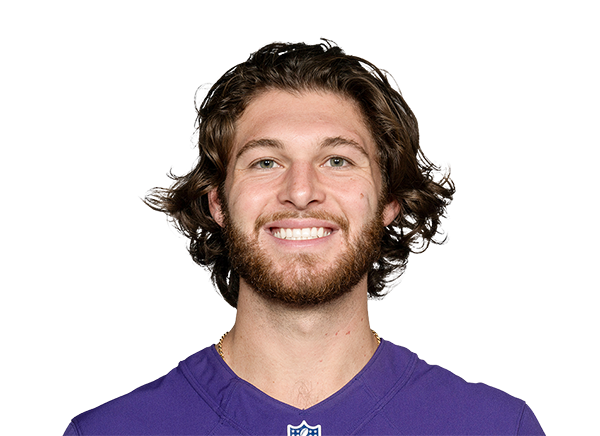 Jordan StoutP$2.7M$4.1M · 3 yrs left−4712% snaps
 Dominic ZvadaK$1.0M$1.0M · 3 yrs left+5114% snaps
 Ben MannLS$1.0M$1.0M · 3 yrs left+1612% snaps
Gold bar: where the player's pay ranks among his position group league-wide. Green bar: where his play ranks (EPA for skill players, share of snaps for everyone else). Gap = played minus paid, in percentile points.