 Pittsburgh SteelersAsked and Answered: Nov. 10
 New York GiantsGiants Now: Michael Strahan offers high praise of Arvell Reese
 Philadelphia EaglesAAA Official Review: What did the Eagles, Joe Milton learn from the QB's first start?
 Buffalo Bills'There's no panic' | The Bills stay strong through early struggles and injuries in MNF win over the Minnesota Vikings
 ESPNVikings left at QB crossroads after Carson Wentz's poor MNF showing vs. Bills
 Broncos DeskBroncos are 7-2, but the snaps say 4.1 wins and the 11th seed in the conference5 h ago
 Pro Football RumorsSeahawks Interested In Adding WR Depth
 InjuryCarl Granderson: Active → Cleared7 h ago
 ESPNCarson Beck next man up for Cardinals
The LabEvery contract against the field
 Cincinnati BengalsThe cap file
68 contracts count $270M against the 2026 cap. 84% of it belongs to players on the field, 8th of 32. $8.9M is injured and $33.2M is healthy but not playing. The biggest building: defensive line, $79.9M, 4th in the league.
↳Bottom line84% of the Bengals cap is on the field (8th of 32). The most money goes to defensive line: $79.9M, 4th in the league.
?How to read this chart
- The skyline above:
- one building per position group, as tall as the cap hit (this season's salary-cap charge) Bengals spend on it, on the same scale as every other team. Lit windows are the share of that money on players who are actually on the field; dark windows are injured or idle money.
- The cards below:
- the same money in numbers. The bar fills with the share on the field, and "in spend" ranks the team among all 32 for that group.
Quarterbacks$41.2M91% on the field · 7th in spend
Running backs$7.3M79% on the field · 26th in spend
Wide receivers$32.9M83% on the field · 10th in spend
Tight ends$13.7M76% on the field · 14th in spend
Offensive line$39.6M84% on the field · 22nd in spend
Defensive line$79.9M88% on the field · 4th in spend
Linebackers$7.4M45% on the field · 31st in spend
Secondary$40.4M80% on the field · 18th in spend
Specialists$7.1M100% on the field · 8th in spend
Best value on the roster
Earning more than they cost
↳Bottom lineBest value on the roster: Barrett Carter, played 99th and paid 47th among LBs.
?How to read the contract tables
- One row = one contract.
- 2026 cap hit, average per year and years left.
- Paid / played bars:
- the gold bar is where his pay ranks among players at his position across the league, the green bar where his play ranks (EPA, expected points added, for QB, RB, WR, TE; share of snaps for everyone else). Full bar = top of the league.
- Gap:
- played rank minus paid rank, in percentile points. Positive (green) means he gives more than he costs; negative (red) means the opposite.
3 contracts
Quarterbacks $41.2M
Player2026 capPer yearPaid / playedGapEPA
 Joe BurrowQB$37.6M$55.0M · 2 yrs left+6+77.3 EPA
 Joe FlaccoQB$3.3M$6.0M · 1 yr left−61+0.0 EPA
 Sean CliffordQB$248K$248K · 1 yr left−4+0.0 EPA
5 contracts
Running backs $7.3M

7 contracts
Wide receivers $32.9M
Player2026 capPer yearPaid / playedGapEPA
 Ja'Marr ChaseWR$26.2M$40.3M · 3 yrs left0+41.0 EPA
 Andrei IosivasWR · injured$3.7M$1000K · 1 yr left−40-8.7 EPA
 Colbie YoungWR$1.3M$1.3M · 4 yrs left−1-0.7 EPA
 Dohnte MeyersWR$1.0M$1.0M · 3 yrs left+40+6.4 EPA
 Jordan MooreWR$248K$248K · 1 yr left−7+0.0 EPA
 Noah ThomasWR$248K$248K · 1 yr left−7+0.0 EPA
 Ke'Shawn WilliamsWR$206K$248K · 1 yr left−4+0.0 EPA
6 contracts
Tight ends $13.7M
Player2026 capPer yearPaid / playedGapEPA
 Mike GesickiTE$7.6M$8.5M · 2 yrs left+3+19.2 EPA
 Drew SampleTE$2.9M$3.5M · 1 yr left+1+2.9 EPA
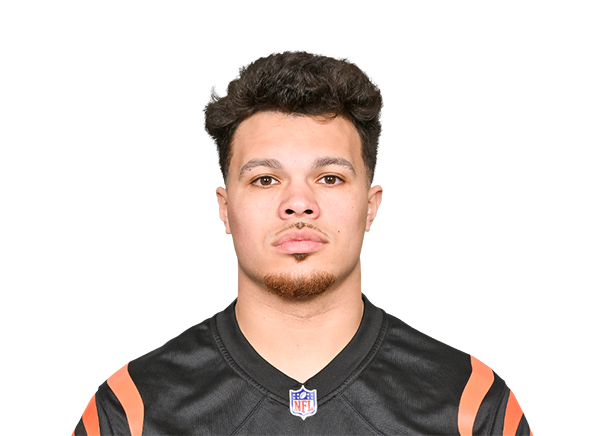 Erick All Jr.TE · injured$1.3M$1.2M · 2 yrs left+27+3.1 EPA
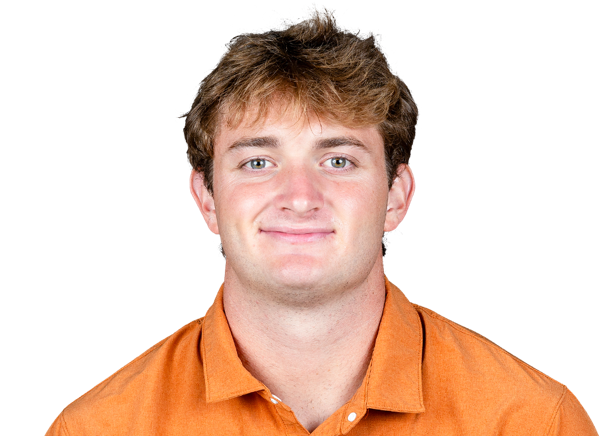 Jack EndriesTE$1.1M$1.1M · 4 yrs left+28+1.3 EPA
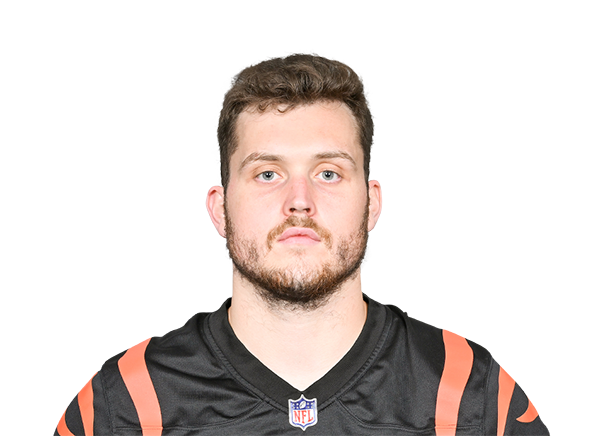 Cam GrandyTE$657K$1.1M · 1 yr left−20+0.0 EPA
 Josh KattusTE$248K$248K · 1 yr left−4+0.0 EPA
11 contracts
Offensive line $39.6M
Player2026 capPer yearPaid / playedGapSnaps
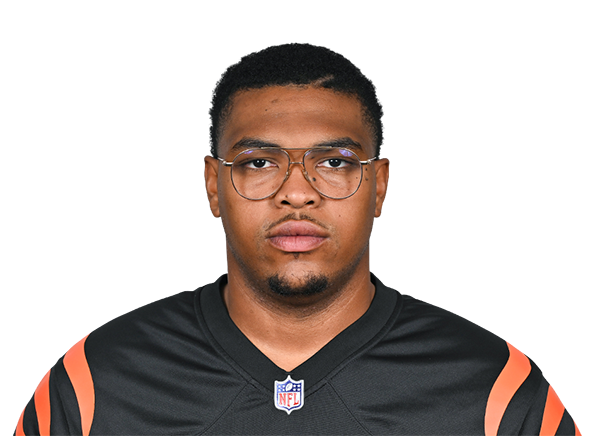 Orlando Brown Jr.LT$19.3M$16.0M · 2 yrs left−10100% snaps
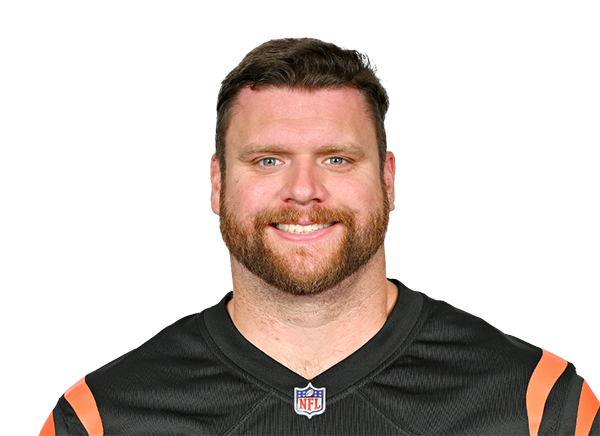 Ted KarrasC$4.5M$5.0M · final year+999% snaps
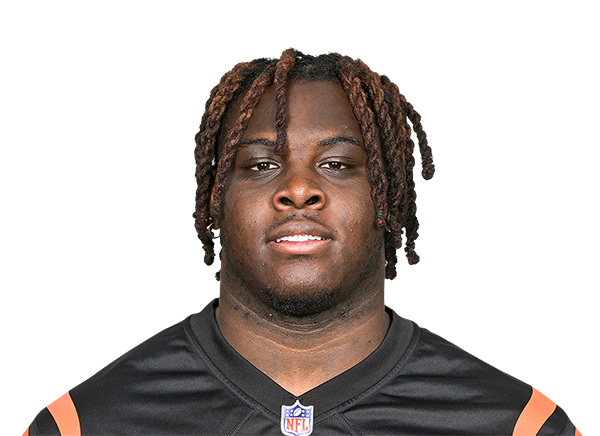 Amarius MimsRT$4.2M$3.8M · 2 yrs left+798% snaps
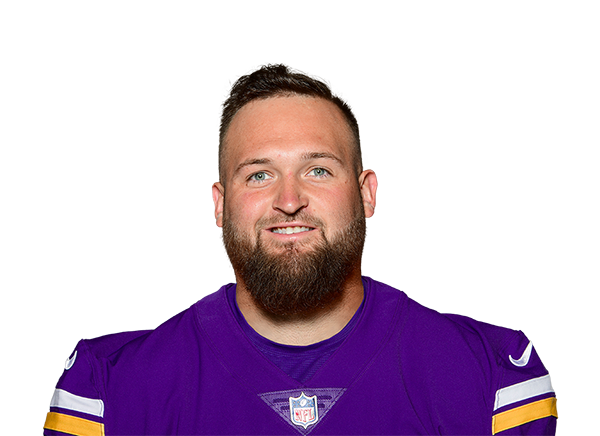 Dalton RisnerLG$3.7M$3.3M · 1 yr left+1599% snaps
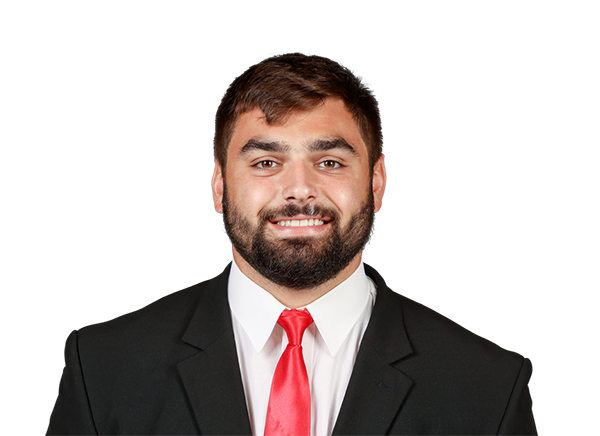 Dylan FairchildLG$1.5M$1.6M · 3 yrs left+34100% snaps
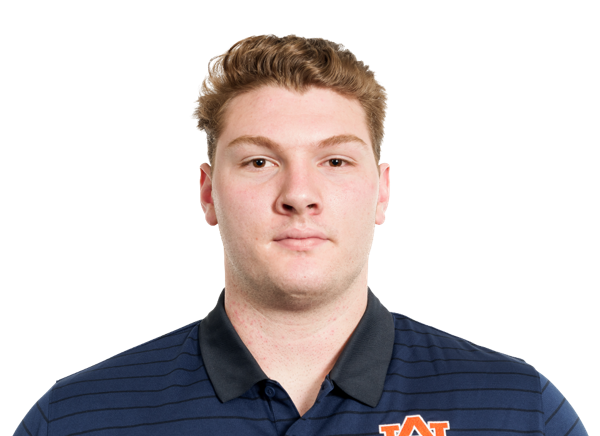 Connor LewC$1.4M$1.4M · 4 yrs left−480% snaps
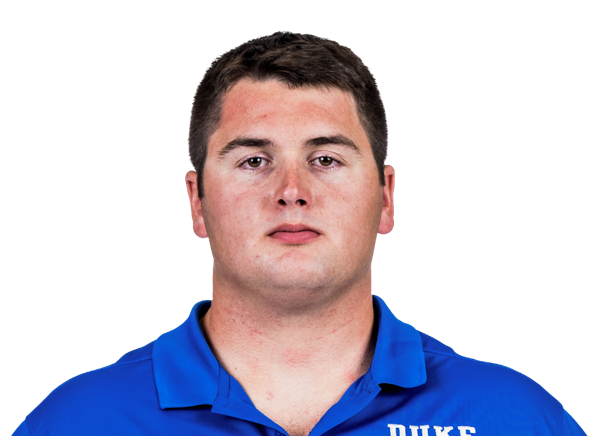 Brian Parker IIC · injured$1.2M$1.2M · 4 yrs left−400% snaps
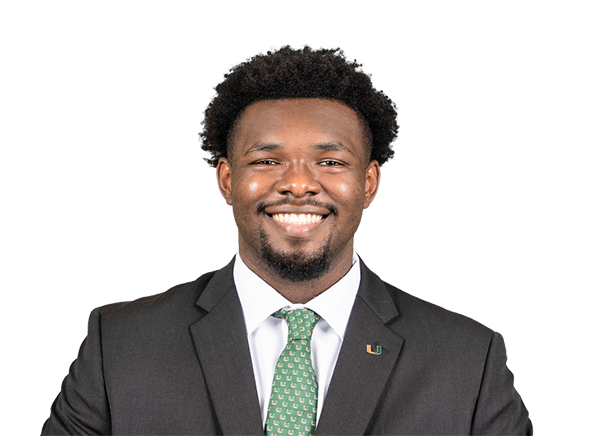 Jalen RiversLT$1.1M$1.2M · 3 yrs left01% snaps
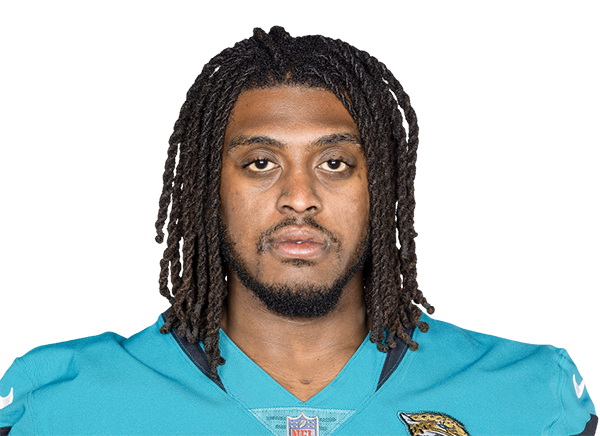 Javon FosterLT$1.0M$1.0M · 1 yr left+142% snaps
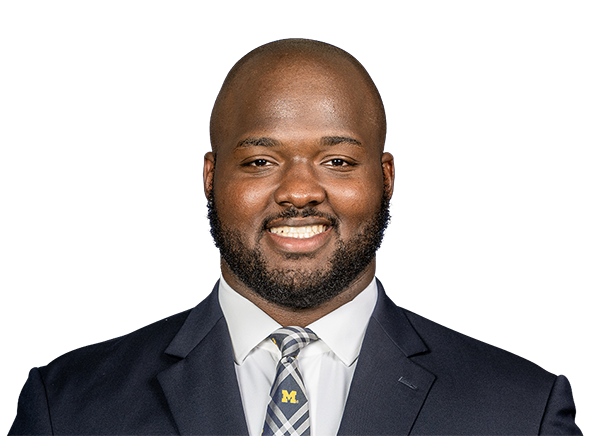 Myles HintonLT$885K$1.1M · 3 yrs left−210% snaps
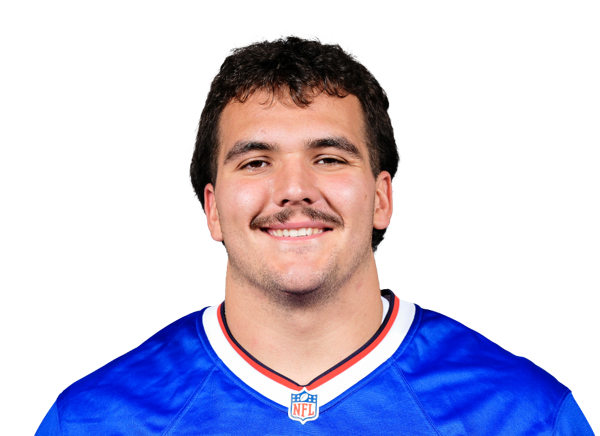 Jacob BayerC$885K$885K · 1 yr left+162% snaps
14 contracts
Defensive line $79.9M
Player2026 capPer yearPaid / playedGapSnaps
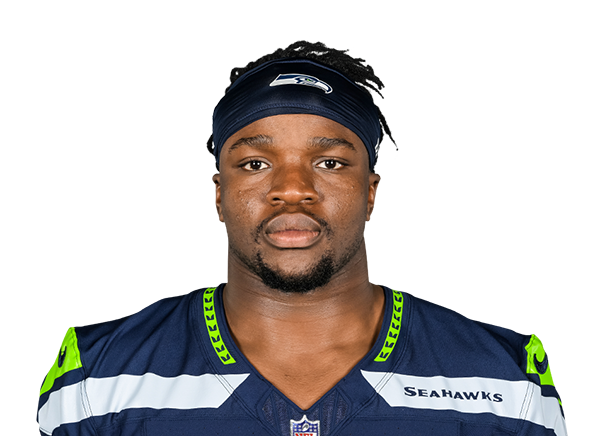 Boye MafeED$17.0M$20.0M · 3 yrs left076% snaps
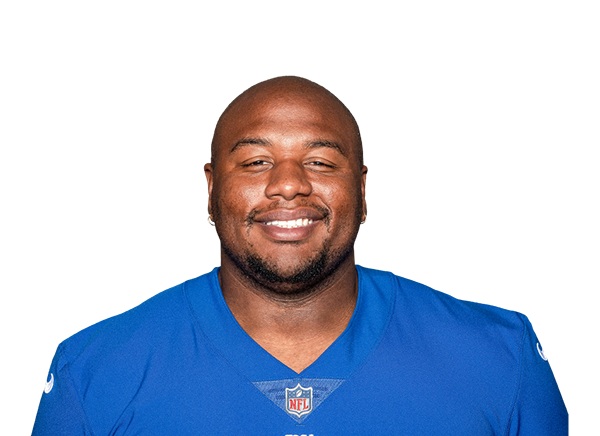 Dexter Lawrence IIIDL$15.3M$28.0M · 1 yr left−369% snaps
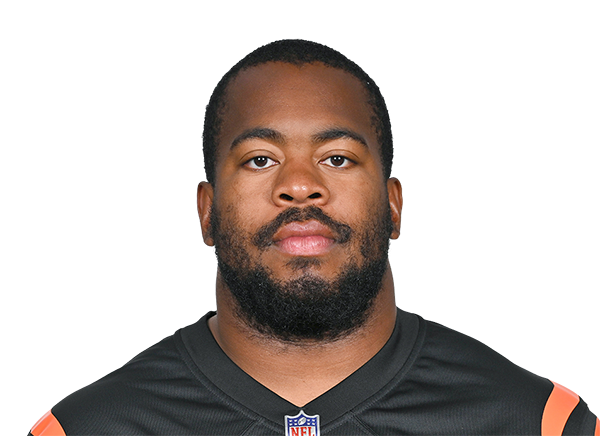 B.J. HillIDL$12.1M$11.0M · 2 yrs left−4128% snaps
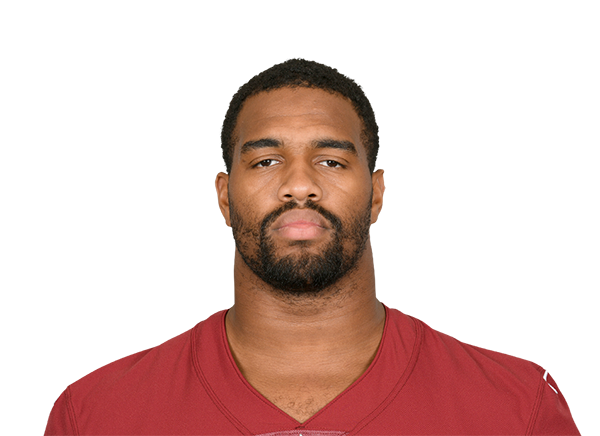 Jonathan AllenIDL$9.8M$12.5M · 2 yrs left−163% snaps
 T.J. Slaton Jr.IDL$9.2M$7.0M · 1 yr left−2933% snaps
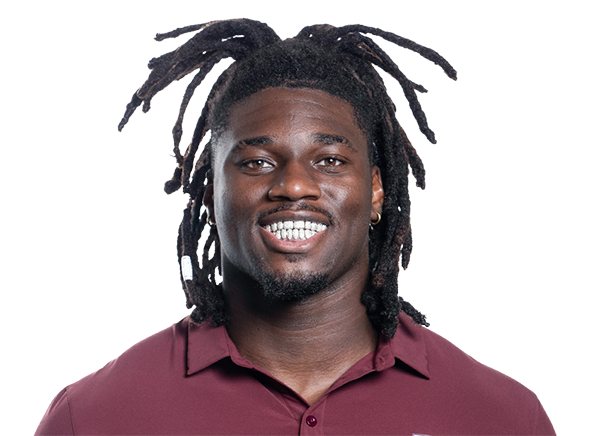 Shemar StewartED$4.3M$4.7M · 3 yrs left−406% snaps
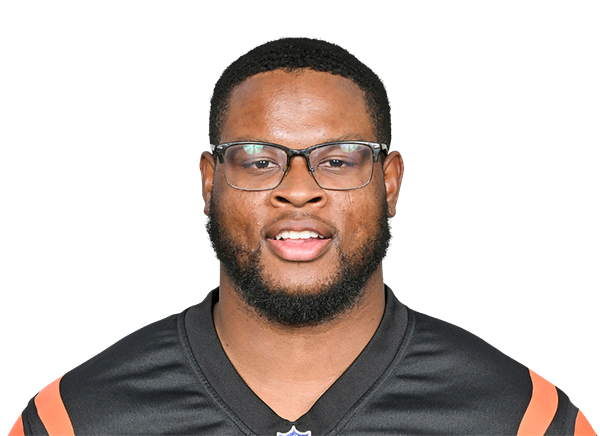 Myles MurphyED$4.0M$3.1M · 1 yr left+2069% snaps
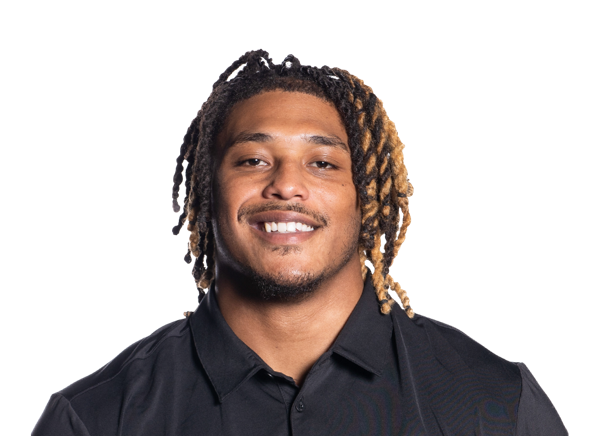 Cashius HowellED · injured$3.0M$3.0M · 4 yrs left−435% snaps
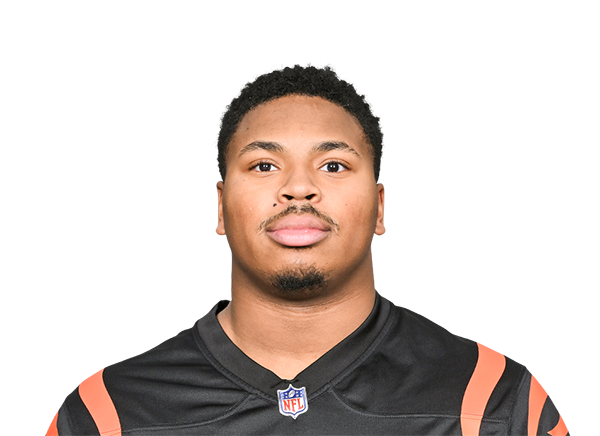 Kris Jenkins Jr.IDL$2.1M$2.0M · 2 yrs left−1122% snaps
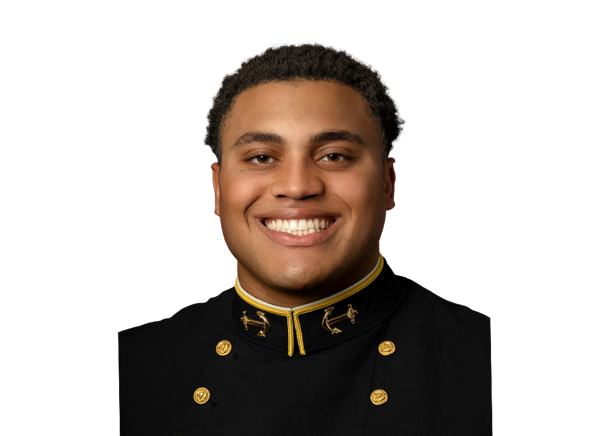 Landon RobinsonIDL$1.1M$1.1M · 4 yrs left−360% snaps
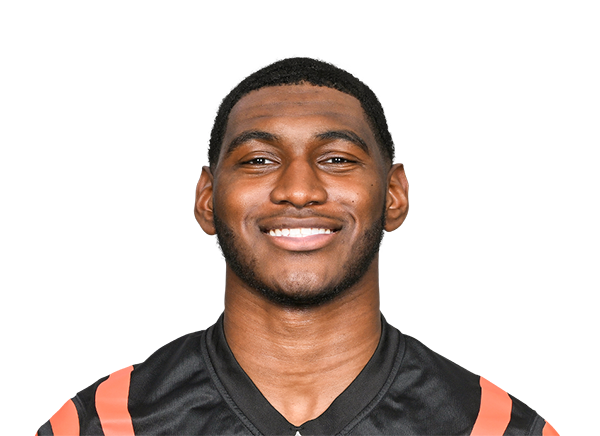 Cedric JohnsonED$1.1M$1.0M · 2 yrs left+1322% snaps
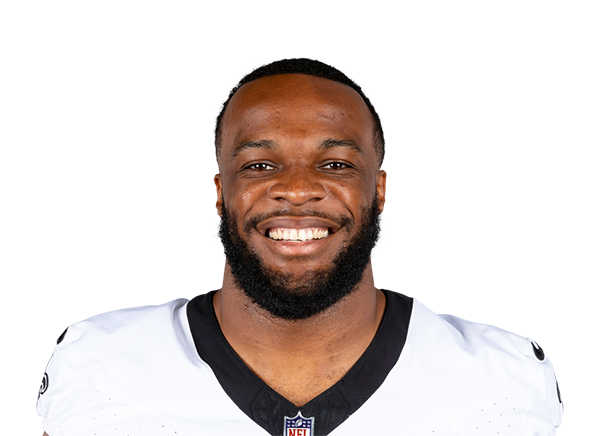 Isaiah FoskeyED$330K$330K · 1 yr left−150% snaps
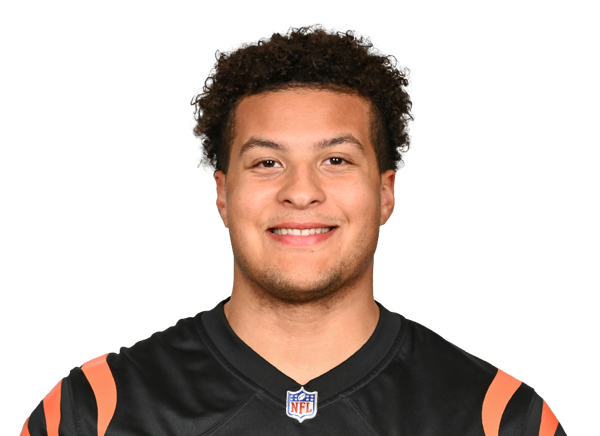 Howard Cross IIIIDL$248K$248K · 1 yr left−60% snaps
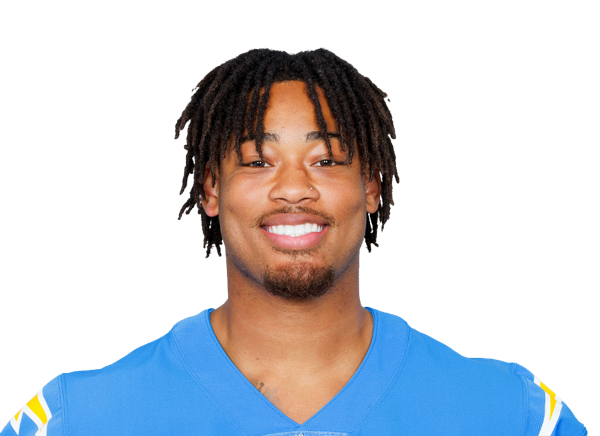 Garmon RandolphED$248K$248K · 1 yr left−60% snaps
5 contracts
Linebackers $7.4M
Player2026 capPer yearPaid / playedGapSnaps
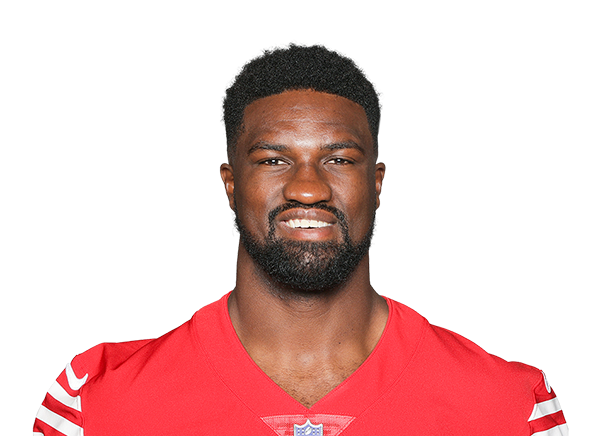 Oren BurksLB$2.7M$2.5M · 1 yr left−1911% snaps
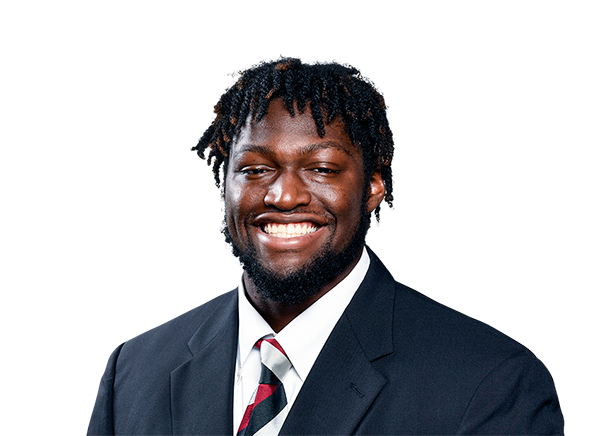 Demetrius Knight Jr.LB$2.0M$2.3M · 3 yrs left+1983% snaps
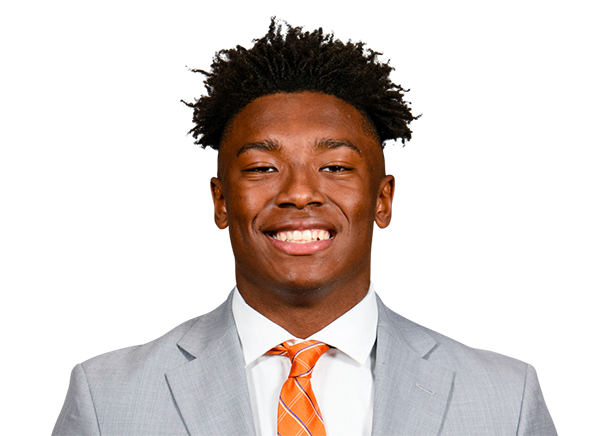 Barrett CarterLB$1.3M$1.3M · 3 yrs left+52100% snaps
 Jack KiserLB$726K$1.0M · 1 yr left+161% snaps
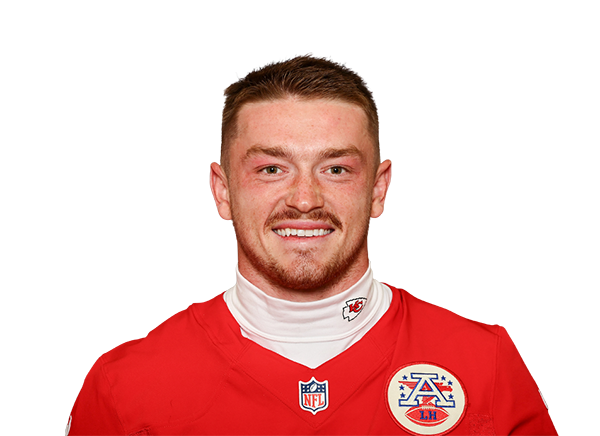 Swayze BozemanLB · injured$707K$1.1M · 1 yr left+110% snaps
14 contracts
Secondary $40.4M
Player2026 capPer yearPaid / playedGapSnaps
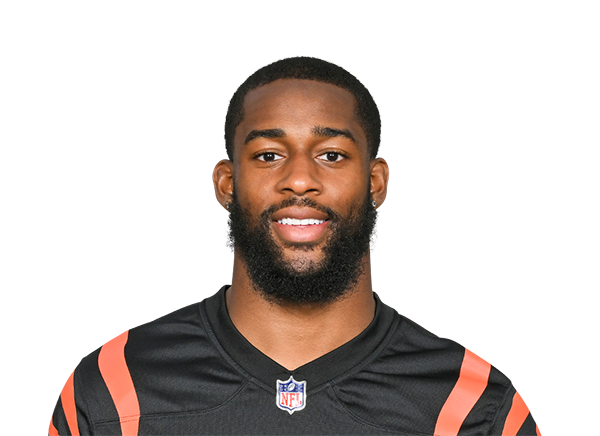 Dax HillCB$12.7M$2.9M · final year−297% snaps
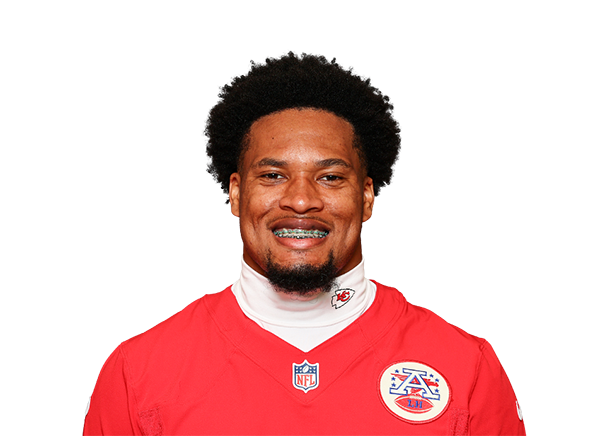 Bryan CookS$10.7M$13.4M · 3 yrs left−1280% snaps
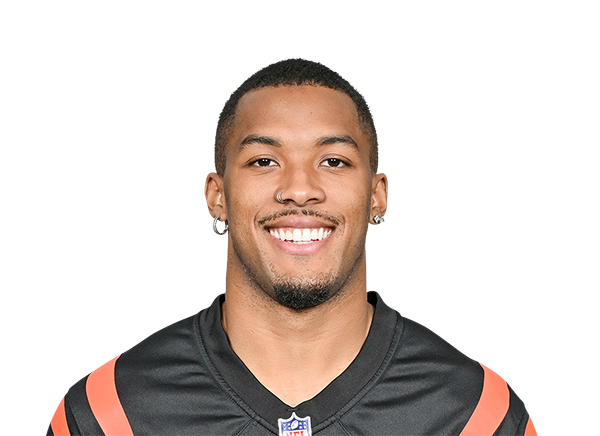 DJ Turner IICB$4.0M$1.5M · 1 yr left+1195% snaps
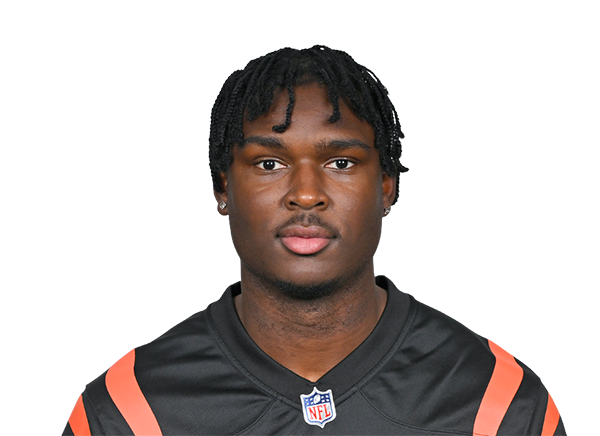 Jordan BattleS$3.9M$1.3M · 1 yr left+1999% snaps
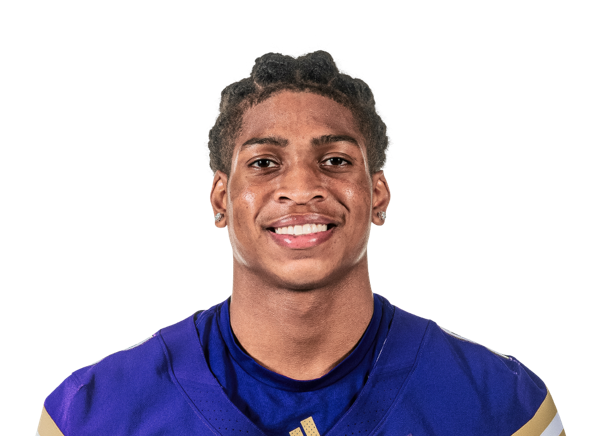 Tacario DavisCB$1.8M$1.8M · 4 yrs left−1913% snaps
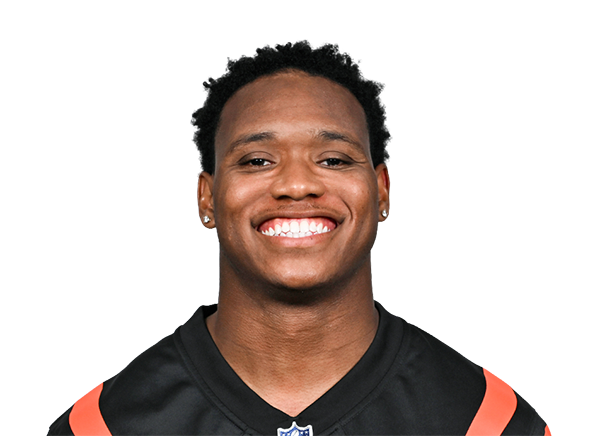 Jalen DavisCB · injured$1.5M$1.6M · 1 yr left−723% snaps
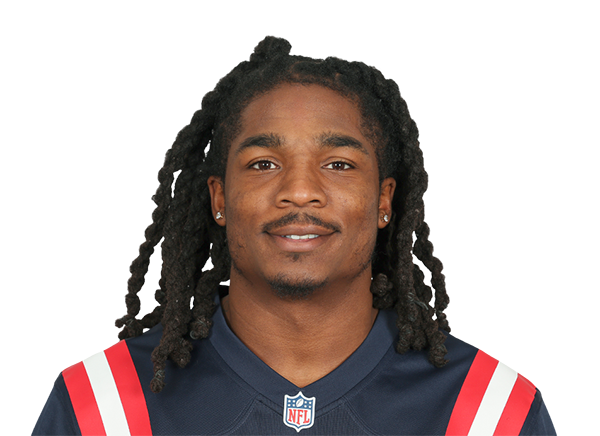 Kyle DuggerS$1.3M$1.4M · 1 yr left−78% snaps
 DJ IveyCB$1.2M$980K · 1 yr left+2037% snaps
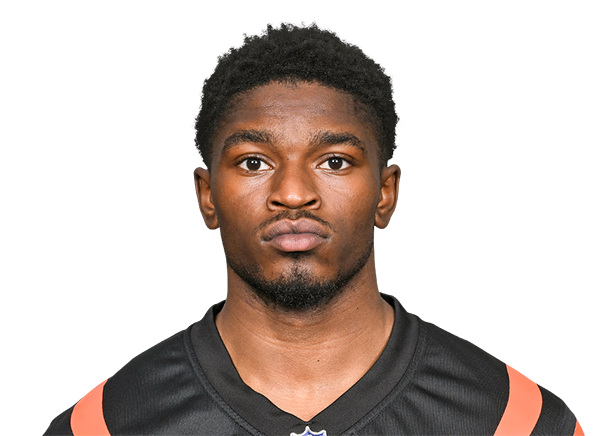 Josh NewtonCB$1.2M$1.1M · 2 yrs left+1224% snaps
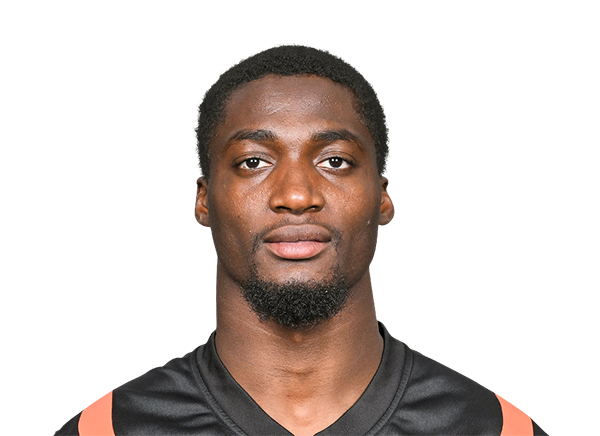 PJ JulesS$1.0M$1.0M · 1 yr left+179% snaps
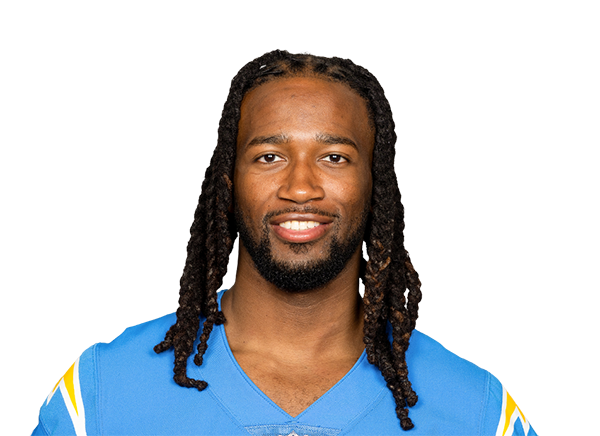 Ja'Sir TaylorCB · injured$565K$1.2M · 1 yr left−160% snaps
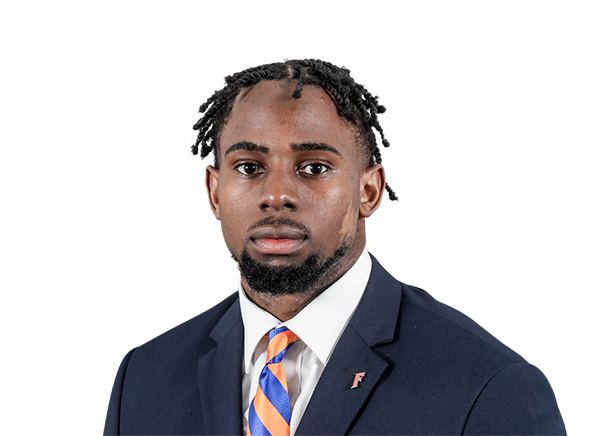 Trikweze BridgesS$248K$248K · 1 yr left−50% snaps
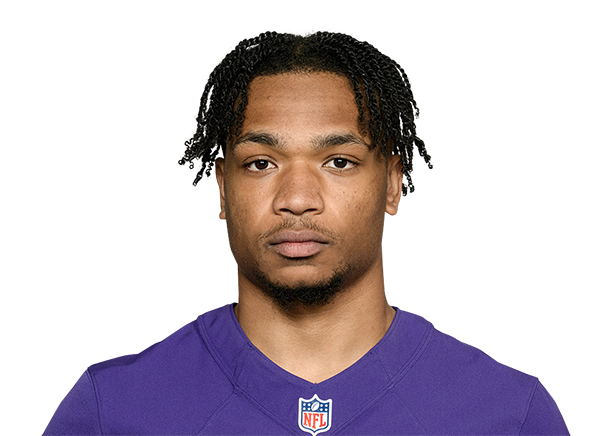 Beau BradeS$206K$248K · 1 yr left−30% snaps
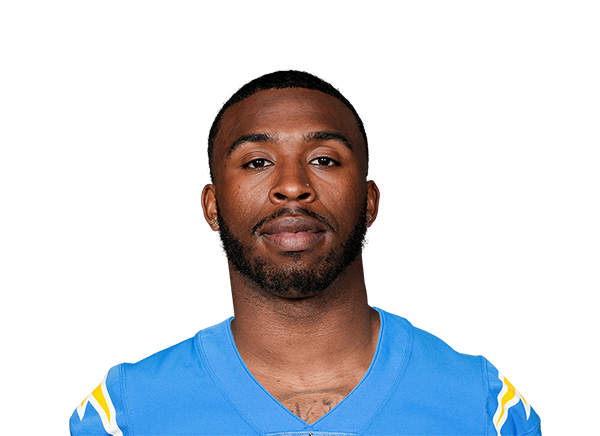 Emany JohnsonS$165K$248K · 1 yr left−10% snaps
3 contracts
Specialists $7.1M
Player2026 capPer yearPaid / playedGapSnaps
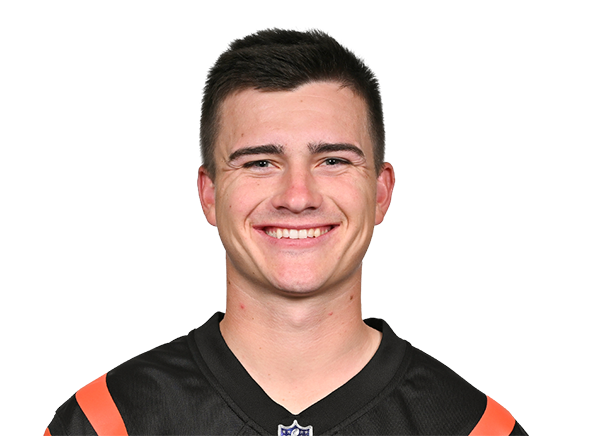 Evan McPhersonK$5.0M$5.5M · 1 yr left+218% snaps
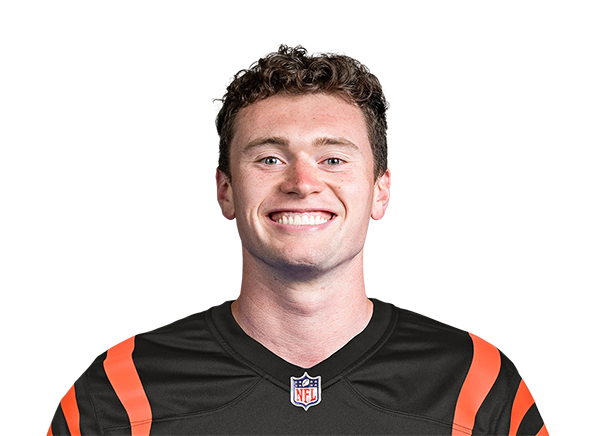 Ryan RehkowP$1.1M$1.0M · 1 yr left+1513% snaps
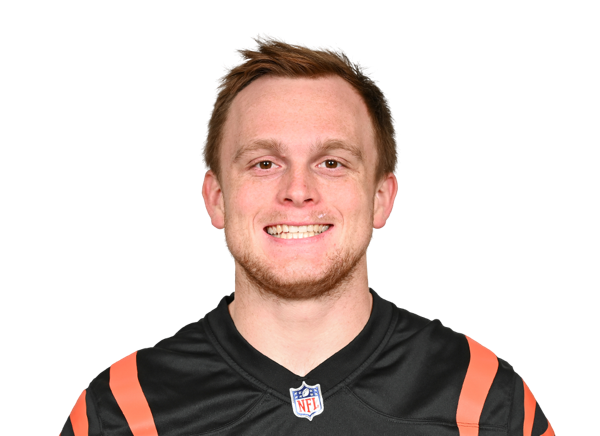 William WagnerLS$1.0M$992K · 2 yrs left+2813% snaps
Gold bar: where the player's pay ranks among his position group league-wide. Green bar: where his play ranks (EPA for skill players, share of snaps for everyone else). Gap = played minus paid, in percentile points.