 Pittsburgh SteelersAsked and Answered: Nov. 10
 New York GiantsGiants Now: Michael Strahan offers high praise of Arvell Reese
 Philadelphia EaglesAAA Official Review: What did the Eagles, Joe Milton learn from the QB's first start?
 Buffalo Bills'There's no panic' | The Bills stay strong through early struggles and injuries in MNF win over the Minnesota Vikings
 ESPNVikings left at QB crossroads after Carson Wentz's poor MNF showing vs. Bills
 Broncos DeskBroncos are 7-2, but the snaps say 4.1 wins and the 11th seed in the conference5 h ago
 Pro Football RumorsSeahawks Interested In Adding WR Depth
 InjuryCarl Granderson: Active → Cleared7 h ago
 ESPNCarson Beck next man up for Cardinals
The LabEvery contract against the field
 Las Vegas RaidersThe cap file
66 contracts count $250M against the 2026 cap. 80% of it belongs to players on the field, 17th of 32. $6.1M is injured and $43.4M is healthy but not playing. The biggest building: defensive line, $74.4M, 8th in the league.
↳Bottom line80% of the Raiders cap is on the field (17th of 32). The most money goes to defensive line: $74.4M, 8th in the league.
?How to read this chart
- The skyline above:
- one building per position group, as tall as the cap hit (this season's salary-cap charge) Raiders spend on it, on the same scale as every other team. Lit windows are the share of that money on players who are actually on the field; dark windows are injured or idle money.
- The cards below:
- the same money in numbers. The bar fills with the share on the field, and "in spend" ranks the team among all 32 for that group.
Quarterbacks$19.4M7% on the field · 15th in spend
Running backs$13.1M86% on the field · 11th in spend
Wide receivers$14.2M60% on the field · 30th in spend
Tight ends$12.6M98% on the field · 19th in spend
Offensive line$50.7M89% on the field · 14th in spend
Defensive line$74.4M92% on the field · 8th in spend
Linebackers$15.3M92% on the field · 17th in spend
Secondary$41.4M74% on the field · 17th in spend
Specialists$8.5M97% on the field · 3rd in spend
Best value on the roster
Earning more than they cost
↳Bottom lineBest value on the roster: Kirk Cousins, played 88th and paid 39th among QBs.
?How to read the contract tables
- One row = one contract.
- 2026 cap hit, average per year and years left.
- Paid / played bars:
- the gold bar is where his pay ranks among players at his position across the league, the green bar where his play ranks (EPA, expected points added, for QB, RB, WR, TE; share of snaps for everyone else). Full bar = top of the league.
- Gap:
- played rank minus paid rank, in percentile points. Positive (green) means he gives more than he costs; negative (red) means the opposite.
3 contracts
Quarterbacks $19.4M
Player2026 capPer yearPaid / playedGapEPA
 Fernando MendozaQB$14.3M$14.3M · 4 yrs left−18-1.7 EPA
 Aidan O'ConnellQB$3.8M$1.1M · 1 yr left−64+0.0 EPA
 Kirk CousinsQB$1.3M$11.3M · 1 yr left+49+29.5 EPA
6 contracts
Running backs $13.1M
Player2026 capPer yearPaid / playedGapEPA
 Ashton JeantyRB$8.2M$9.0M · 3 yrs left−67-30.5 EPA
 Connor HeywardFB$1.7M$2.3M · 2 yrs left+29+6.1 EPA
 Mike Washington Jr.RB$1.4M$1.4M · 4 yrs left−23-13.8 EPA
 Dylan LaubeRB$1.1M$1.0M · 2 yrs left+36-1.1 EPA
 Chris CollierRB · injured$540K$1.0M · 1 yr left−16+0.0 EPA
 Owen WrightRB$206K$248K · 1 yr left−2+0.0 EPA
6 contracts
Wide receivers $14.2M
Player2026 capPer yearPaid / playedGapEPA
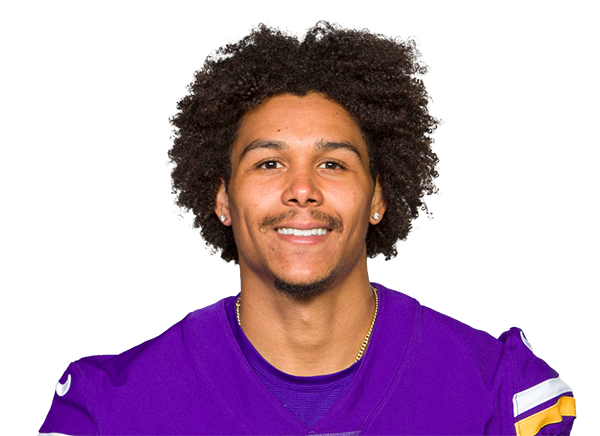 Jalen NailorWR$4.6M$11.7M · 3 yrs left−38-2.5 EPA
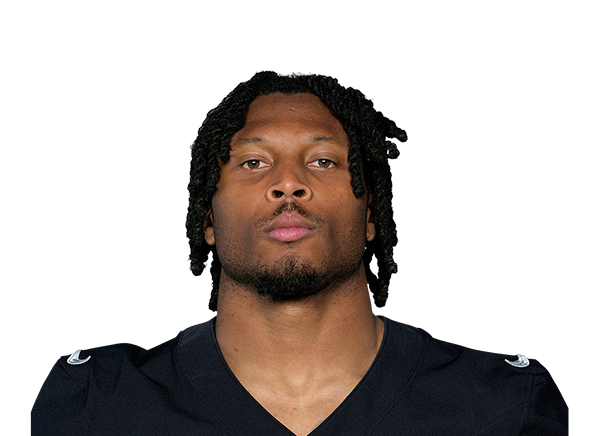 Tre TuckerWR$3.9M$1.3M · 1 yr left+6+10.0 EPA
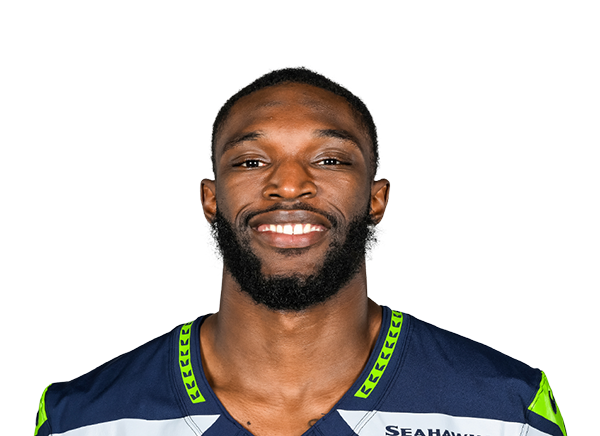 Dareke YoungWR$1.8M$1.8M · 1 yr left+1+1.6 EPA
 Jack BechWR$1.7M$1.9M · 3 yrs left−13-1.2 EPA
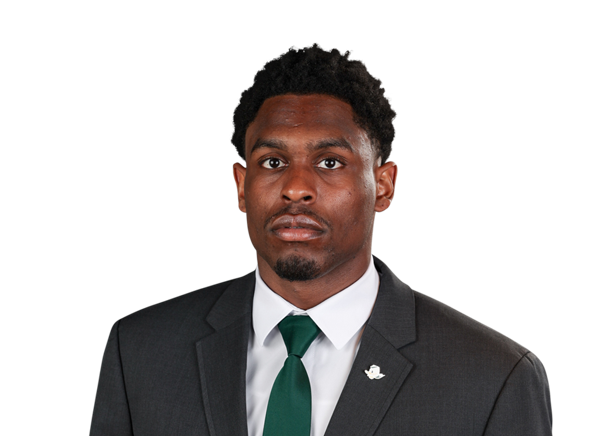 Malik BensonWR$1.2M$1.2M · 4 yrs left−8-8.7 EPA
 Dont'e Thornton Jr.WR$1.1M$1.3M · 3 yrs left−39+0.0 EPA
4 contracts
Tight ends $12.6M

12 contracts
Offensive line $50.7M
Player2026 capPer yearPaid / playedGapSnaps
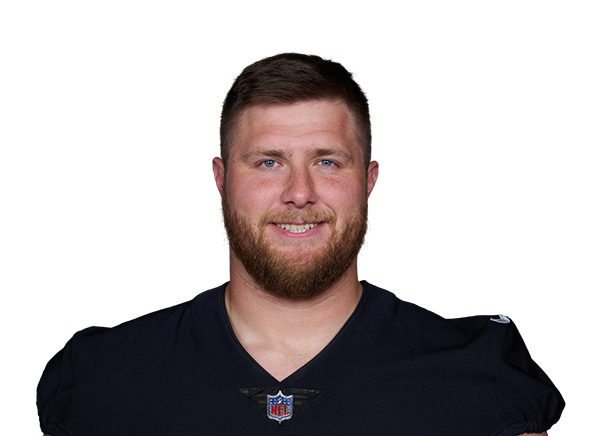 Kolton MillerLT$22.5M$22.0M · 2 yrs left−11100% snaps
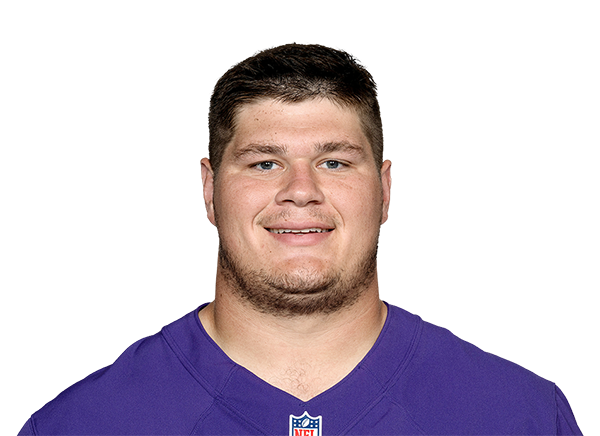 Tyler LinderbaumC$14.0M$27.0M · 3 yrs left−6100% snaps
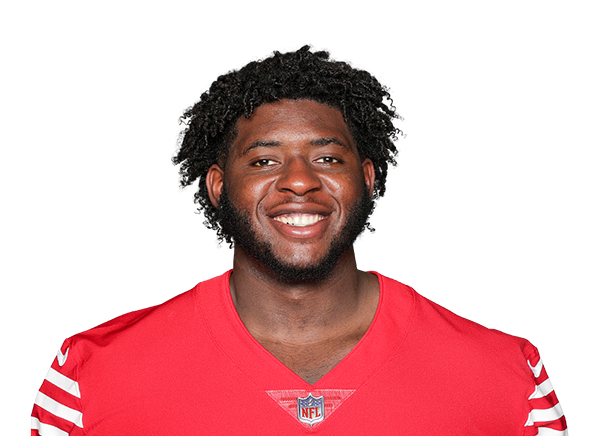 Spencer BurfordRG$3.1M$3.3M · 1 yr left+22100% snaps
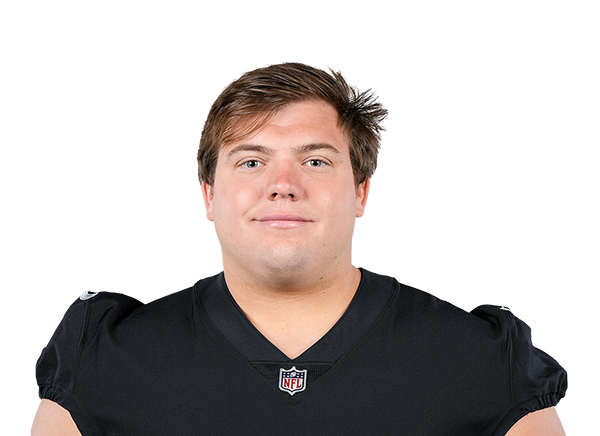 Jackson Powers-JohnsonRG$2.4M$2.2M · 2 yrs left−143% snaps
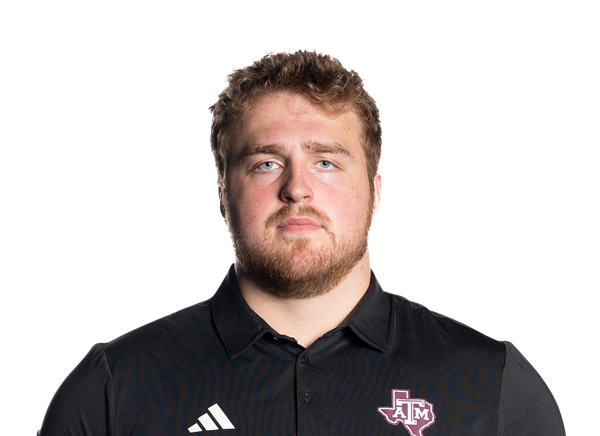 Trey Zuhn IIIC$1.7M$1.7M · 4 yrs left−619% snaps
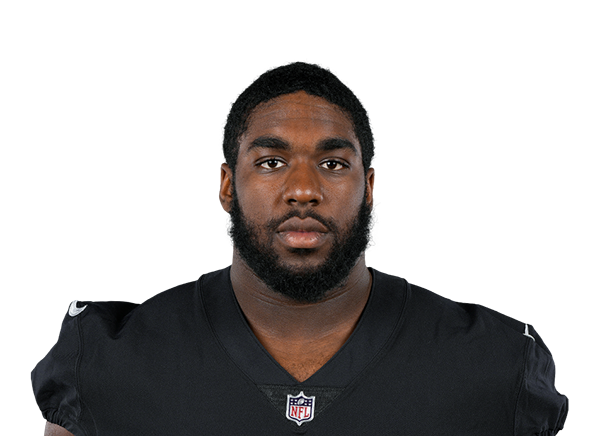 DJ GlazeRT$1.6M$1.5M · 2 yrs left+33100% snaps
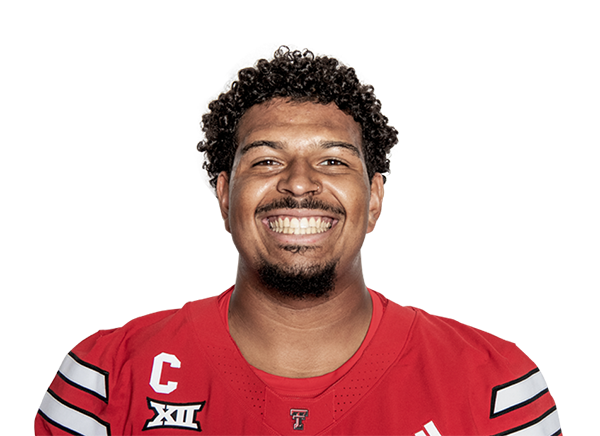 Caleb RogersRT$1.4M$1.5M · 3 yrs left+1041% snaps
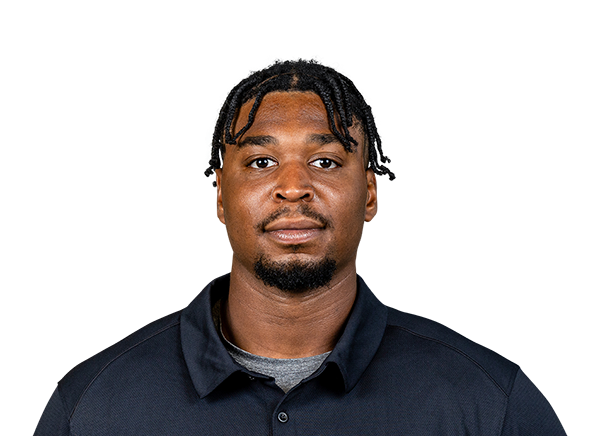 Charles GrantLT$1.4M$1.5M · 3 yrs left−500% snaps
 Justin PickettRG · injured$1.0M$1.0M · 3 yrs left−280% snaps
 Bryce CabeldueRT$1.0M$1.1M · 3 yrs left−230% snaps
 Will PutnamC$248K$248K · 1 yr left−40% snaps
 Niklas HenningLT$248K$248K · 1 yr left−40% snaps
13 contracts
Defensive line $74.4M
Player2026 capPer yearPaid / playedGapSnaps
 Maxx CrosbyED$35.8M$35.5M · 2 yrs left−189% snaps
 Malcolm KoonceED$11.0M$11.0M · 1 yr left−2543% snaps
 Kwity PayeED$9.4M$16.0M · 3 yrs left−360% snaps
 Adam ButlerIDL$6.6M$5.5M · 2 yrs left−553% snaps
 Thomas Booker IVIDL$3.7M$3.7M · 1 yr left−1429% snaps
 Keyron CrawfordED · injured$1.8M$1.8M · 4 yrs left−540% snaps
 Tonka HemingwayIDL$1.2M$1.2M · 3 yrs left+2339% snaps
 Folorunso FatukasiIDL$1.1M$1.3M · 1 yr left+3945% snaps
 Patrick JohnsonED · injured$1.1M$1.2M · 1 yr left+35% snaps
 Brennan JacksonED · injured$1.1M$1.1M · 2 yrs left−280% snaps
 JJ PeguesIDL$1.1M$1.1M · 3 yrs left+46% snaps
 Azeez OjulariED$411K$411K · 1 yr left−160% snaps
 Brandon ClevelandIDL$248K$248K · 1 yr left−60% snaps
5 contracts
Linebackers $15.3M


13 contracts
Secondary $41.4M
Player2026 capPer yearPaid / playedGapSnaps
 Jeremy ChinnS$9.6M$8.1M · 1 yr left+7100% snaps
 Taron JohnsonCB$8.7M$10.3M · 1 yr left−1274% snaps
 Eric StokesCB$6.7M$10.0M · 3 yrs left+798% snaps
 Isaiah Pola-MaoS$4.9M$3.7M · 1 yr left−3619% snaps
 Treydan StukesS$3.1M$3.1M · 4 yrs left+1182% snaps
 Darien PorterCB$1.5M$1.7M · 3 yrs left+239% snaps
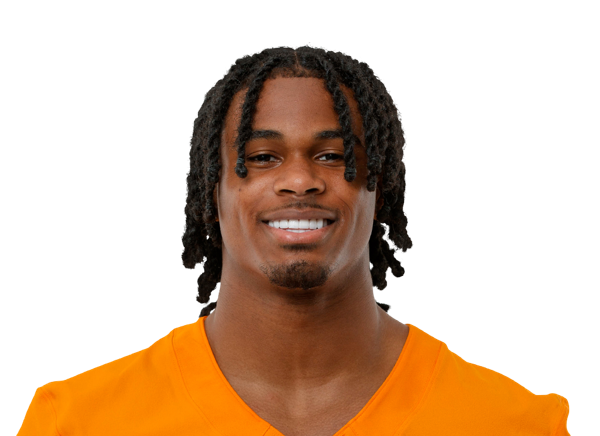 Jermod McCoyCB$1.5M$1.5M · 4 yrs left−1015% snaps
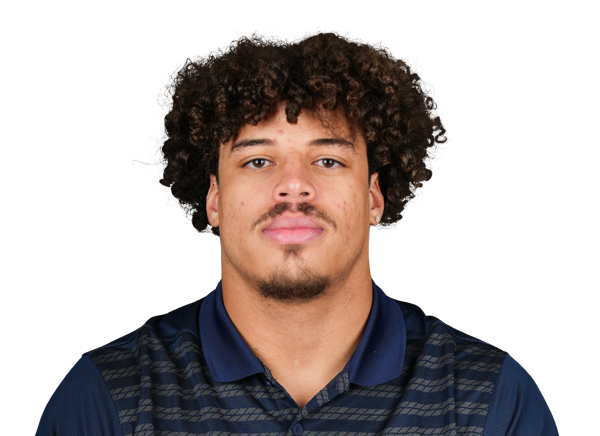 Dalton JohnsonS$1.2M$1.2M · 4 yrs left−420% snaps
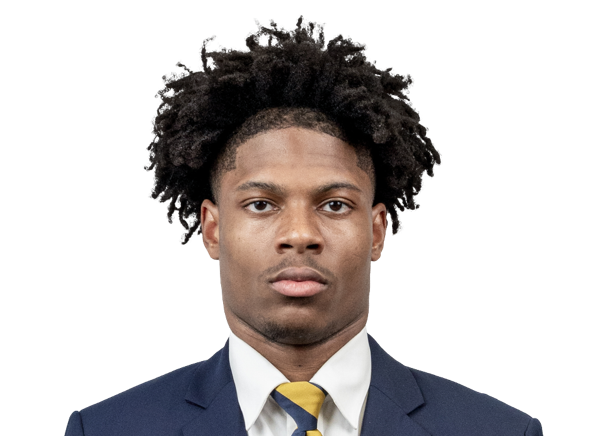 Hezekiah MassesCB$1.2M$1.2M · 4 yrs left+2650% snaps
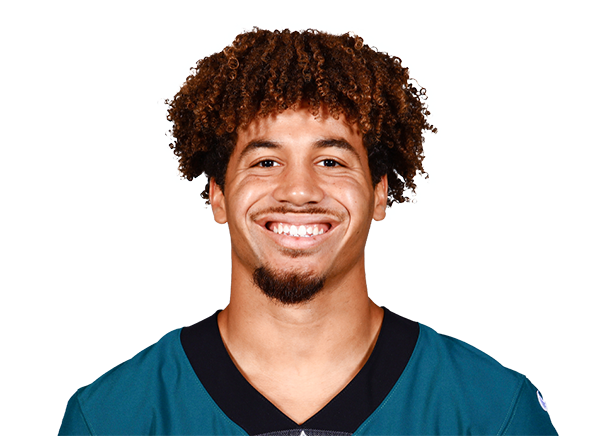 Tristin McCollumCB$1.1M$1.1M · 1 yr left−340% snaps
 Darrell Luter Jr.CB$1.1M$1.0M · 1 yr left−340% snaps
 Chigozie AnusiemCB · injured$565K$1.0M · 1 yr left−160% snaps
 Greedy VanceCB$248K$248K · 1 yr left−50% snaps
4 contracts
Specialists $8.5M

Gold bar: where the player's pay ranks among his position group league-wide. Green bar: where his play ranks (EPA for skill players, share of snaps for everyone else). Gap = played minus paid, in percentile points.