 Pittsburgh SteelersAsked and Answered: Nov. 10
 New York GiantsGiants Now: Michael Strahan offers high praise of Arvell Reese
 Philadelphia EaglesAAA Official Review: What did the Eagles, Joe Milton learn from the QB's first start?
 Buffalo Bills'There's no panic' | The Bills stay strong through early struggles and injuries in MNF win over the Minnesota Vikings
 ESPNVikings left at QB crossroads after Carson Wentz's poor MNF showing vs. Bills
 Broncos DeskBroncos are 7-2, but the snaps say 4.1 wins and the 11th seed in the conference5 h ago
 Pro Football RumorsSeahawks Interested In Adding WR Depth
 InjuryCarl Granderson: Active → Cleared7 h ago
 ESPNCarson Beck next man up for Cardinals
The LabEvery contract against the field
 Carolina PanthersThe cap file
68 contracts count $278M against the 2026 cap. 74% of it belongs to players on the field, 24th of 32. $50.8M is injured and $20.7M is healthy but not playing. The biggest building: offensive line, $97.4M, 1st in the league.
↳Bottom line74% of the Panthers cap is on the field (24th of 32). The most money goes to offensive line: $97.4M, 1st in the league.
?How to read this chart
- The skyline above:
- one building per position group, as tall as the cap hit (this season's salary-cap charge) Panthers spend on it, on the same scale as every other team. Lit windows are the share of that money on players who are actually on the field; dark windows are injured or idle money.
- The cards below:
- the same money in numbers. The bar fills with the share on the field, and "in spend" ranks the team among all 32 for that group.
Quarterbacks$17.1M71% on the field · 19th in spend
Running backs$12.4M60% on the field · 14th in spend
Wide receivers$14.9M62% on the field · 29th in spend
Tight ends$12.6M81% on the field · 20th in spend
Offensive line$97.4M55% on the field · 1st in spend
Defensive line$60.5M90% on the field · 11th in spend
Linebackers$10.3M81% on the field · 28th in spend
Secondary$49.2M96% on the field · 10th in spend
Specialists$3.9M100% on the field · 20th in spend
Best value on the roster
Earning more than they cost
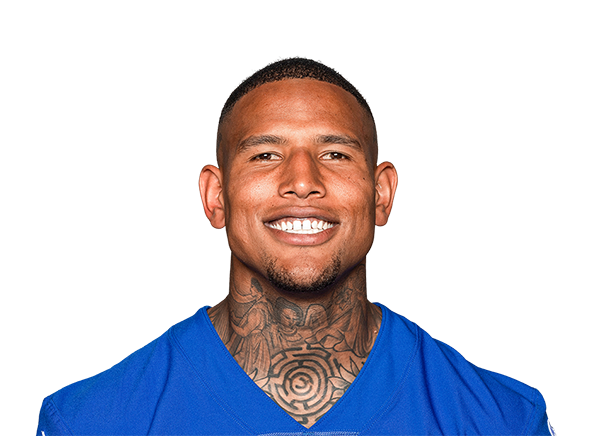

↳Bottom lineBest value on the roster: Darren Waller, played 91st and paid 28th among TEs.
?How to read the contract tables
- One row = one contract.
- 2026 cap hit, average per year and years left.
- Paid / played bars:
- the gold bar is where his pay ranks among players at his position across the league, the green bar where his play ranks (EPA, expected points added, for QB, RB, WR, TE; share of snaps for everyone else). Full bar = top of the league.
- Gap:
- played rank minus paid rank, in percentile points. Positive (green) means he gives more than he costs; negative (red) means the opposite.
3 contracts
Quarterbacks $17.1M
Player2026 capPer yearPaid / playedGapEPA
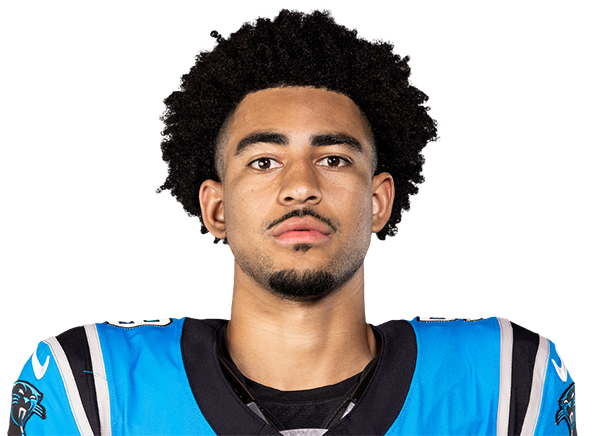 Bryce YoungQB$12.1M$9.5M · 1 yr left+1+14.9 EPA
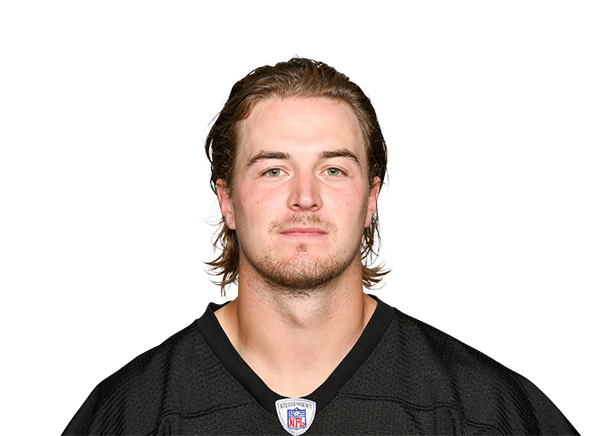 Kenny PickettQB$4.0M$4.0M · 1 yr left+10+3.6 EPA
 Haynes KingQB$1.0M$1.0M · 3 yrs left−22+0.0 EPA
5 contracts
Running backs $12.4M
7 contracts
Wide receivers $14.9M
Player2026 capPer yearPaid / playedGapEPA
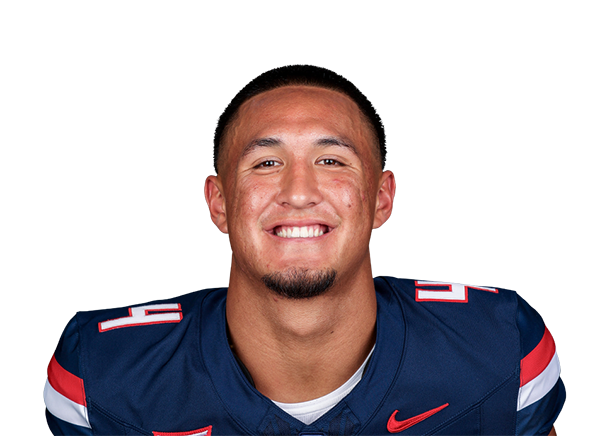 Tetairoa McMillanWR$6.3M$7.0M · 3 yrs left+12+27.0 EPA
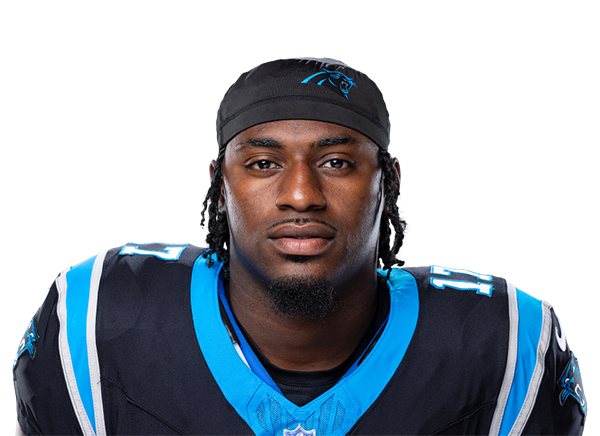 Xavier LegetteWR · injured$3.4M$3.1M · 2 yrs left−10+2.1 EPA
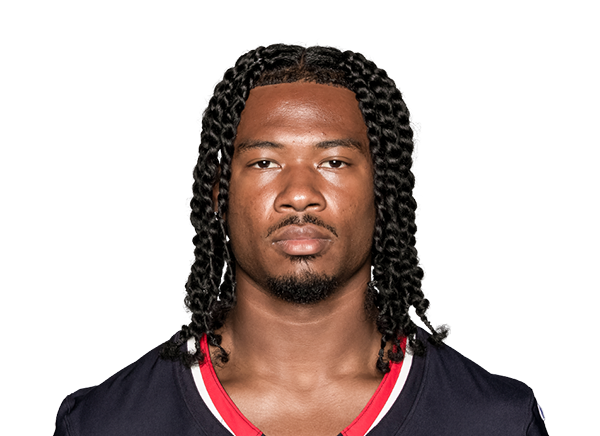 John Metchie IIIWR$1.9M$1.9M · 1 yr left+20+9.9 EPA
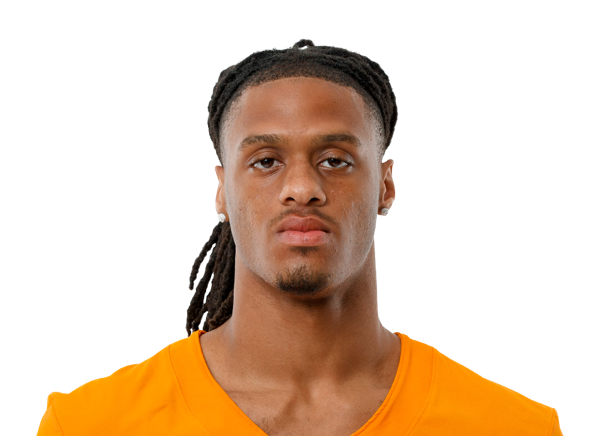 Chris Brazzell IIWR · injured$1.7M$1.7M · 4 yrs left−59+0.0 EPA
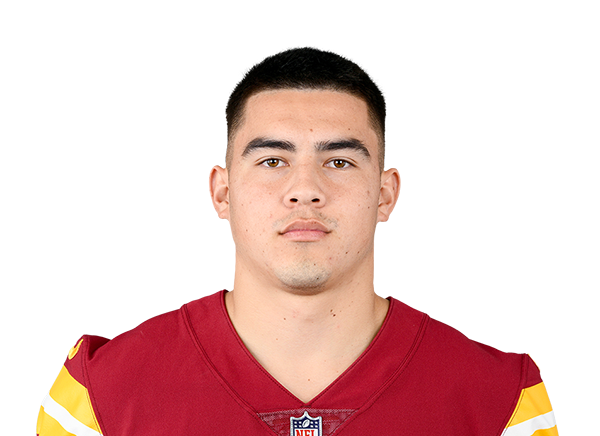 Brycen TremayneWR$1.0M$1.0M · 1 yr left+38+4.0 EPA
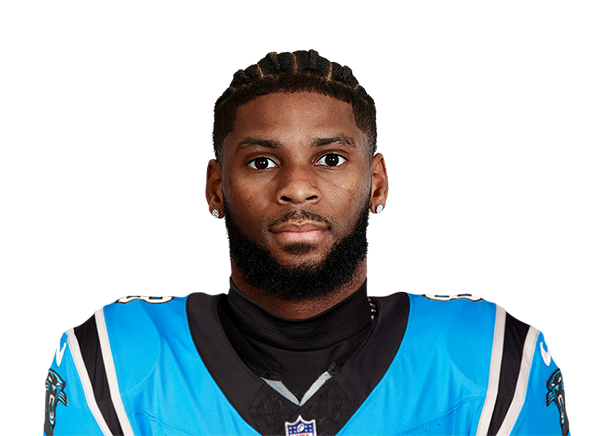 Ihmir Smith-MarsetteWR$294K$330K · 1 yr left−22+0.0 EPA
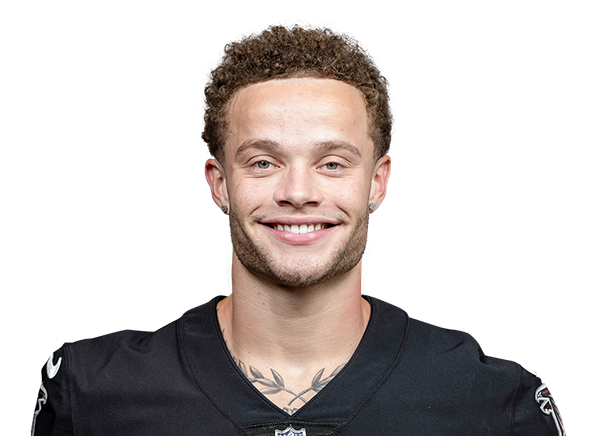 Casey WashingtonWR$248K$248K · 1 yr left−7+0.0 EPA
5 contracts
Tight ends $12.6M

12 contracts
Offensive line $97.4M
Player2026 capPer yearPaid / playedGapSnaps
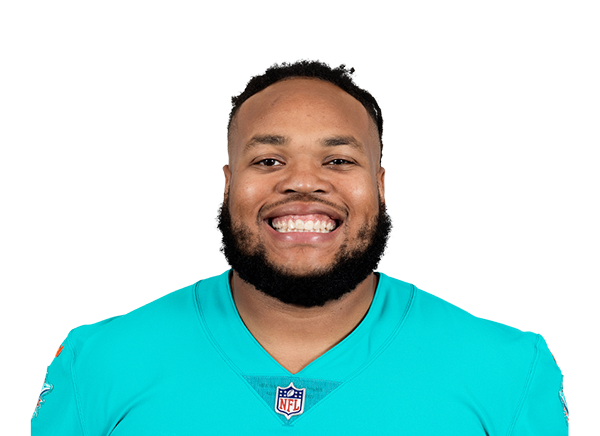 Robert HuntRG$24.3M$20.0M · 3 yrs left−1999% snaps
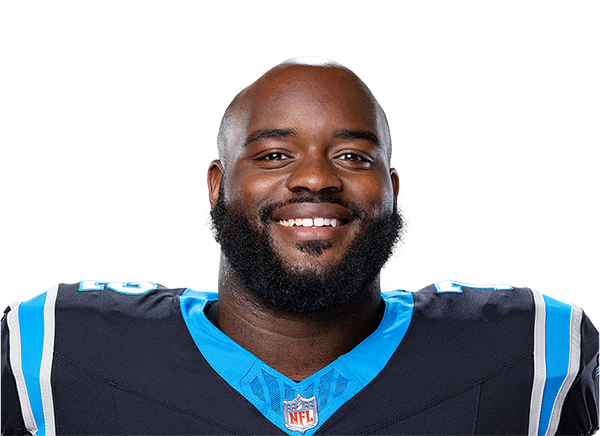 Taylor MotonRT · injured$21.1M$22.0M · 1 yr left−4818% snaps
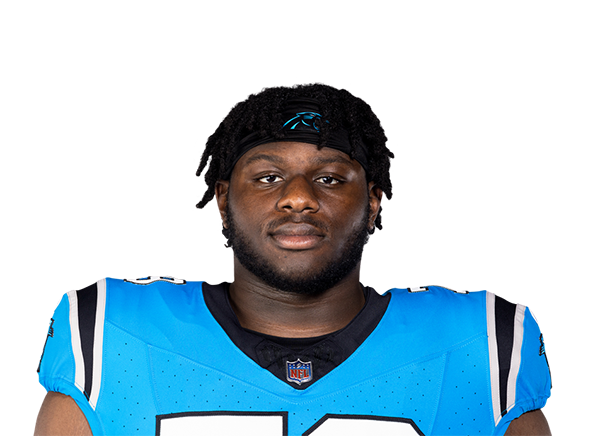 Ikem EkwonuLT · injured$17.6M$6.9M · final year−960% snaps
 Damien LewisLG$16.7M$13.3M · 2 yrs left−3255% snaps
 Monroe FreelingRT$5.2M$5.2M · 4 yrs left−976% snaps
 Rasheed WalkerLT$4.0M$4.0M · 1 yr left+1199% snaps
 Luke FortnerC$2.8M$2.8M · 1 yr left+1396% snaps
 Stone ForsytheLT$2.0M$2.0M · 1 yr left−159% snaps
 Sam HechtC$1.2M$1.2M · 4 yrs left−42% snaps
 Brady ChristensenLG$1.2M$2.8M · 1 yr left−410% snaps
 Corey BullockC$1.0M$1.0M · 1 yr left+3329% snaps
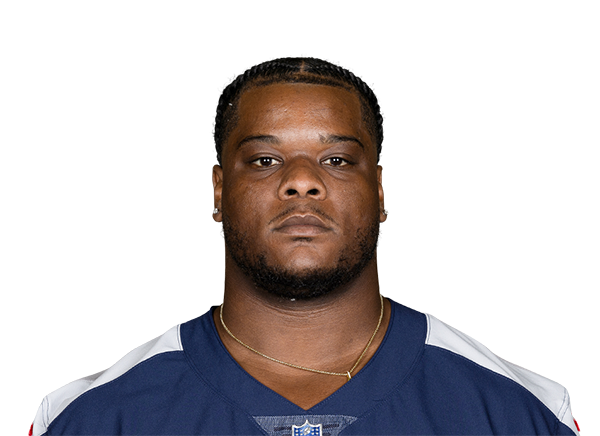 Saahdiq CharlesLT$272K$330K · 1 yr left−140% snaps
16 contracts
Defensive line $60.5M
Player2026 capPer yearPaid / playedGapSnaps
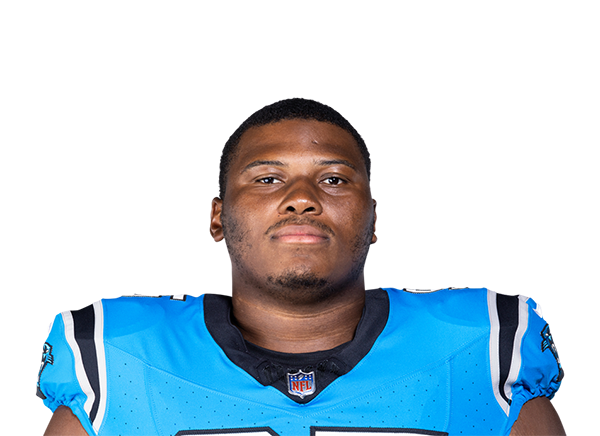 Derrick BrownIDL$11.0M$24.0M · 2 yrs left+370% snaps
 Patrick Jones IIED$10.1M$7.5M · 1 yr left−1251% snaps
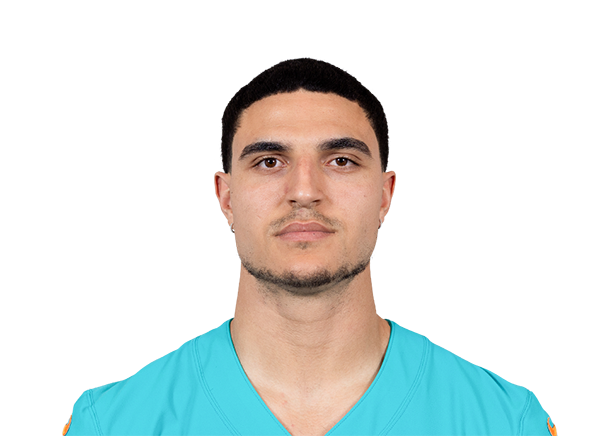 Jaelan PhillipsED$10.0M$30.0M · 4 yrs left−2441% snaps
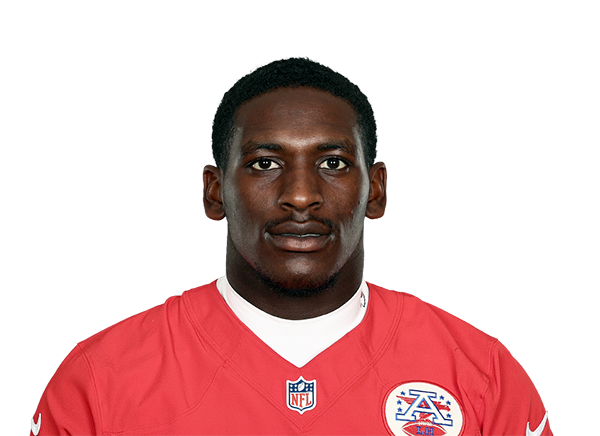 Tershawn WhartonIDL$8.9M$15.0M · 2 yrs left−3329% snaps
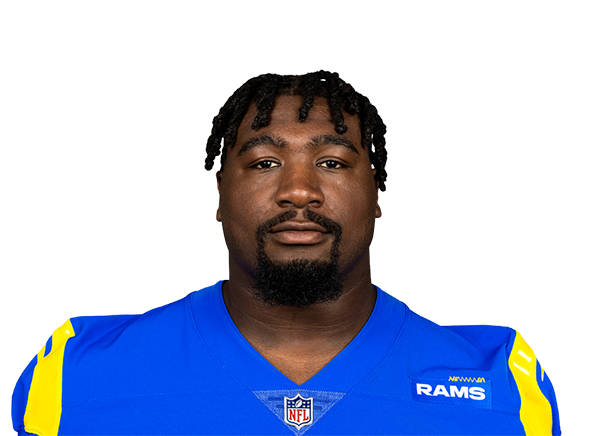 Bobby Brown IIIIDL$8.0M$7.0M · 2 yrs left−3031% snaps
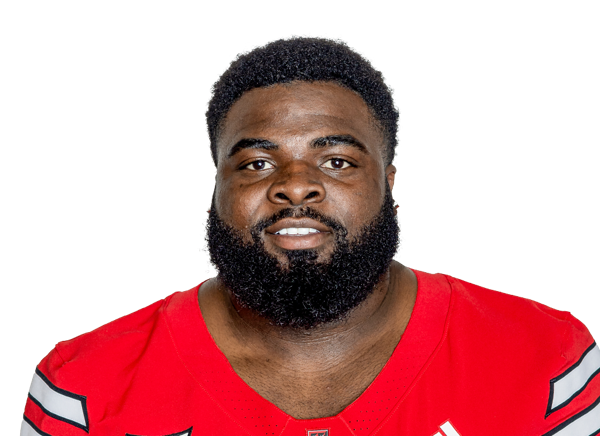 Lee HunterIDL$2.5M$2.5M · 4 yrs left−136% snaps
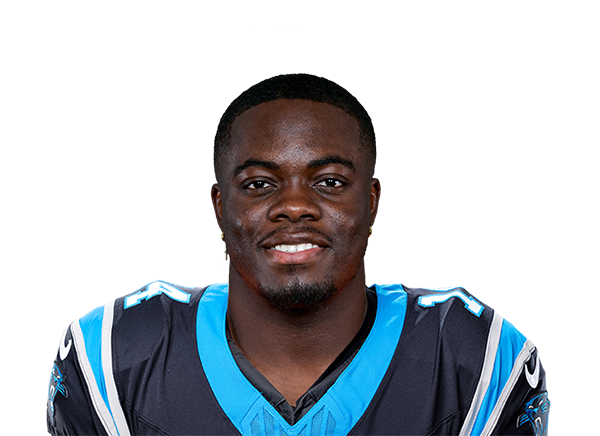 Thomas IncoomED · injured$2.0M$2.0M · 1 yr left−227% snaps
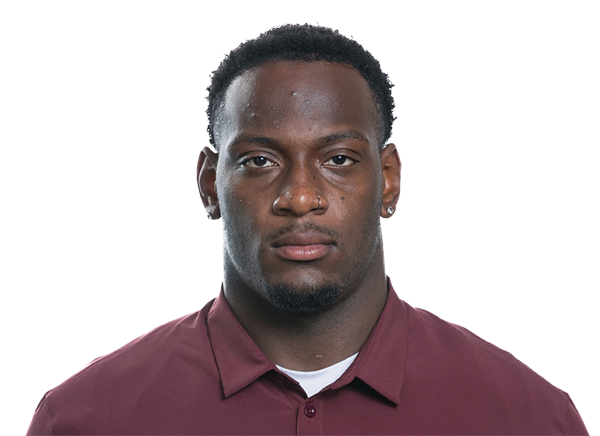 Nic ScourtonED · injured$2.0M$2.2M · 3 yrs left−560% snaps
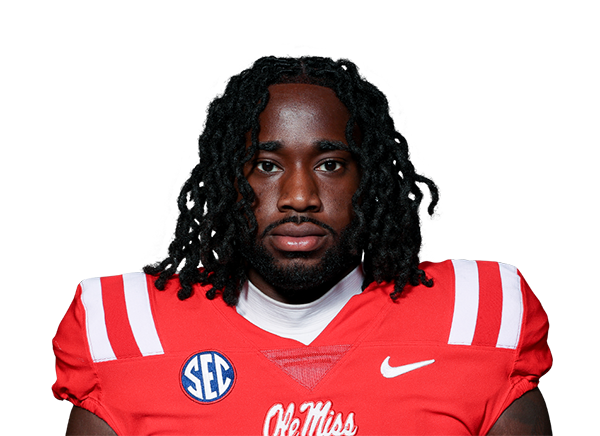 Princely UmanmielenED$1.5M$1.6M · 3 yrs left+2347% snaps
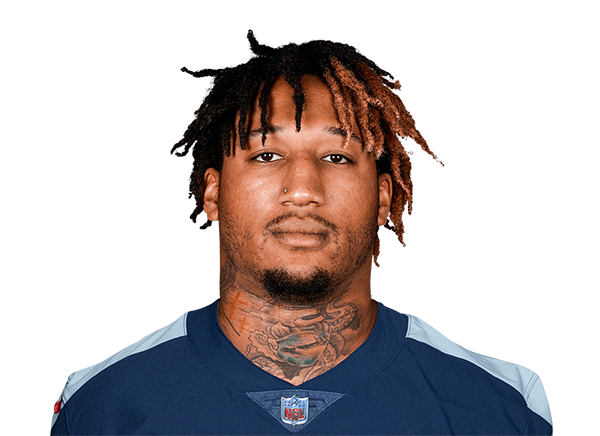 Trevis GipsonED$1.3M$1.4M · 1 yr left+2746% snaps
 Aaron HallIDL$1.0M$1.0M · 3 yrs left+3034% snaps
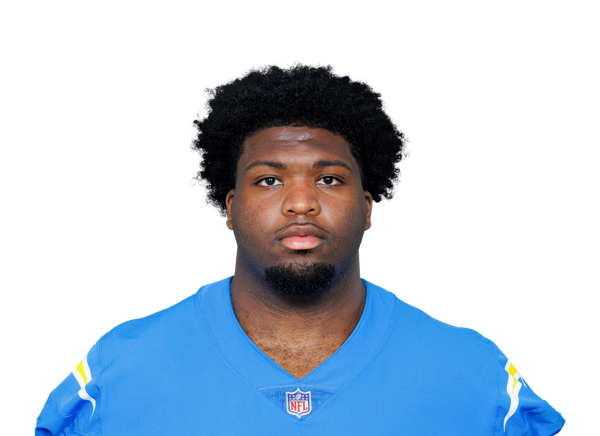 TeRah EdwardsIDL$885K$885K · 1 yr left+2320% snaps
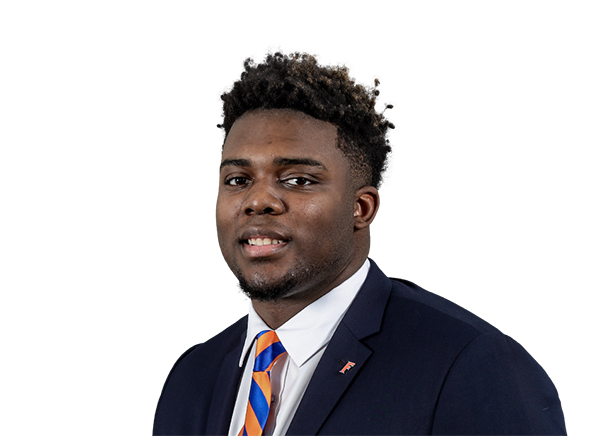 Cam JacksonIDL · injured$787K$1.2M · 3 yrs left+127% snaps
 Parker PetersenIDL$248K$248K · 1 yr left−60% snaps
 Keith Cooper Jr.IDL$179K$248K · 1 yr left+296% snaps
 Ja'Markis WestonED$151K$248K · 1 yr left−10% snaps
4 contracts
Linebackers $10.3M

13 contracts
Secondary $49.2M
Player2026 capPer yearPaid / playedGapSnaps
 Tre'von MoehrigS$21.3M$17.0M · 2 yrs left−698% snaps
 Jaycee HornCB · injured$10.9M$25.0M · 3 yrs left−3834% snaps
 Mike JacksonCB · injured$7.8M$5.3M · 1 yr left−3827% snaps
 Nick ScottS$2.0M$2.0M · 1 yr left+1575% snaps
 Will Lee IIICB$1.4M$1.4M · 4 yrs left+2364% snaps
 Akayleb EvansCB · injured$1.3M$1.4M · 1 yr left+1845% snaps
 Lathan RansomS$1.2M$1.3M · 3 yrs left+1132% snaps
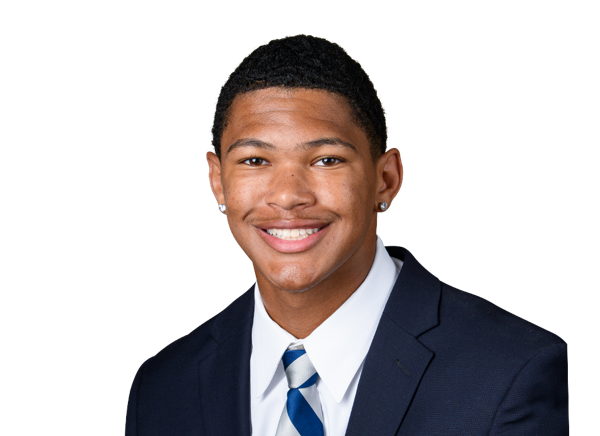 Zakee WheatleyS$1.2M$1.2M · 4 yrs left+2552% snaps
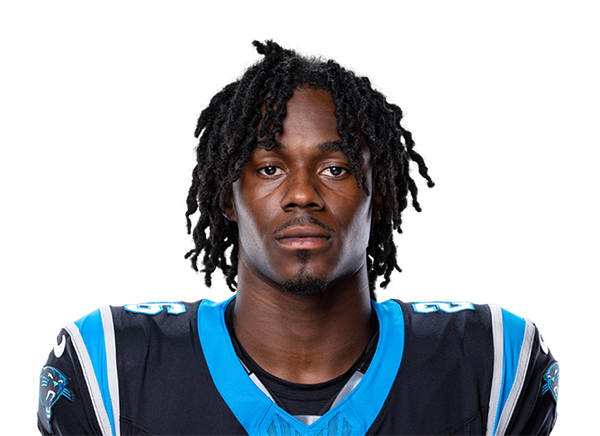 Chau Smith-WadeCB$1.2M$1.1M · 2 yrs left+1324% snaps
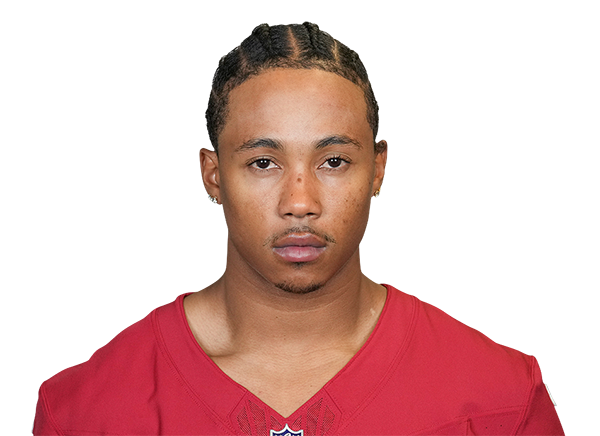 Marco WilsonCB$320K$411K · 1 yr left+3726% snaps
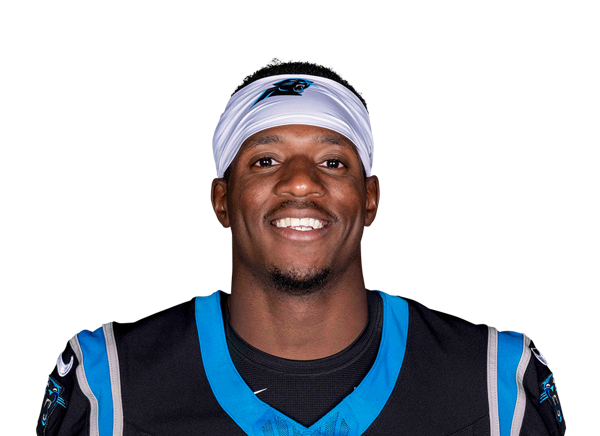 Corey ThorntonCB$248K$248K · 1 yr left+3714% snaps
 DeVonta SmithCB$248K$248K · 1 yr left−50% snaps
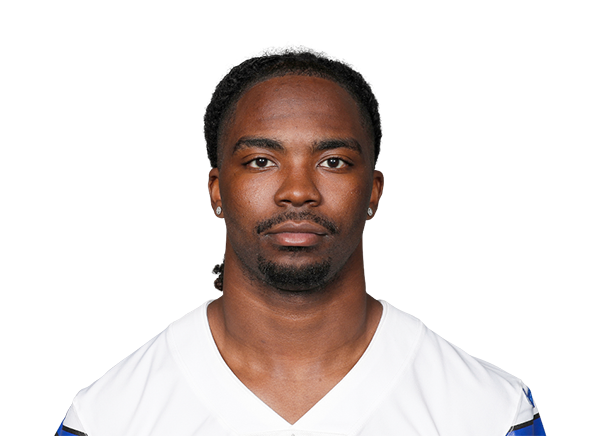 Caelen CarsonCB$202K$330K · 1 yr left+303% snaps
3 contracts
Specialists $3.9M
Player2026 capPer yearPaid / playedGapSnaps
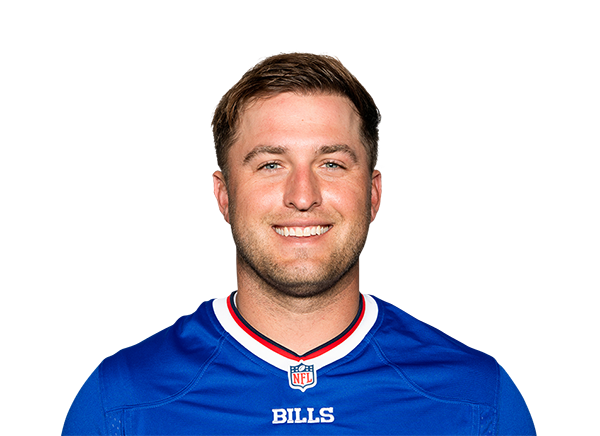 Sam MartinP$1.6M$1.9M · 2 yrs left−4111% snaps
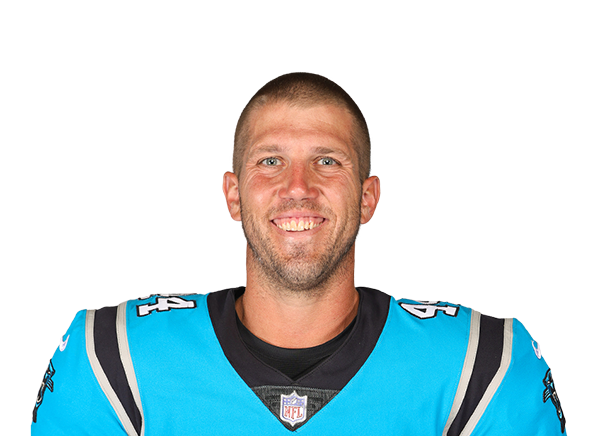 JJ JansenLS$1.3M$1.5M · 1 yr left−2611% snaps
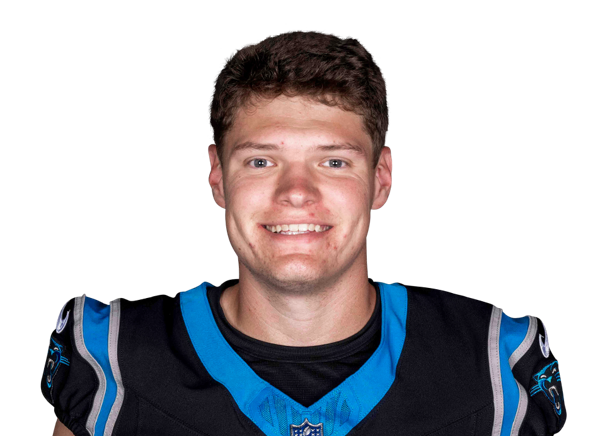 Ryan FitzgeraldK$1.0M$993K · 2 yrs left+6214% snaps
Gold bar: where the player's pay ranks among his position group league-wide. Green bar: where his play ranks (EPA for skill players, share of snaps for everyone else). Gap = played minus paid, in percentile points.