 Pittsburgh SteelersAsked and Answered: Nov. 10
 New York GiantsGiants Now: Michael Strahan offers high praise of Arvell Reese
 Philadelphia EaglesAAA Official Review: What did the Eagles, Joe Milton learn from the QB's first start?
 Buffalo Bills'There's no panic' | The Bills stay strong through early struggles and injuries in MNF win over the Minnesota Vikings
 ESPNVikings left at QB crossroads after Carson Wentz's poor MNF showing vs. Bills
 Broncos DeskBroncos are 7-2, but the snaps say 4.1 wins and the 11th seed in the conference5 h ago
 Pro Football RumorsSeahawks Interested In Adding WR Depth
 InjuryCarl Granderson: Active → Cleared7 h ago
 ESPNCarson Beck next man up for Cardinals
The LabEvery contract against the field
 San Francisco 49ersThe cap file
75 contracts count $256M against the 2026 cap. 64% of it belongs to players on the field, 30th of 32. $26.6M is injured and $66.3M is healthy but not playing. The biggest building: defensive line, $55.1M, 15th in the league.
↳Bottom line64% of the 49ers cap is on the field (30th of 32). The most money goes to defensive line: $55.1M, 15th in the league.
?How to read this chart
- The skyline above:
- one building per position group, as tall as the cap hit (this season's salary-cap charge) 49ers spend on it, on the same scale as every other team. Lit windows are the share of that money on players who are actually on the field; dark windows are injured or idle money.
- The cards below:
- the same money in numbers. The bar fills with the share on the field, and "in spend" ranks the team among all 32 for that group.
Quarterbacks$27.8M85% on the field · 13th in spend
Running backs$18.1M86% on the field · 6th in spend
Wide receivers$37.1M31% on the field · 8th in spend
Tight ends$20.0M88% on the field · 3rd in spend
Offensive line$39.5M80% on the field · 23rd in spend
Defensive line$55.1M35% on the field · 15th in spend
Linebackers$28.1M80% on the field · 2nd in spend
Secondary$27.2M67% on the field · 27th in spend
Specialists$3.0M100% on the field · 27th in spend
Best value on the roster
Earning more than they cost
↳Bottom lineBest value on the roster: Connor Colby, played 87th and paid 26th among OLs.
?How to read the contract tables
- One row = one contract.
- 2026 cap hit, average per year and years left.
- Paid / played bars:
- the gold bar is where his pay ranks among players at his position across the league, the green bar where his play ranks (EPA, expected points added, for QB, RB, WR, TE; share of snaps for everyone else). Full bar = top of the league.
- Gap:
- played rank minus paid rank, in percentile points. Positive (green) means he gives more than he costs; negative (red) means the opposite.
3 contracts
Quarterbacks $27.8M
Player2026 capPer yearPaid / playedGapEPA
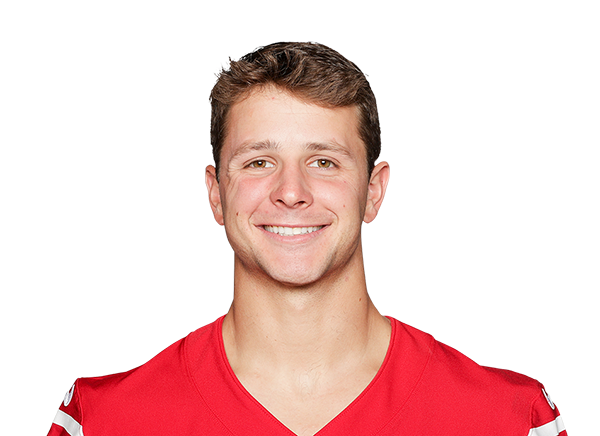 Brock PurdyQB$23.7M$53.0M · 4 yrs left+14+78.5 EPA
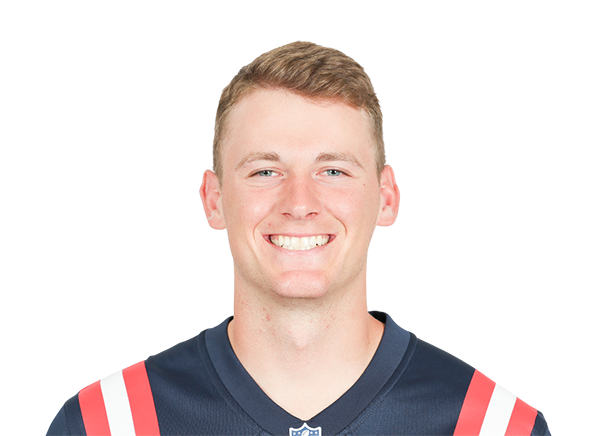 Mac JonesQB$3.1M$3.5M · 1 yr left+15+0.0 EPA
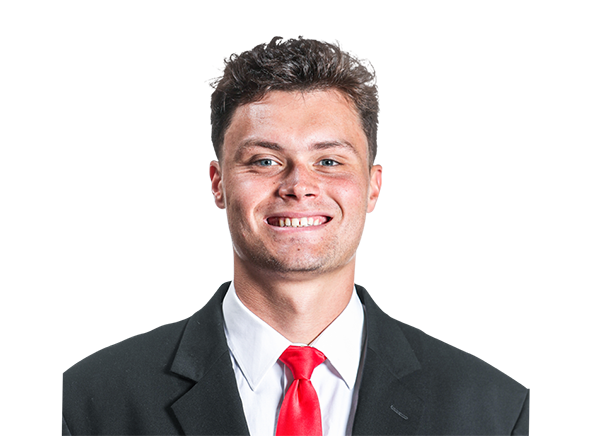 Kurtis RourkeQB$919K$1.1M · 3 yrs left−18+0.0 EPA
6 contracts
Running backs $18.1M
Player2026 capPer yearPaid / playedGapEPA
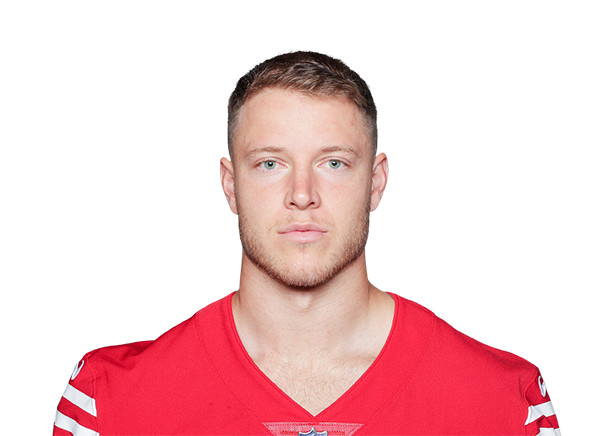 Christian McCaffreyRB$10.9M$19.0M · final year+2+18.2 EPA
 Kyle JuszczykFB$2.9M$3.8M · 1 yr left+16+4.5 EPA
 Kaelon BlackRB$1.7M$1.7M · 4 yrs left−16-8.8 EPA
 Isaac GuerendoRB · injured$1.3M$1.2M · 2 yrs left−49+0.0 EPA
 Jordan JamesRB$1.1M$1.2M · 3 yrs left+29-1.7 EPA
 Sincere McCormickRB$248K$248K · 1 yr left−6+0.0 EPA
12 contracts
Wide receivers $37.1M
Player2026 capPer yearPaid / playedGapEPA
 Brandon AiyukWR$12.5M$30.0M · 2 yrs left−95+0.0 EPA
 Deebo Samuel Sr.WR$4.9M$4.1M · 1 yr left−10+5.2 EPA
 Mike EvansWR$4.3M$14.2M · 3 yrs left+21+40.9 EPA
 Ricky PearsallWR · injured$3.4M$3.1M · 2 yrs left−71+0.0 EPA
 De'Zhaun StriblingWR · injured$3.3M$3.3M · 4 yrs left−71+0.0 EPA
 Christian KirkWR · injured$3.0M$3.0M · 1 yr left−69+0.0 EPA
 Demarcus RobinsonWR$2.7M$4.0M · 1 yr left+3+5.0 EPA
 Jacob CowingWR$1.2M$1.1M · 2 yrs left−8-4.7 EPA
 Jordan WatkinsWR$1.2M$1.2M · 3 yrs left+42+12.4 EPA
 Will PaulingWR$248K$248K · 1 yr left−7+0.0 EPA
 Wesley GrimesWR$248K$248K · 1 yr left−7+0.0 EPA
 Xavier SmithWR$193K$248K · 1 yr left+45-0.8 EPA
4 contracts
Tight ends $20.0M

13 contracts
Offensive line $39.5M
Player2026 capPer yearPaid / playedGapSnaps
 Trent WilliamsLT$20.0M$25.0M · 2 yrs left−2293% snaps
 Colton McKivitzLT$5.8M$15.0M · 2 yrs left+6100% snaps
 Jake BrendelC$3.1M$4.1M · 1 yr left+1397% snaps
 Vederian LoweLT$2.3M$4.6M · 2 yrs left−177% snaps
 Dominick PuniRG$1.6M$1.4M · 2 yrs left+2899% snaps
 Jarrett PattersonLG$1.4M$1.8M · 1 yr left−103% snaps
 Carver WillisRT$1.4M$1.4M · 4 yrs left−121% snaps
 Enrique Cruz Jr.RT$1.2M$1.2M · 4 yrs left−400% snaps
 Austen PleasantsLT · injured$1.1M$1.1M · 1 yr left−300% snaps
 Connor ColbyRG$1.0M$1.1M · 3 yrs left+61100% snaps
 Foster SarellLT$330K$330K · 1 yr left−150% snaps
 Drake NugentC$248K$248K · 1 yr left−40% snaps
 Isaac AlarconLT$0K$248K · 1 yr left00% snaps
15 contracts
Defensive line $55.1M
Player2026 capPer yearPaid / playedGapSnaps
 Nick BosaED$23.0M$34.0M · 2 yrs left−5222% snaps
 DeForest BucknerIDL$7.9M$23.0M · final year+1174% snaps
 Mykel WilliamsED$5.4M$6.2M · 3 yrs left−3420% snaps
 Osa OdighizuwaIDL$5.1M$20.0M · 3 yrs left+1872% snaps
 Alfred CollinsIDL · injured$2.3M$2.6M · 3 yrs left−590% snaps
 Sam OkuayinonuED · injured$2.3M$2.3M · 1 yr left−580% snaps
 Romello HeightED$1.8M$1.8M · 4 yrs left+1646% snaps
 Keion WhiteED$1.8M$1.9M · 1 yr left+3162% snaps
 Gracen HaltonIDL$1.4M$1.4M · 4 yrs left+1944% snaps
 Khalid KareemED$1.1M$1.2M · 1 yr left+2428% snaps
 Mikail KamaraED · injured$1.0M$1.0M · 3 yrs left−250% snaps
 C.J. WestIDL · injured$844K$1.3M · 3 yrs left+159% snaps
 Andrew Farmer IIED · injured$540K$1.0M · 1 yr left−160% snaps
 McKinnley JacksonIDL$234K$248K · 1 yr left−50% snaps
 Viliami Fehoko Jr.ED$193K$248K · 1 yr left+263% snaps
7 contracts
Linebackers $28.1M
Player2026 capPer yearPaid / playedGapSnaps
 Fred WarnerLB$17.9M$21.0M · 2 yrs left−897% snaps
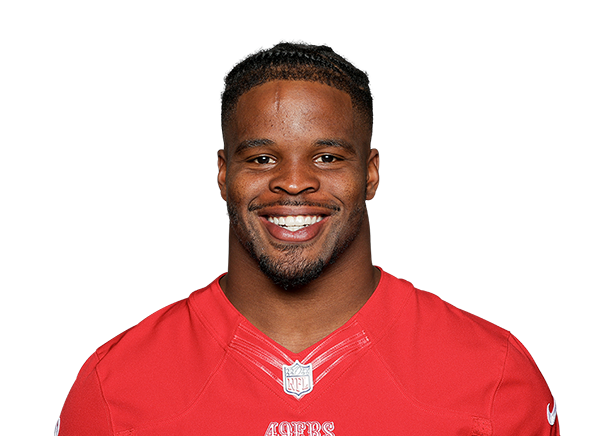 Dre GreenlawLB$3.4M$6.0M · 1 yr left−165% snaps
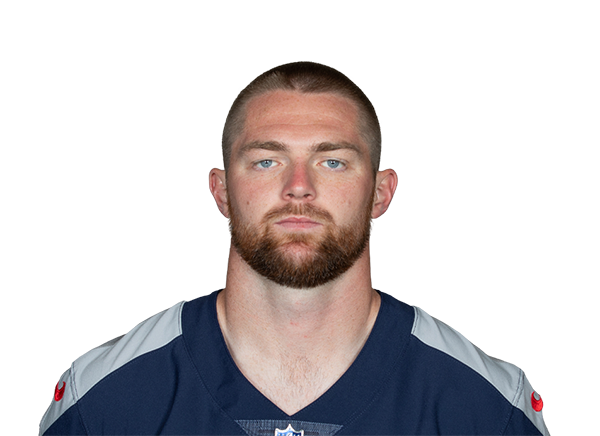 Luke GiffordLB$2.0M$2.5M · 2 yrs left−195% snaps
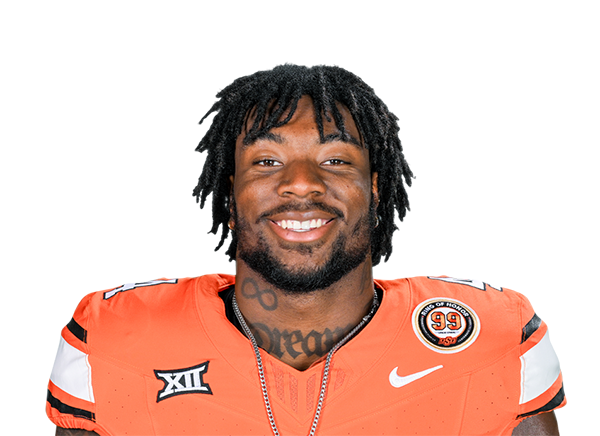 Nick MartinLB · injured$1.5M$1.6M · 3 yrs left−570% snaps
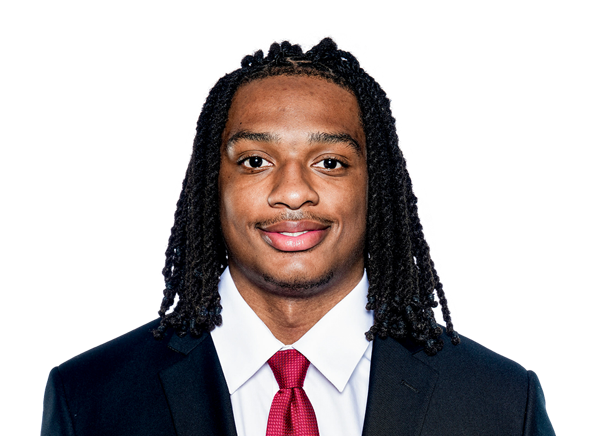 Jaden DuggerLB$1.2M$1.2M · 4 yrs left+2449% snaps
 Tatum BethuneLB$1.1M$1.0M · 2 yrs left−330% snaps
 Garret WallowLB$1.1M$1.2M · 1 yr left+1811% snaps
13 contracts
Secondary $27.2M
Player2026 capPer yearPaid / playedGapSnaps
 Deommodore LenoirCB$8.9M$18.0M · 3 yrs left−195% snaps
 Ji'Ayir BrownS$3.9M$1.3M · 1 yr left+1294% snaps
 Nate HobbsCB · injured$3.4M$3.5M · 1 yr left−720% snaps
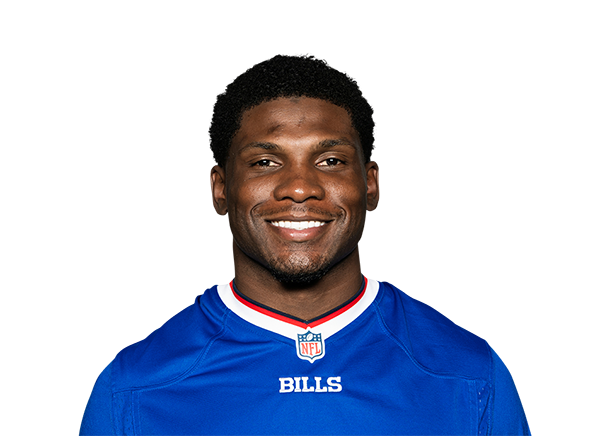 Siran NealCB$1.8M$2.0M · 1 yr left−301% snaps
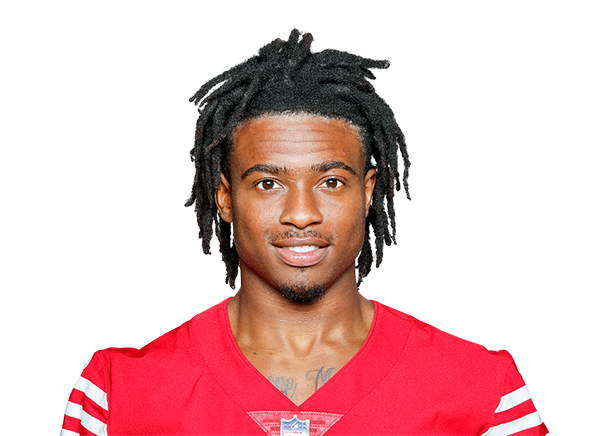 Renardo GreenCB$1.7M$1.6M · 2 yrs left+3297% snaps
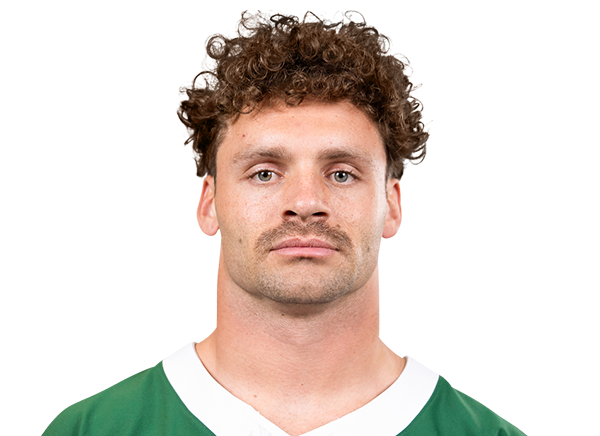 Ashtyn DavisS$1.4M$1.5M · 1 yr left−184% snaps
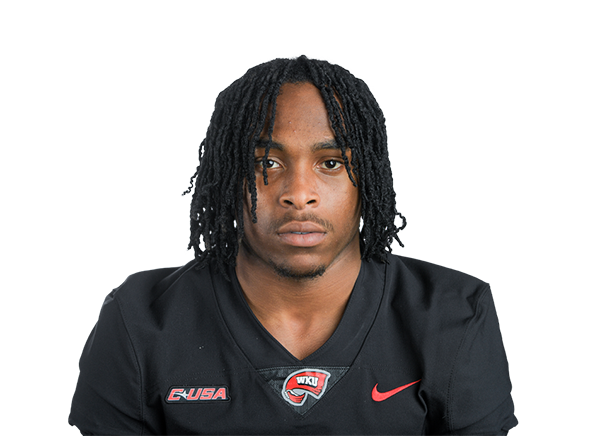 Upton StoutS$1.4M$1.5M · 3 yrs left+1449% snaps
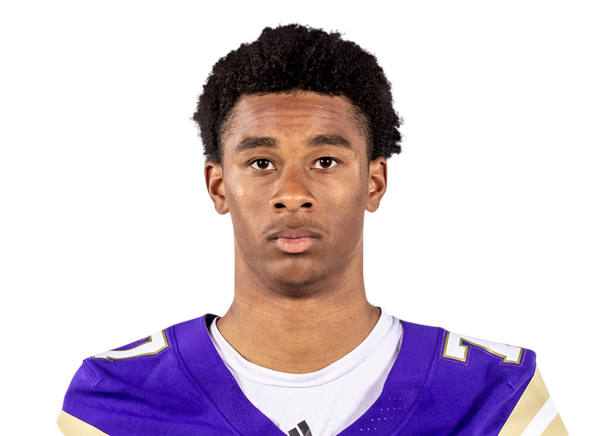 Ephesians PrysockCB$1.3M$1.3M · 4 yrs left−182% snaps
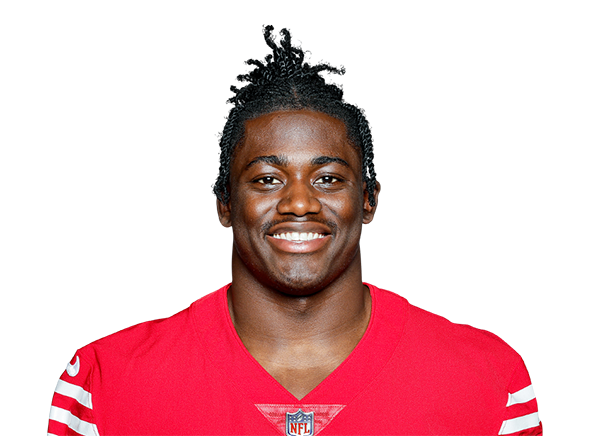 Malik MustaphaS$1.3M$1.2M · 2 yrs left+2355% snaps
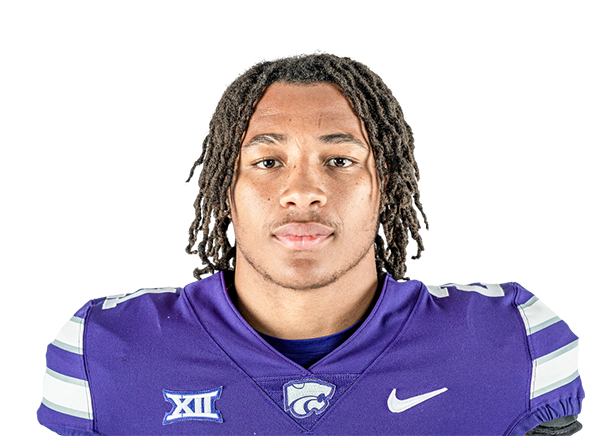 Marques SigleS$1.1M$1.2M · 3 yrs left+3451% snaps
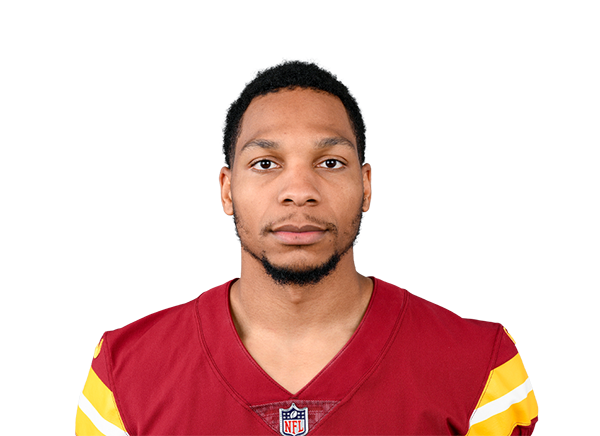 Darrick ForrestS · injured$565K$1.2M · 1 yr left−160% snaps
 Brandon CodringtonCB$248K$248K · 1 yr left−50% snaps
 Jalen StromanS$248K$248K · 1 yr left−50% snaps
2 contracts
Specialists $3.0M
Player2026 capPer yearPaid / playedGapSnaps
 Eddy PineiroK$2.0M$4.3M · 4 yrs left+2117% snaps
 Corliss WaitmanP$1.1M$1.2M · 1 yr left+1012% snaps
Gold bar: where the player's pay ranks among his position group league-wide. Green bar: where his play ranks (EPA for skill players, share of snaps for everyone else). Gap = played minus paid, in percentile points.