 Pittsburgh SteelersAsked and Answered: Nov. 10
 New York GiantsGiants Now: Michael Strahan offers high praise of Arvell Reese
 Philadelphia EaglesAAA Official Review: What did the Eagles, Joe Milton learn from the QB's first start?
 Buffalo Bills'There's no panic' | The Bills stay strong through early struggles and injuries in MNF win over the Minnesota Vikings
 ESPNVikings left at QB crossroads after Carson Wentz's poor MNF showing vs. Bills
 Broncos DeskBroncos are 7-2, but the snaps say 4.1 wins and the 11th seed in the conference5 h ago
 Pro Football RumorsSeahawks Interested In Adding WR Depth
 InjuryCarl Granderson: Active → Cleared7 h ago
 ESPNCarson Beck next man up for Cardinals
The LabEvery contract against the field
 Tennessee TitansThe cap file
68 contracts count $254M against the 2026 cap. 88% of it belongs to players on the field, 3rd of 32. $6.4M is injured and $24.6M is healthy but not playing. The biggest building: offensive line, $55.5M, 10th in the league.
↳Bottom line88% of the Titans cap is on the field (3rd of 32). The most money goes to offensive line: $55.5M, 10th in the league.
?How to read this chart
- The skyline above:
- one building per position group, as tall as the cap hit (this season's salary-cap charge) Titans spend on it, on the same scale as every other team. Lit windows are the share of that money on players who are actually on the field; dark windows are injured or idle money.
- The cards below:
- the same money in numbers. The bar fills with the share on the field, and "in spend" ranks the team among all 32 for that group.
Quarterbacks$15.6M71% on the field · 20th in spend
Running backs$15.6M84% on the field · 7th in spend
Wide receivers$42.7M95% on the field · 3rd in spend
Tight ends$10.1M63% on the field · 23rd in spend
Offensive line$55.5M92% on the field · 10th in spend
Defensive line$46.3M85% on the field · 24th in spend
Linebackers$13.8M84% on the field · 20th in spend
Secondary$48.7M91% on the field · 11th in spend
Specialists$5.6M100% on the field · 13th in spend
Best value on the roster
Earning more than they cost
↳Bottom lineBest value on the roster: Anthony Hill Jr., played 96th and paid 62nd among LBs.
?How to read the contract tables
- One row = one contract.
- 2026 cap hit, average per year and years left.
- Paid / played bars:
- the gold bar is where his pay ranks among players at his position across the league, the green bar where his play ranks (EPA, expected points added, for QB, RB, WR, TE; share of snaps for everyone else). Full bar = top of the league.
- Gap:
- played rank minus paid rank, in percentile points. Positive (green) means he gives more than he costs; negative (red) means the opposite.
3 contracts
Quarterbacks $15.6M
Player2026 capPer yearPaid / playedGapEPA
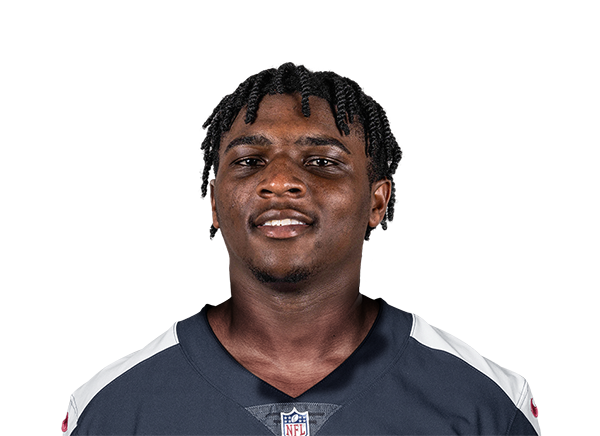 Cam WardQB$11.1M$12.2M · 3 yrs left−38-22.0 EPA
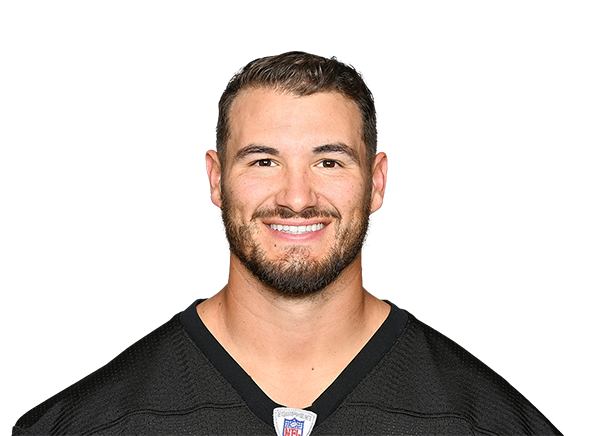 Mitchell TrubiskyQB$4.3M$5.3M · 2 yrs left−67+0.0 EPA
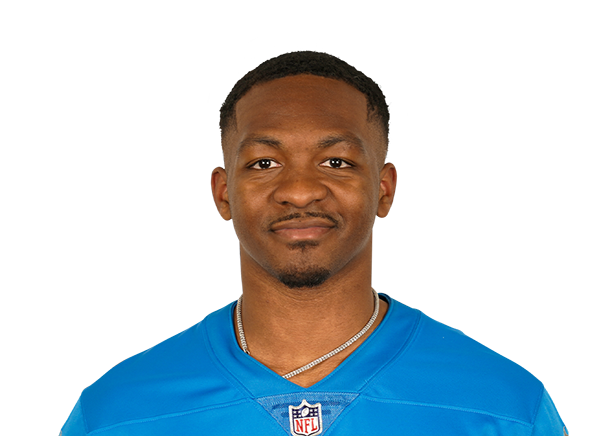 Hendon HookerQB$248K$248K · 1 yr left−4+0.0 EPA
4 contracts
Running backs $15.6M
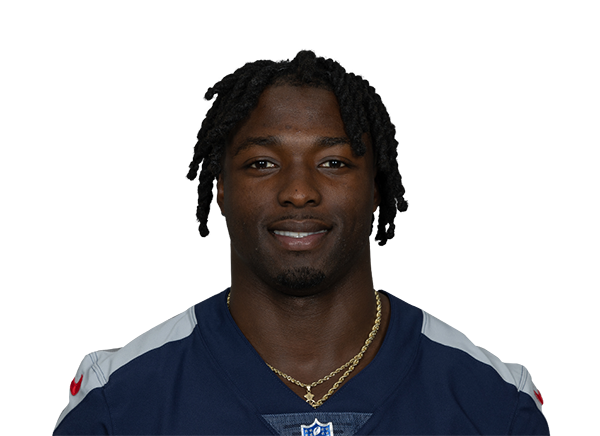
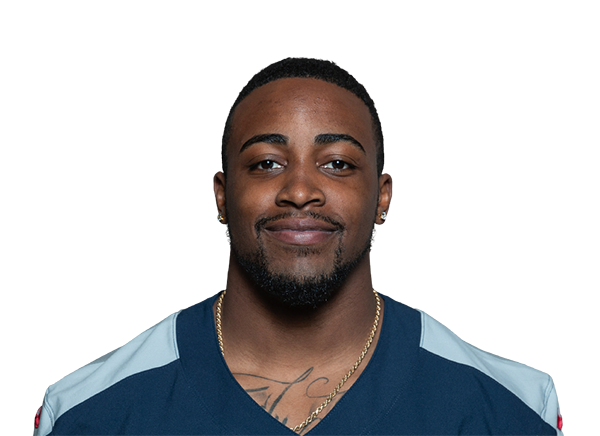
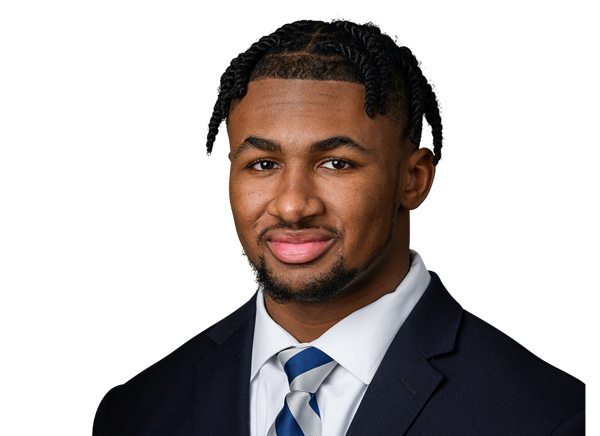
8 contracts
Wide receivers $42.7M
Player2026 capPer yearPaid / playedGapEPA
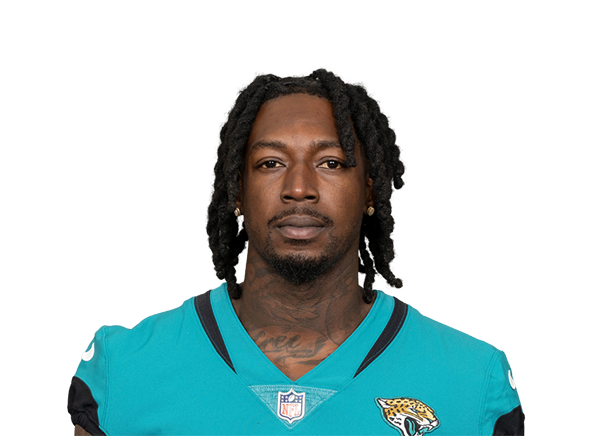 Calvin RidleyWR$15.2M$17.6M · 2 yrs left−39+0.9 EPA
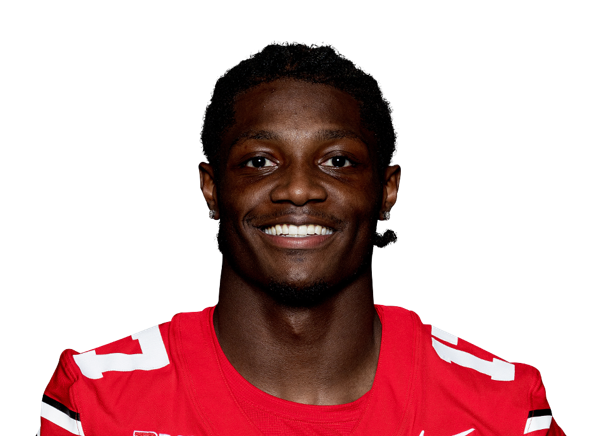 Carnell TateWR$12.8M$12.8M · 4 yrs left−11+10.1 EPA
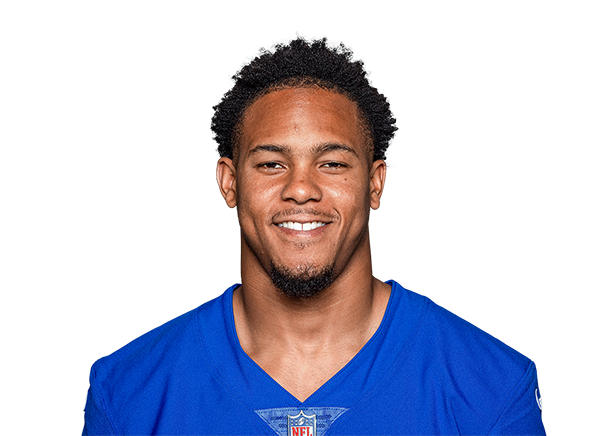 Wan'Dale RobinsonWR$11.3M$17.5M · 4 yrs left−46-0.7 EPA
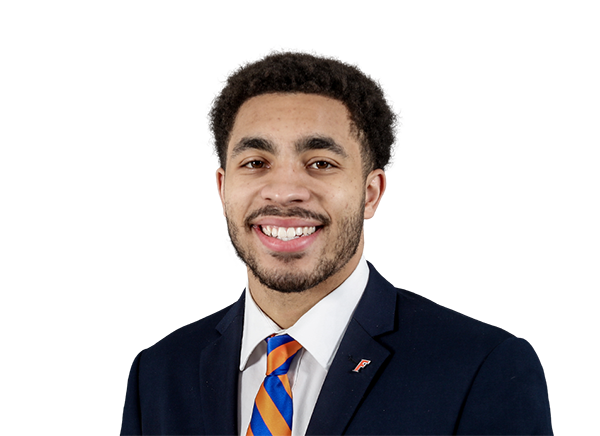 Chimere DikeWR$1.4M$1.4M · 3 yrs left+15+3.3 EPA
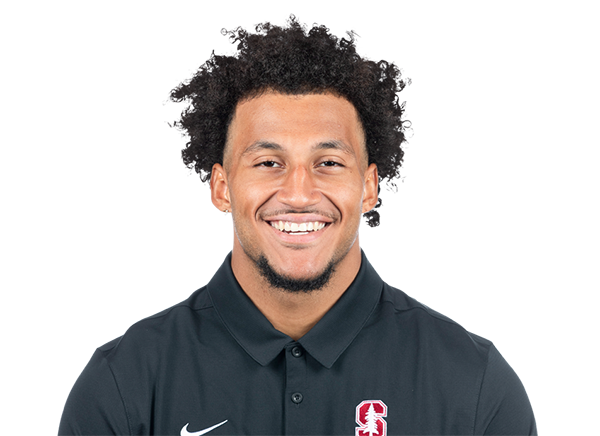 Elic AyomanorWR$1.2M$1.2M · 3 yrs left+29+5.7 EPA
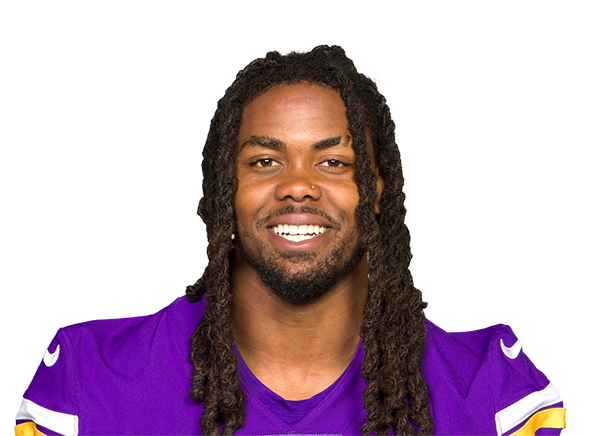 K.J. OsbornWR$372K$330K · 1 yr left−25+0.0 EPA
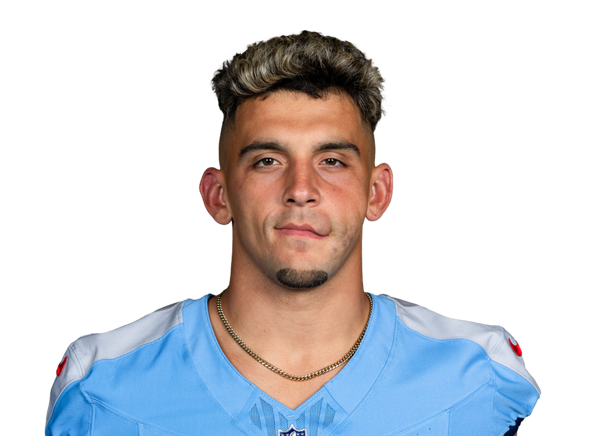 Xavier RestrepoWR$283K$248K · 1 yr left−21+0.0 EPA
 Tyren MontgomeryWR$248K$248K · 1 yr left−7+0.0 EPA
6 contracts
Tight ends $10.1M
Player2026 capPer yearPaid / playedGapEPA
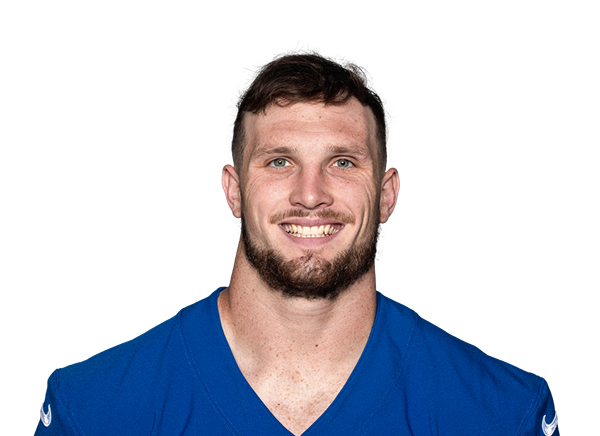 Daniel BellingerTE$5.1M$7.0M · 3 yrs left−39-3.4 EPA
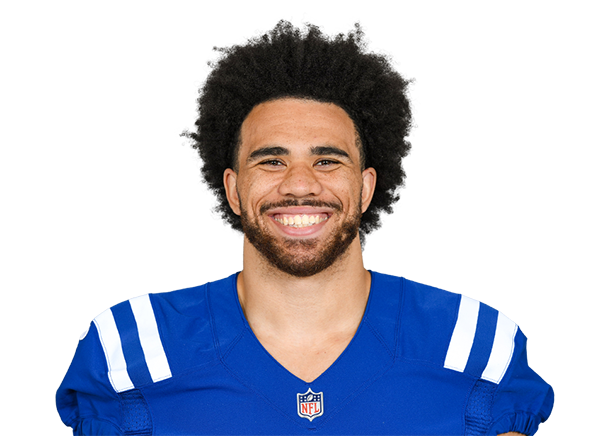 Kylen GransonTE$1.3M$1.4M · 1 yr left+4-0.8 EPA
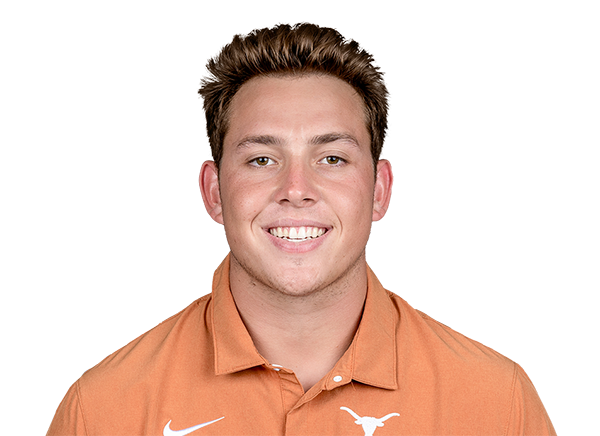 Gunnar HelmTE$1.2M$1.3M · 3 yrs left+34+3.8 EPA
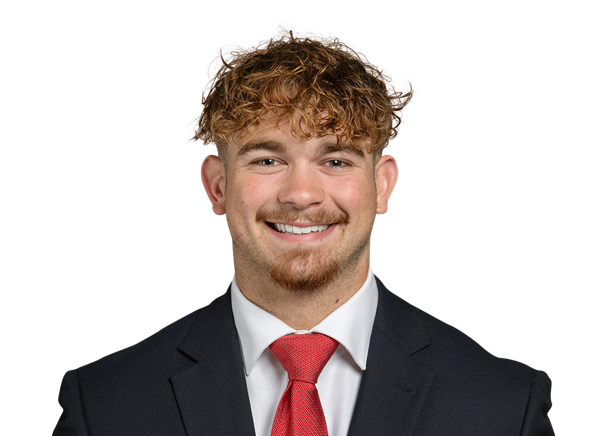 Jaren KanakTE · injured$1.1M$1.1M · 4 yrs left−34+0.0 EPA
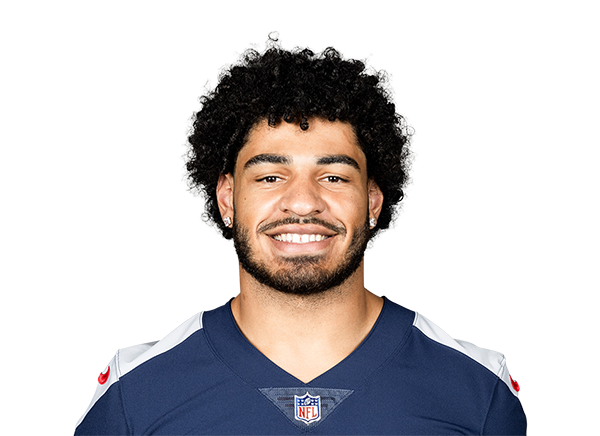 David Martin-RobinsonTE$1.1M$946K · 1 yr left−29+0.0 EPA
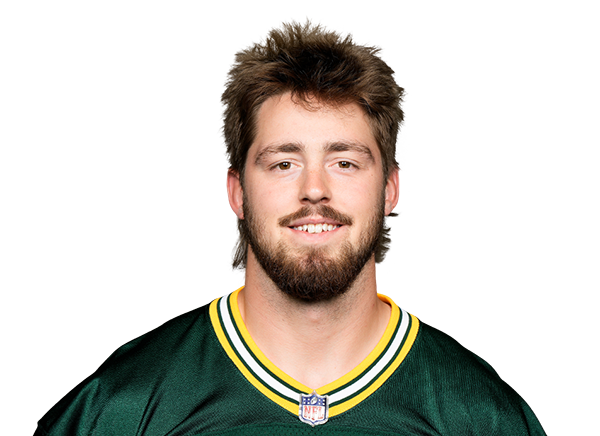 Joel WilsonTE$248K$248K · 1 yr left−4+0.0 EPA
11 contracts
Offensive line $55.5M
Player2026 capPer yearPaid / playedGapSnaps
 Dan Moore Jr.LT$26.3M$20.5M · 3 yrs left−13100% snaps
 Peter SkoronskiLG$13.2M$25.0M · 4 yrs left−1696% snaps
 JC LathamLT$7.1M$6.5M · 2 yrs left−993% snaps
 Austin SchlottmannC$3.0M$3.5M · 2 yrs left+22100% snaps
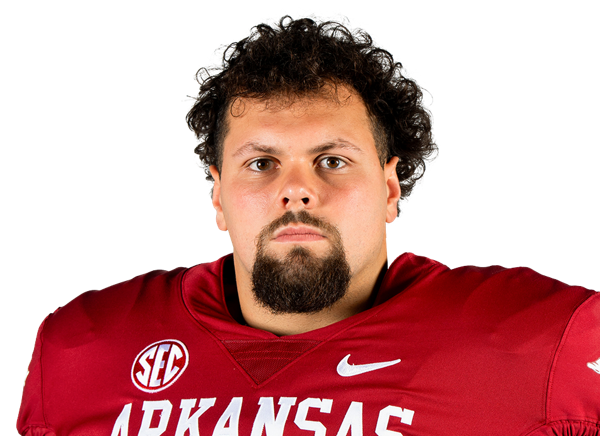 Fernando CarmonaRG · injured$1.2M$1.2M · 4 yrs left+922% snaps
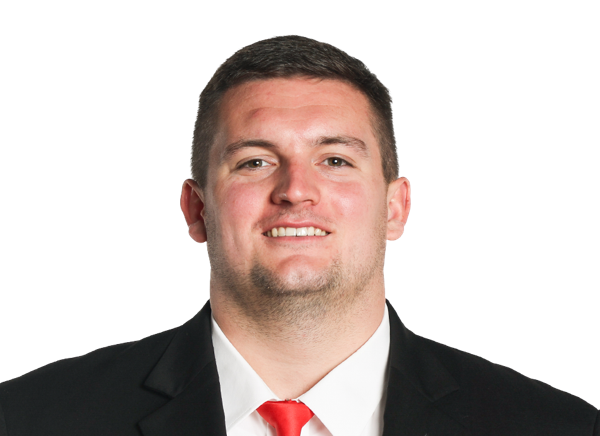 Pat CooganC$1.2M$1.2M · 4 yrs left−390% snaps
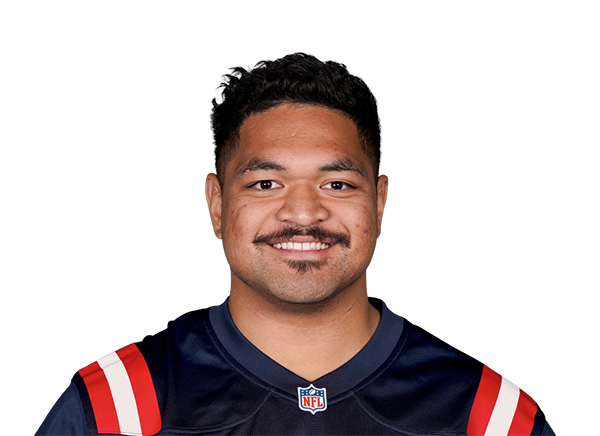 Atonio MafiLG$1.1M$2.2M · final year+3066% snaps
 James Hudson IIIRT$1.1M$1.2M · 1 yr left+149% snaps
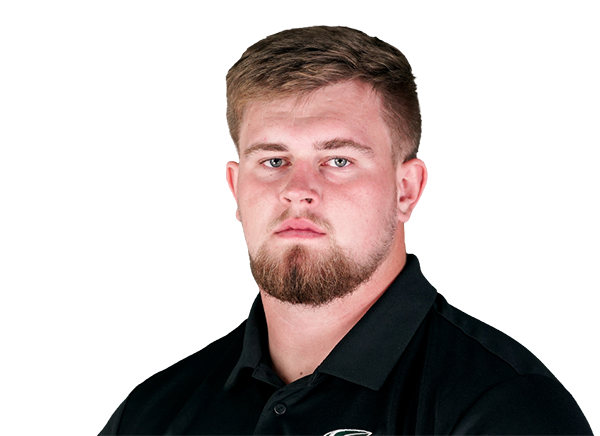 Jackson SlaterLG · injured$719K$1.1M · 3 yrs left+2712% snaps
 Chandler ZavalaRG$257K$330K · 1 yr left−140% snaps
 Rasheed MillerLT$248K$248K · 1 yr left−40% snaps
13 contracts
Defensive line $46.3M
Player2026 capPer yearPaid / playedGapSnaps
 John Franklin-MyersED$15.0M$21.0M · 3 yrs left−1752% snaps
 Jermaine Johnson IIED$13.4M$3.3M · final year−862% snaps
 Keldric FaulkED$4.3M$4.3M · 4 yrs left−1632% snaps
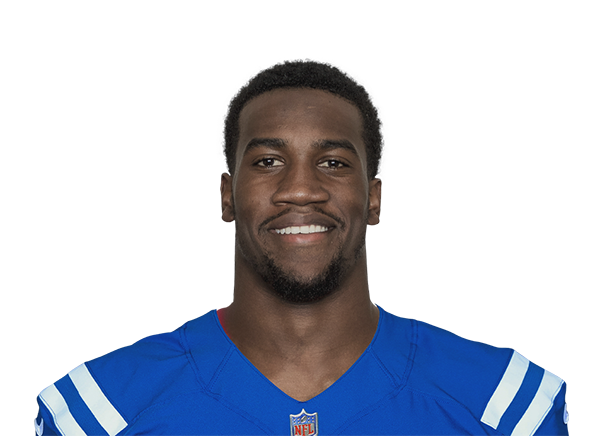 Jacob MartinED$3.5M$9.0M · 1 yr left+1659% snaps
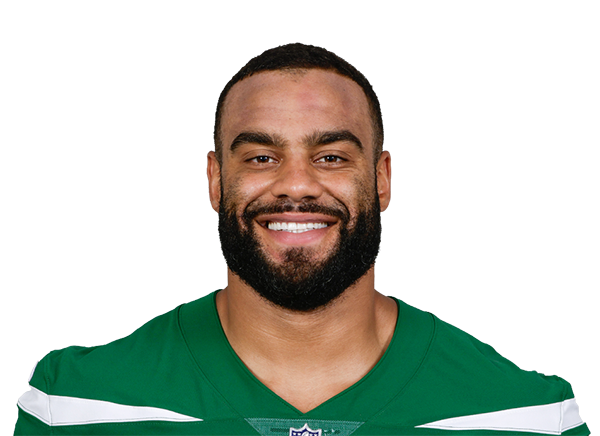 Solomon ThomasIDL$2.5M$3.0M · 1 yr left−234% snaps
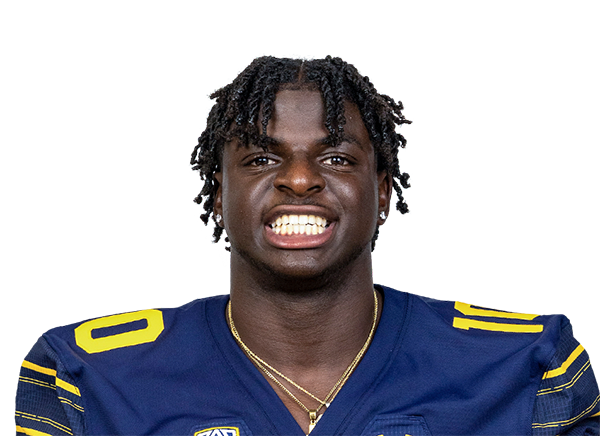 Oluwafemi OladejoED$1.9M$2.1M · 3 yrs left−822% snaps
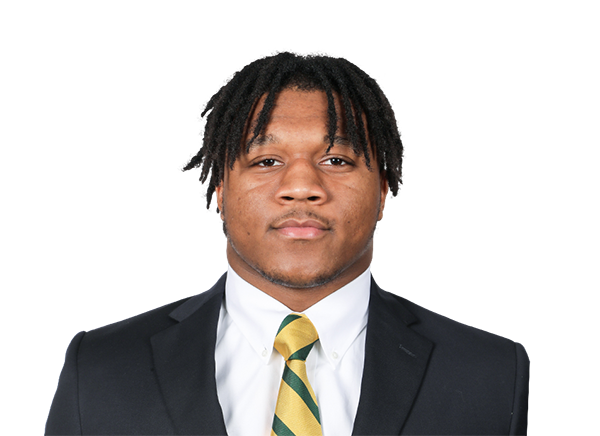 Jackie MarshallIDL$1.2M$1.2M · 4 yrs left−400% snaps
 Jaylen HarrellED · injured$1.1M$1.0M · 2 yrs left−320% snaps
 Truman JonesED$1.0M$923K · 1 yr left+127% snaps
 Nazir StackhouseIDL$1.0M$993K · 2 yrs left+2725% snaps
 Jonah LauluIDL$657K$1.0M · 2 yrs left+2621% snaps
 Tanoh KpassagnonED · injured$565K$1.3M · 1 yr left−170% snaps
 Jalyn HolmesIDL$330K$330K · 1 yr left−150% snaps
6 contracts
Linebackers $13.8M
Player2026 capPer yearPaid / playedGapSnaps
 Cody BartonLB$8.2M$7.0M · 2 yrs left−1572% snaps
 Anthony Hill Jr.LB$2.0M$2.0M · 4 yrs left+3499% snaps
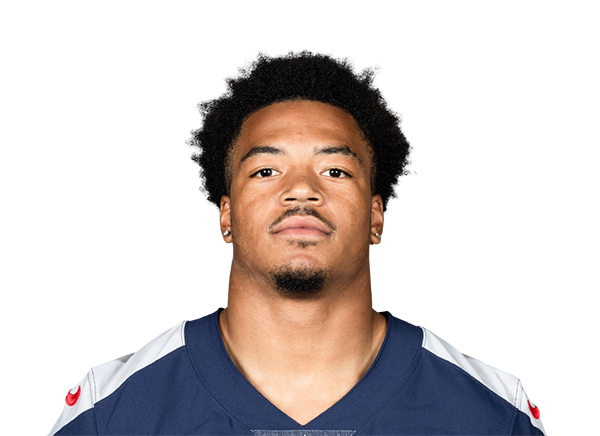 Cedric GrayLB$1.3M$1.2M · 2 yrs left+1340% snaps
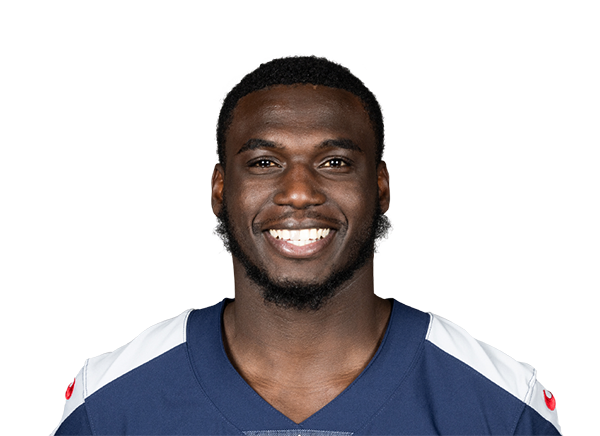 James Williams Sr.LB · injured$1.1M$1.0M · 2 yrs left+105% snaps
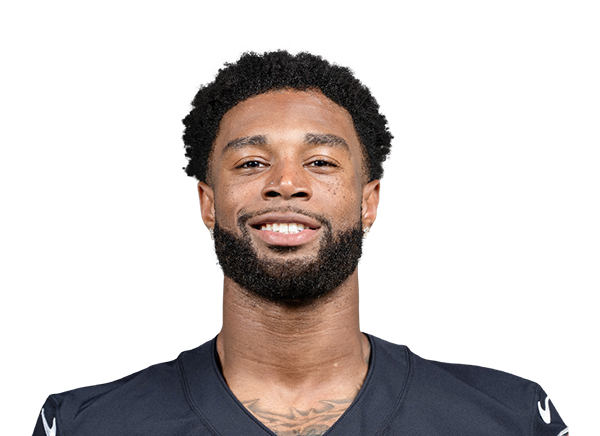 Milo EiflerLB · injured$590K$1.2M · 2 yrs left−160% snaps
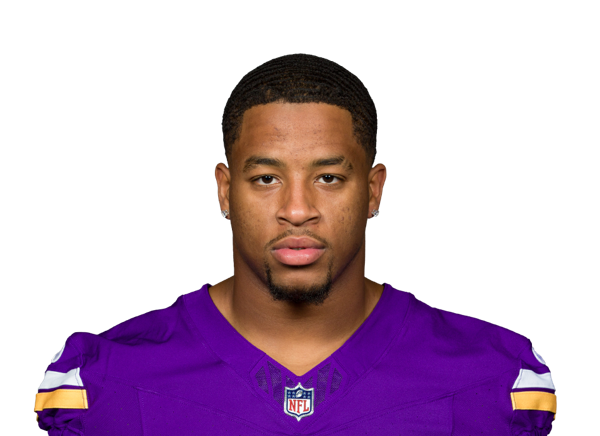 Dorian MausiLB$540K$990K · 2 yrs left−140% snaps
13 contracts
Secondary $48.7M
Player2026 capPer yearPaid / playedGapSnaps
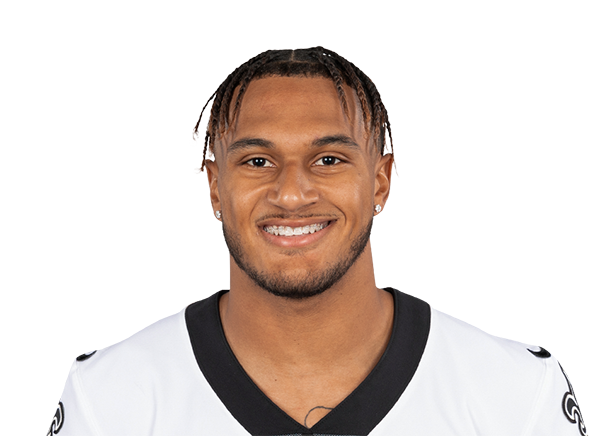 Alontae TaylorCB$14.0M$19.3M · 3 yrs left−2269% snaps
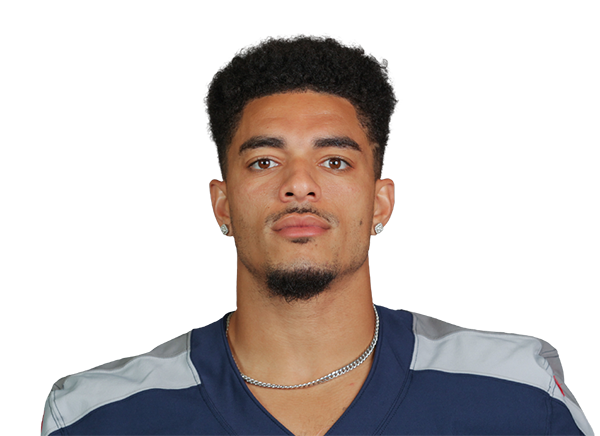 Amani HookerS$12.0M$13.5M · 2 yrs left−988% snaps
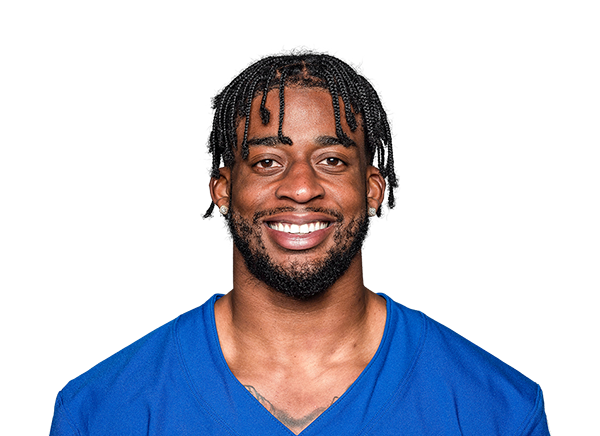 Cor'Dale FlottCB$10.7M$15.0M · 3 yrs left−1280% snaps
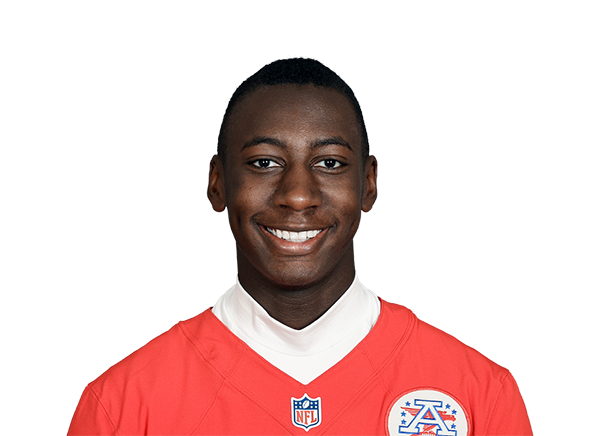 Joshua WilliamsCB$3.1M$4.0M · 2 yrs left−1040% snaps
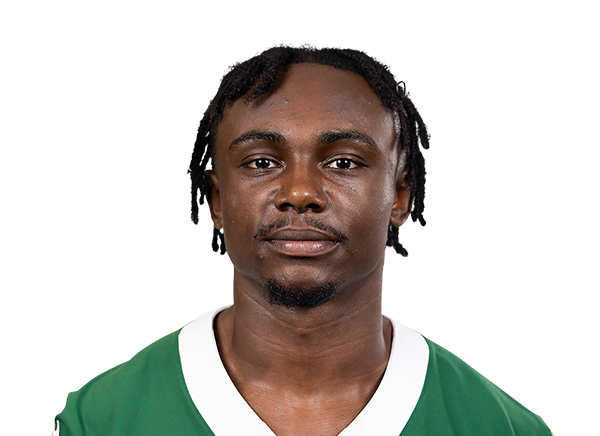 Tony AdamsS$2.0M$2.1M · 1 yr left−735% snaps
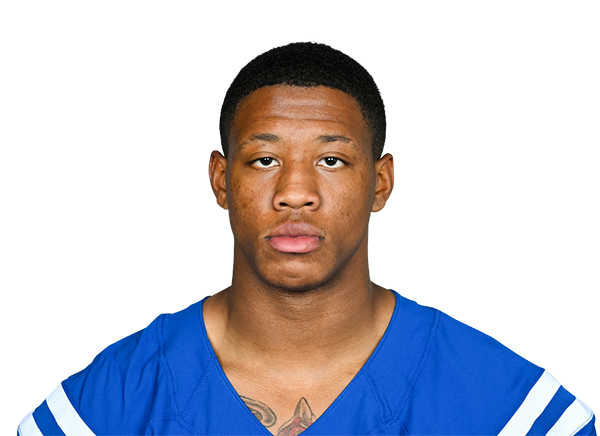 Jaylon JonesCB$1.8M$2.0M · 1 yr left−610% snaps
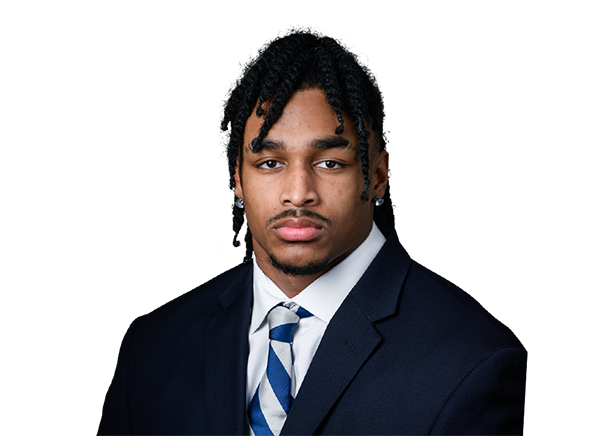 Kevin Winston Jr.S$1.5M$1.6M · 3 yrs left+2473% snaps
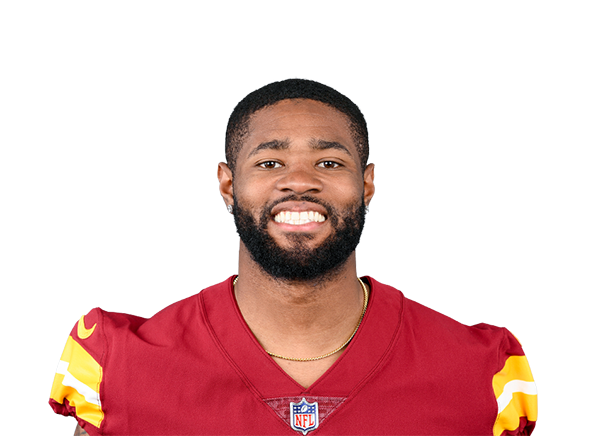 Terrell BurgessS$1.1M$1.2M · 1 yr left+1210% snaps
 Marcus HarrisCB$1.1M$1.1M · 3 yrs left+4256% snaps
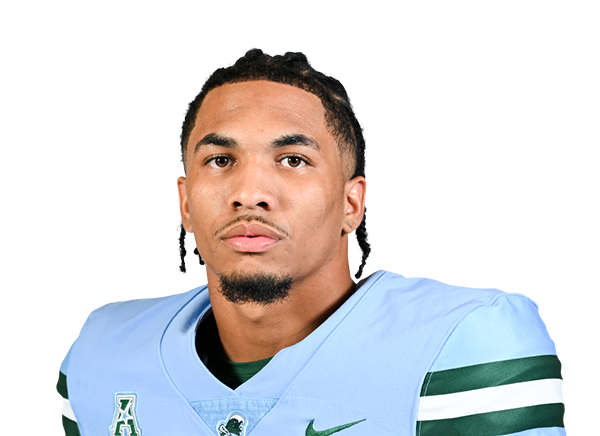 Micah RobinsonCB$1.0M$923K · 1 yr left+2520% snaps
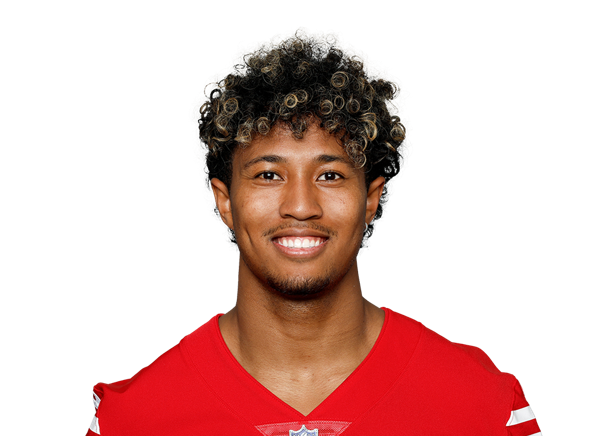 Jakob RobinsonCB$206K$248K · 1 yr left−30% snaps
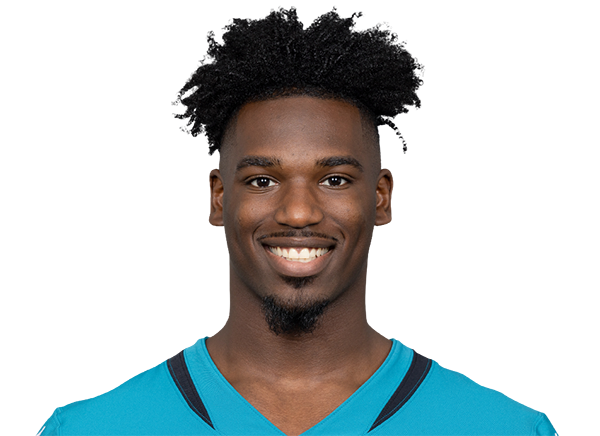 Erick Hallett IICB$165K$248K · 1 yr left+292% snaps
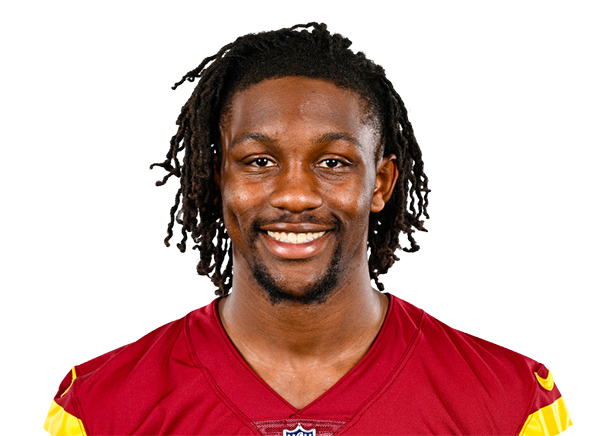 Dominique HamptonS$151K$248K · 1 yr left00% snaps
4 contracts
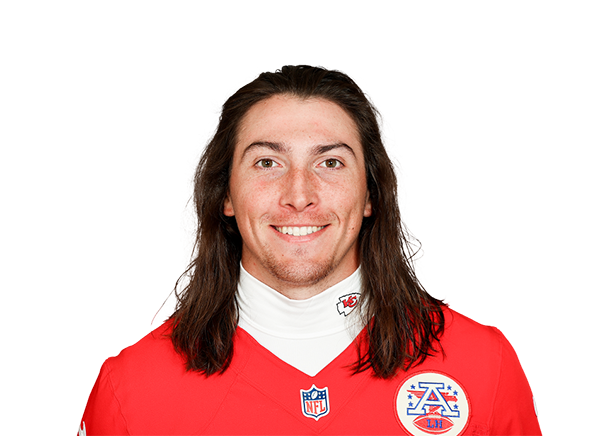
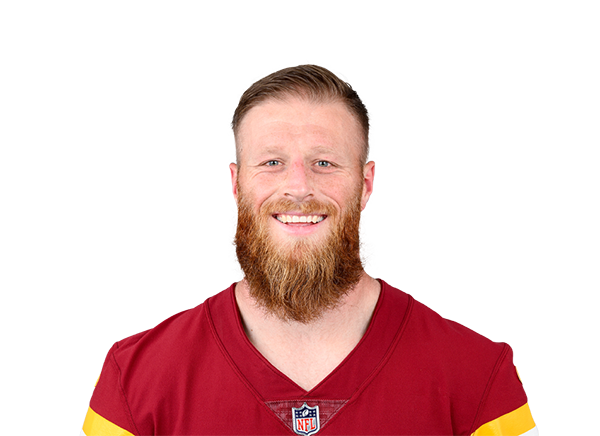
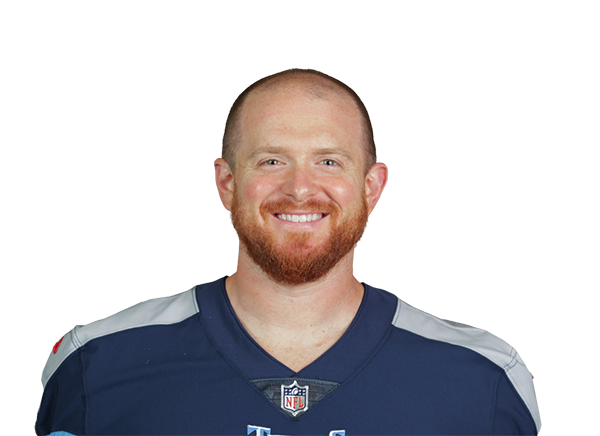
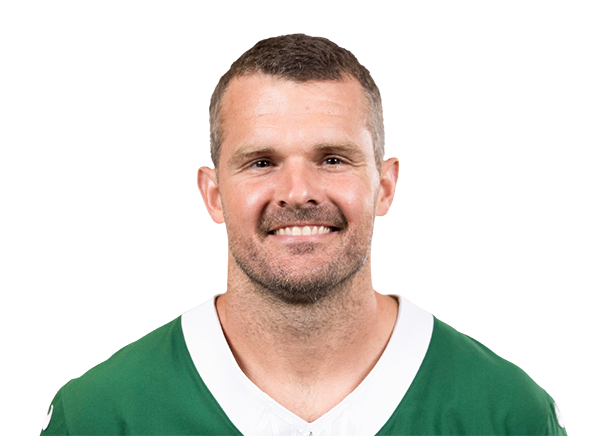
Specialists $5.6M
Gold bar: where the player's pay ranks among his position group league-wide. Green bar: where his play ranks (EPA for skill players, share of snaps for everyone else). Gap = played minus paid, in percentile points.