 Pittsburgh SteelersAsked and Answered: Nov. 10
 New York GiantsGiants Now: Michael Strahan offers high praise of Arvell Reese
 Philadelphia EaglesAAA Official Review: What did the Eagles, Joe Milton learn from the QB's first start?
 Buffalo Bills'There's no panic' | The Bills stay strong through early struggles and injuries in MNF win over the Minnesota Vikings
 Broncos DeskBroncos are 7-2, but the snaps say 4.1 wins and the 11th seed in the conference5 h ago
 Pro Football RumorsSeahawks Interested In Adding WR Depth
 InjuryCarl Granderson: Active → Cleared7 h ago
 ESPNCarson Beck next man up for Cardinals
The LabEvery contract against the field
 Minnesota VikingsThe cap file
64 contracts count $246M against the 2026 cap. 80% of it belongs to players on the field, 18th of 32. $12.9M is injured and $36.7M is healthy but not playing. The biggest building: offensive line, $62.9M, 5th in the league.
↳Bottom line80% of the Vikings cap is on the field (18th of 32). The most money goes to offensive line: $62.9M, 5th in the league.
?How to read this chart
- The skyline above:
- one building per position group, as tall as the cap hit (this season's salary-cap charge) Vikings spend on it, on the same scale as every other team. Lit windows are the share of that money on players who are actually on the field; dark windows are injured or idle money.
- The cards below:
- the same money in numbers. The bar fills with the share on the field, and "in spend" ranks the team among all 32 for that group.
Quarterbacks$4.3M30% on the field · 31st in spend
Running backs$18.4M56% on the field · 4th in spend
Wide receivers$37.9M96% on the field · 6th in spend
Tight ends$27.7M56% on the field · 1st in spend
Offensive line$62.9M87% on the field · 5th in spend
Defensive line$38.2M89% on the field · 28th in spend
Linebackers$20.1M66% on the field · 10th in spend
Secondary$33.3M84% on the field · 23rd in spend
Specialists$3.6M100% on the field · 23rd in spend
Best value on the roster
Earning more than they cost
↳Bottom lineBest value on the roster: Jalen Redmond, played 98th and paid 28th among DLs.
?How to read the contract tables
- One row = one contract.
- 2026 cap hit, average per year and years left.
- Paid / played bars:
- the gold bar is where his pay ranks among players at his position across the league, the green bar where his play ranks (EPA, expected points added, for QB, RB, WR, TE; share of snaps for everyone else). Full bar = top of the league.
- Gap:
- played rank minus paid rank, in percentile points. Positive (green) means he gives more than he costs; negative (red) means the opposite.
2 contracts
Quarterbacks $4.3M
Player2026 capPer yearPaid / playedGapEPA
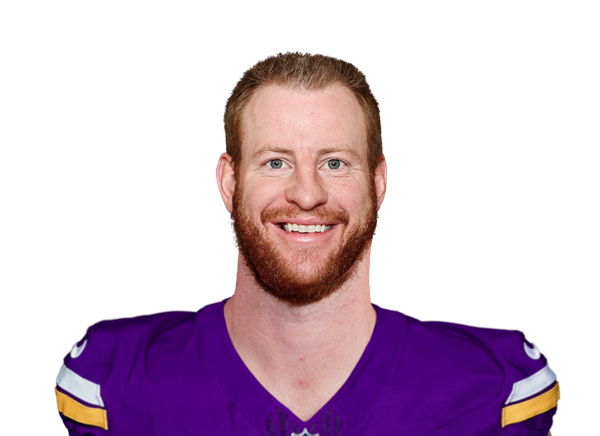 Carson WentzQB$3.0M$3.0M · 1 yr left−12-21.1 EPA
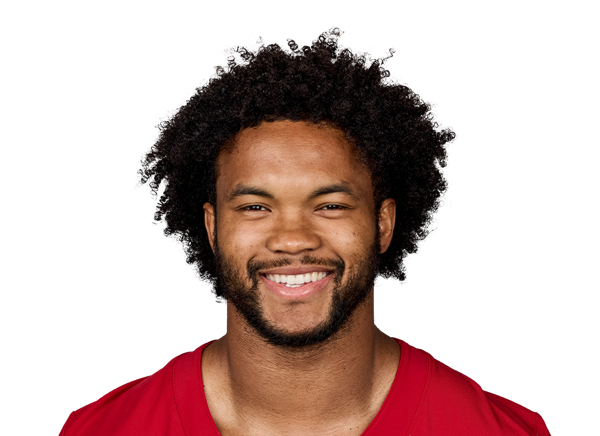 Kyler MurrayQB$1.3M$1.3M · 1 yr left+8-15.3 EPA
4 contracts
Running backs $18.4M
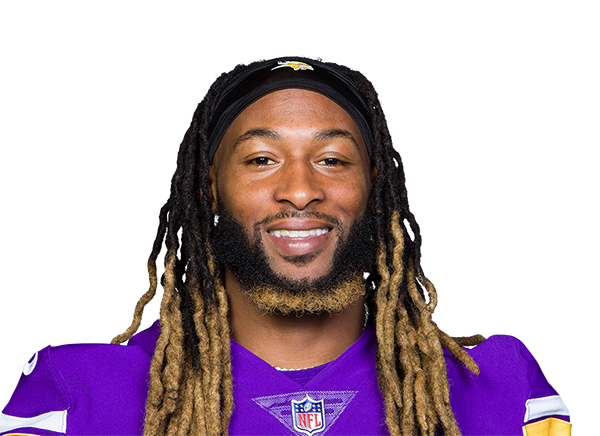
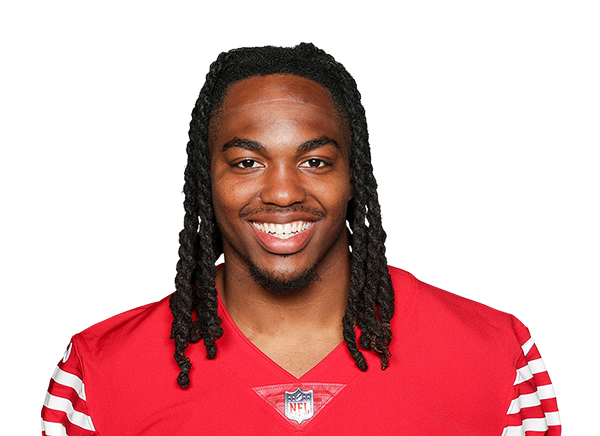
7 contracts
Wide receivers $37.9M
Player2026 capPer yearPaid / playedGapEPA
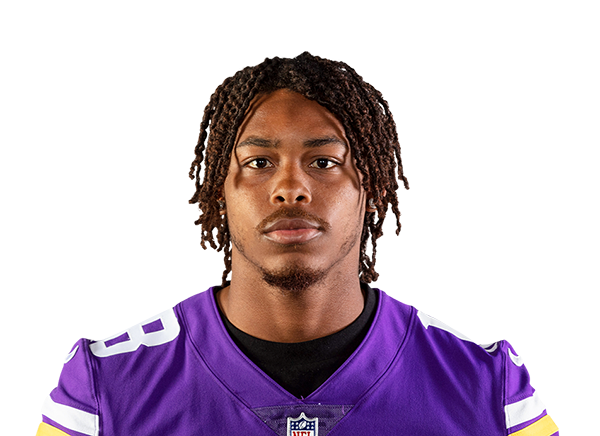 Justin JeffersonWR$21.2M$35.0M · 2 yrs left−20+8.0 EPA
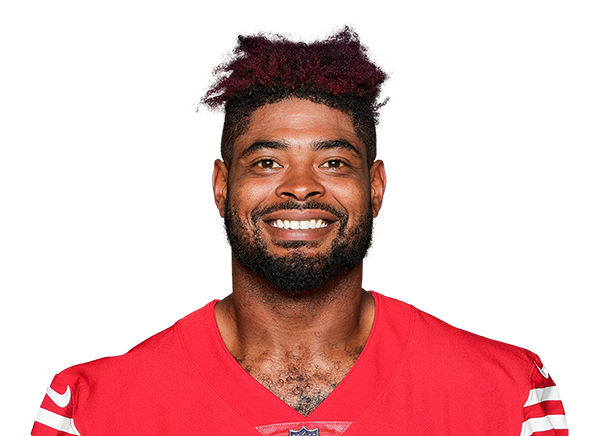 Jauan JenningsWR$9.5M$8.0M · 1 yr left−53-4.5 EPA
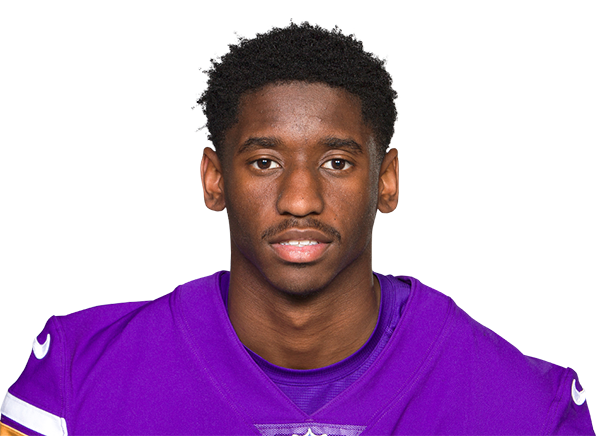 Jordan AddisonWR$4.3M$3.4M · 1 yr left−43-7.6 EPA
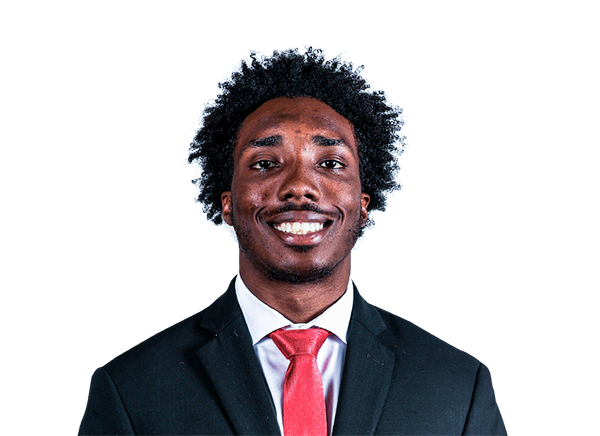 Tai FeltonWR$1.4M$1.5M · 3 yrs left−5-0.8 EPA
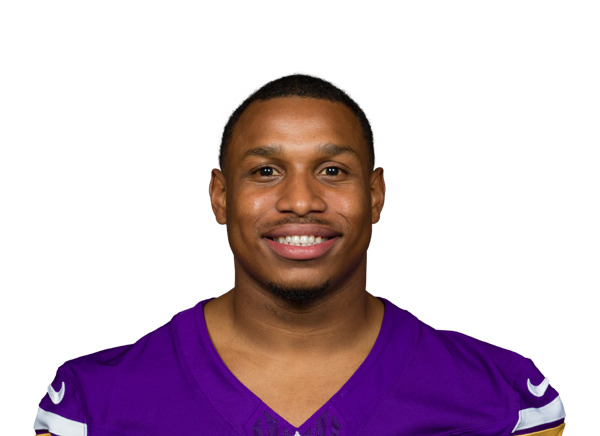 Myles PriceWR$1.0M$988K · 2 yrs left+3-14.1 EPA
 Michael BriscoeWR$248K$248K · 1 yr left−7+0.0 EPA
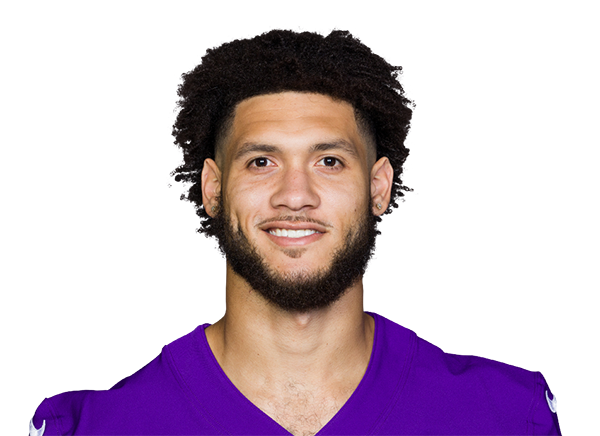 Jeshaun JonesWR$228K$248K · 1 yr left+55+2.1 EPA
5 contracts
Tight ends $27.7M
13 contracts
Offensive line $62.9M
Player2026 capPer yearPaid / playedGapSnaps
 Will FriesRG$17.2M$17.5M · 4 yrs left−1299% snaps
 Brian O'NeillRT$14.6M$24.0M · 4 yrs left−1199% snaps
 Christian DarrisawLT$13.3M$26.0M · 2 yrs left−2476% snaps
 Blake BrandelLT$4.5M$3.2M · 1 yr left+13100% snaps
 Ryan Van DemarkRT$4.3M$4.3M · 1 yr left−1924% snaps
 Donovan JacksonLT · injured$3.9M$4.3M · 3 yrs left−1142% snaps
 Caleb TiernanLT$1.7M$1.7M · 4 yrs left−153% snaps
 Michael JurgensC$1.1M$1.0M · 2 yrs left−330% snaps
 Joe HuberRG$1.0M$992K · 2 yrs left+3958% snaps
 Nick SamacC · injured$622K$1.0M · 1 yr left−190% snaps
 Henry ByrdRG$248K$248K · 1 yr left−40% snaps
 Jack NelsonLT$248K$248K · 1 yr left−40% snaps
 Josh PriebeLG$206K$248K · 1 yr left−30% snaps
14 contracts
Defensive line $38.2M
Player2026 capPer yearPaid / playedGapSnaps
 Andrew Van GinkelED$19.3M$23.0M · final year+284% snaps
 Caleb BanksIDL$5.3M$5.3M · 4 yrs left−2925% snaps
 Dallas TurnerED$4.3M$3.9M · 2 yrs left+2681% snaps
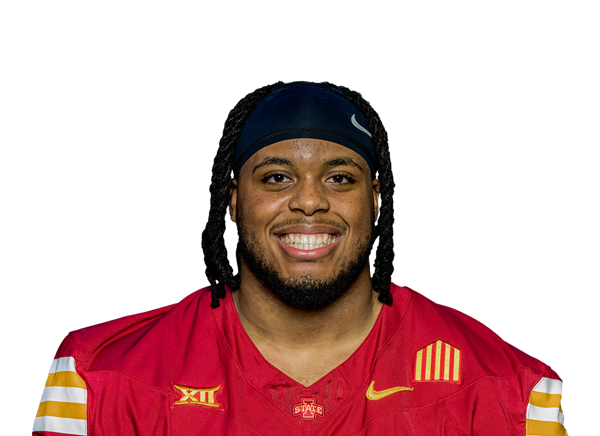 Domonique OrangeIDL$1.7M$1.7M · 4 yrs left−227% snaps
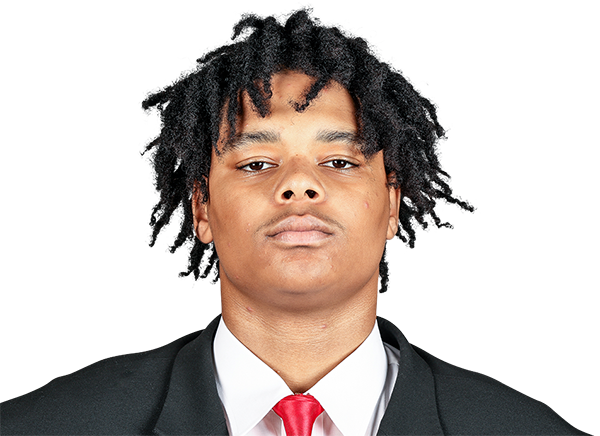 Tyrion Ingram-DawkinsED$1.1M$1.2M · 3 yrs left+4961% snaps
 Levi Drake RodriguezIDL$1.1M$1.0M · 2 yrs left+5159% snaps
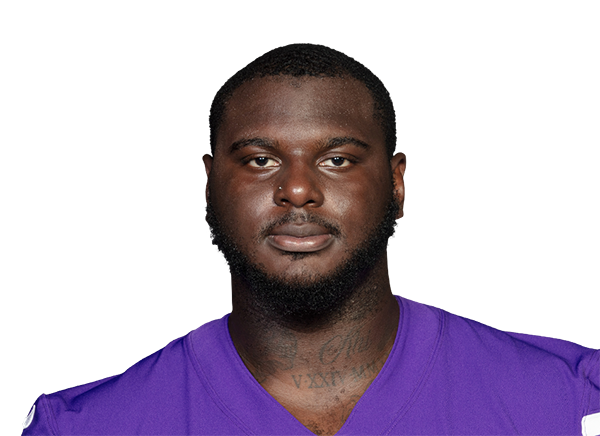 Jalen RedmondIDL$1.1M$1.1M · 1 yr left+7082% snaps
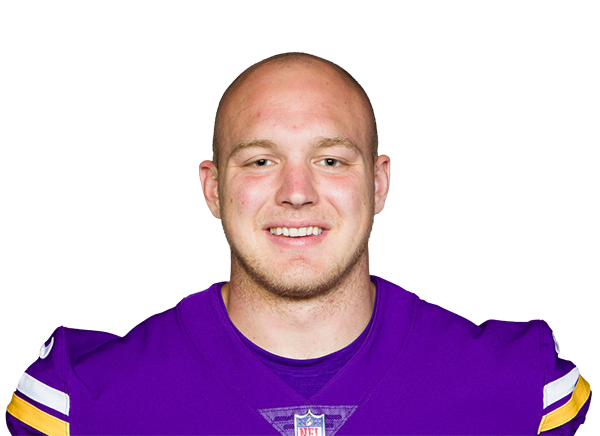 Bo RichterED$1.1M$1.1M · 1 yr left−280% snaps
 Chaz ChamblissED$1.0M$995K · 2 yrs left−240% snaps
 Elijah WilliamsED$1.0M$988K · 2 yrs left−220% snaps
 Tyler BattyED · injured$548K$997K · 2 yrs left−170% snaps
 Jahvaree RitzieIDL$248K$248K · 1 yr left−60% snaps
 Keshawn BanksED$206K$248K · 1 yr left−30% snaps
 Taki TaimaniIDL$151K$248K · 1 yr left−10% snaps
6 contracts
Linebackers $20.1M
Player2026 capPer yearPaid / playedGapSnaps
 Blake CashmanLB$9.2M$7.5M · 1 yr left−596% snaps
 Eric WilsonLB$4.1M$7.5M · 3 yrs left+995% snaps
 Ivan Pace Jr.LB$3.5M$3.5M · 1 yr left−2314% snaps
 Jake GoldayLB$2.4M$2.4M · 4 yrs left−245% snaps
 Jamal AdamsLB · injured$675K$1.4M · 1 yr left−170% snaps
 Bangally KamaraLB$248K$248K · 1 yr left−10% snaps
10 contracts
Secondary $33.3M
Player2026 capPer yearPaid / playedGapSnaps
 Byron Murphy Jr.CB$8.3M$18.0M · 2 yrs left−291% snaps
 Isaiah RodgersCB$7.9M$5.5M · 1 yr left−288% snaps
 Joshua MetellusS$6.0M$12.0M · 2 yrs left+13100% snaps
 James PierreCB$3.0M$4.3M · 2 yrs left−1041% snaps
 Theo JacksonS$2.7M$3.1M · 2 yrs left+159% snaps
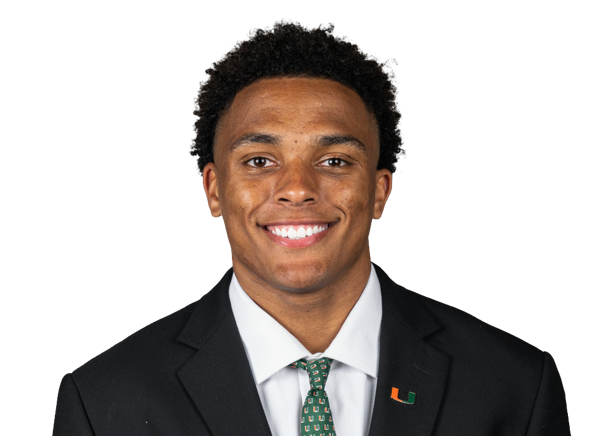 Jakobe ThomasS$1.7M$1.7M · 4 yrs left−580% snaps
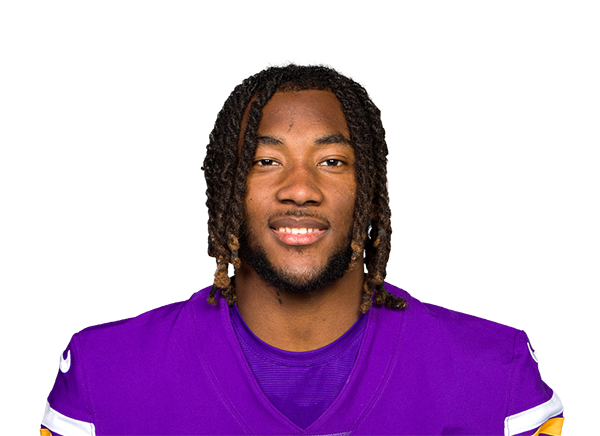 Jay WardS$1.3M$1.1M · 1 yr left−191% snaps
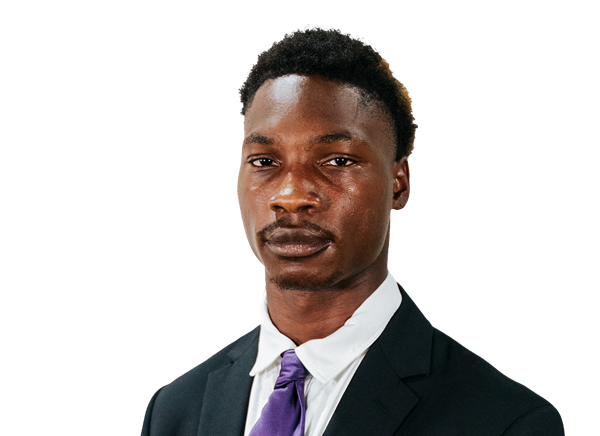 Charles DemmingsCB$1.2M$1.2M · 4 yrs left−130% snaps
 Jacob ThomasS$1.0M$1.0M · 3 yrs left+127% snaps
 Da'Veawn ArmsteadCB$248K$248K · 1 yr left−50% snaps
3 contracts
Specialists $3.6M
Player2026 capPer yearPaid / playedGapSnaps
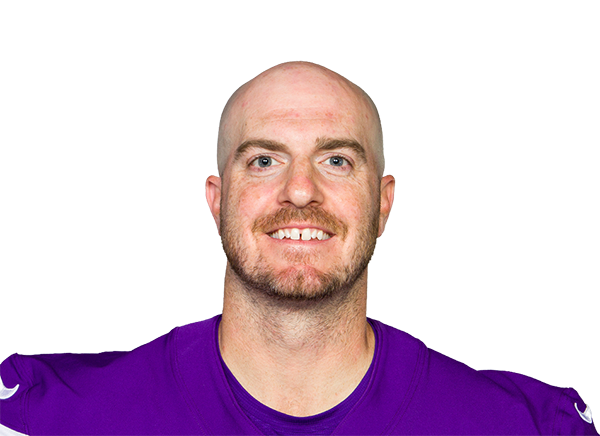 Andrew DePaolaLS$1.5M$1.7M · 1 yr left+1414% snaps
 Will ReichardK$1.1M$1.0M · 2 yrs left+4815% snaps
 Brett ThorsonP$1.0M$1.0M · 3 yrs left−89% snaps
Gold bar: where the player's pay ranks among his position group league-wide. Green bar: where his play ranks (EPA for skill players, share of snaps for everyone else). Gap = played minus paid, in percentile points.