 Pittsburgh SteelersAsked and Answered: Nov. 10
 New York GiantsGiants Now: Michael Strahan offers high praise of Arvell Reese
 Philadelphia EaglesAAA Official Review: What did the Eagles, Joe Milton learn from the QB's first start?
 Buffalo Bills'There's no panic' | The Bills stay strong through early struggles and injuries in MNF win over the Minnesota Vikings
 ESPNVikings left at QB crossroads after Carson Wentz's poor MNF showing vs. Bills
 Broncos DeskBroncos are 7-2, but the snaps say 4.1 wins and the 11th seed in the conference5 h ago
 Pro Football RumorsSeahawks Interested In Adding WR Depth
 InjuryCarl Granderson: Active → Cleared7 h ago
 ESPNCarson Beck next man up for Cardinals
The LabEvery contract against the field
 Baltimore RavensThe cap file
67 contracts count $227M against the 2026 cap. 86% of it belongs to players on the field, 6th of 32. $9.1M is injured and $22.6M is healthy but not playing. The biggest building: secondary, $58.1M, 4th in the league.
↳Bottom line86% of the Ravens cap is on the field (6th of 32). The most money goes to secondary: $58.1M, 4th in the league.
?How to read this chart
- The skyline above:
- one building per position group, as tall as the cap hit (this season's salary-cap charge) Ravens spend on it, on the same scale as every other team. Lit windows are the share of that money on players who are actually on the field; dark windows are injured or idle money.
- The cards below:
- the same money in numbers. The bar fills with the share on the field, and "in spend" ranks the team among all 32 for that group.
Quarterbacks$3.8M57% on the field · 32nd in spend
Running backs$11.7M80% on the field · 16th in spend
Wide receivers$20.1M85% on the field · 22nd in spend
Tight ends$12.7M65% on the field · 17th in spend
Offensive line$36.0M73% on the field · 26th in spend
Defensive line$41.5M93% on the field · 26th in spend
Linebackers$38.9M94% on the field · 1st in spend
Secondary$58.1M90% on the field · 4th in spend
Specialists$3.9M100% on the field · 21st in spend
Best value on the roster
Earning more than they cost
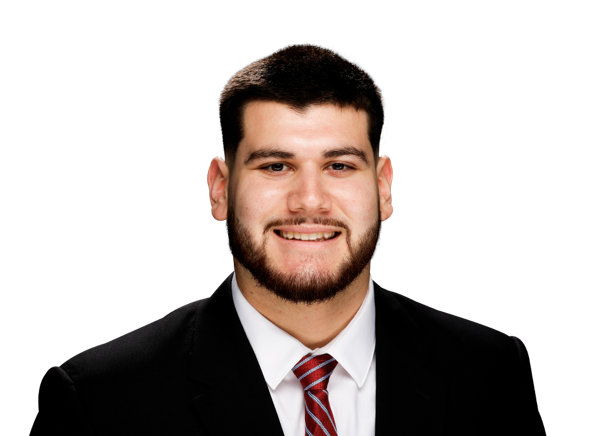
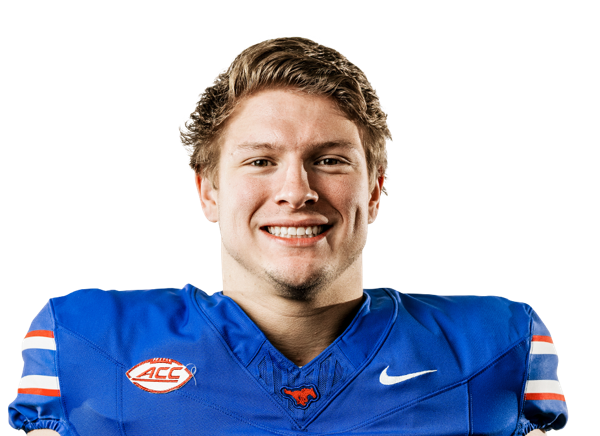
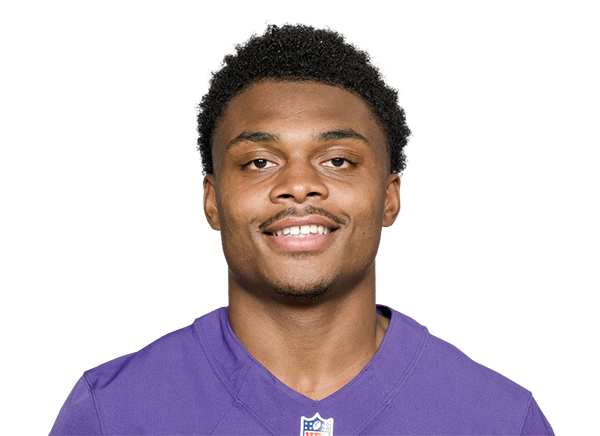
↳Bottom lineBest value on the roster: Josh Cuevas, played 86th and paid 37th among TEs.
?How to read the contract tables
- One row = one contract.
- 2026 cap hit, average per year and years left.
- Paid / played bars:
- the gold bar is where his pay ranks among players at his position across the league, the green bar where his play ranks (EPA, expected points added, for QB, RB, WR, TE; share of snaps for everyone else). Full bar = top of the league.
- Gap:
- played rank minus paid rank, in percentile points. Positive (green) means he gives more than he costs; negative (red) means the opposite.
4 contracts
Quarterbacks $3.8M
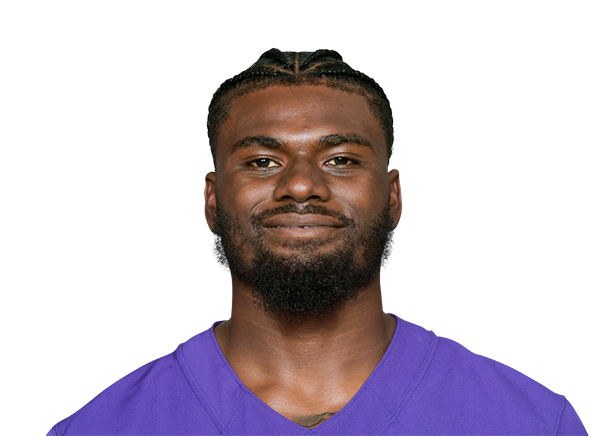

4 contracts
Running backs $11.7M
8 contracts
Wide receivers $20.1M
Player2026 capPer yearPaid / playedGapEPA
 Zay FlowersWR$7.9M$35.0M · 4 yrs left0+15.0 EPA
 Rashod BatemanWR$6.2M$12.3M · 2 yrs left+6+16.5 EPA
 Ja'Kobi LaneWR$1.8M$1.8M · 4 yrs left+7+4.0 EPA
 Elijah SarrattWR$1.4M$1.4M · 4 yrs left+2+0.3 EPA
 Devontez WalkerWR$1.3M$1.2M · 2 yrs left+23+5.1 EPA
 LaJohntay WesterWR$1.1M$1.1M · 3 yrs left+30+3.0 EPA
 Chris MooreWR$297K$411K · 1 yr left+39+2.3 EPA
 Gage LarvadainWR$234K$248K · 1 yr left−6+0.0 EPA
5 contracts
Tight ends $12.7M

13 contracts
Offensive line $36.0M
Player2026 capPer yearPaid / playedGapSnaps
 Ronnie StanleyLT$9.9M$20.0M · 2 yrs left−1684% snaps
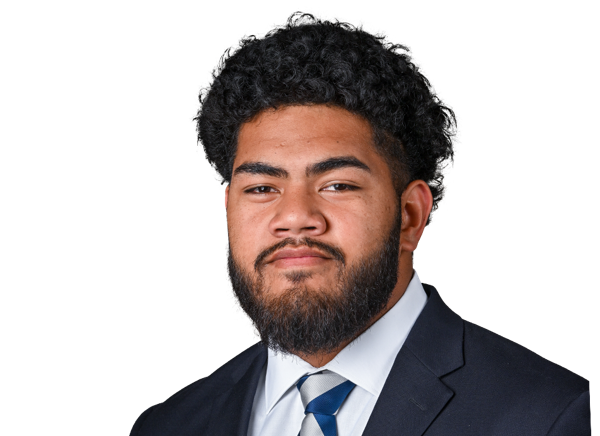 Olaivavega IoaneLG$6.1M$6.1M · 4 yrs left−1182% snaps
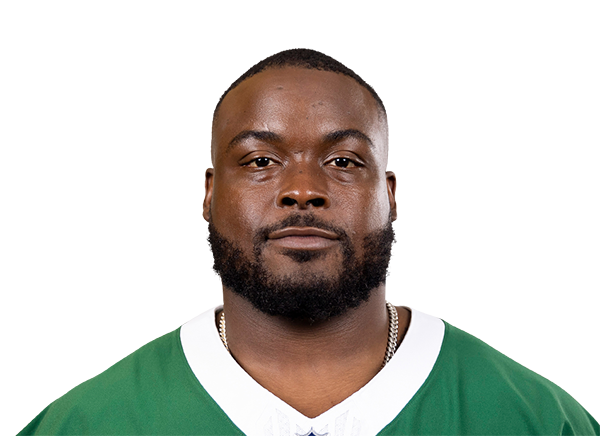 John SimpsonLG$5.0M$10.0M · 3 yrs left+10100% snaps
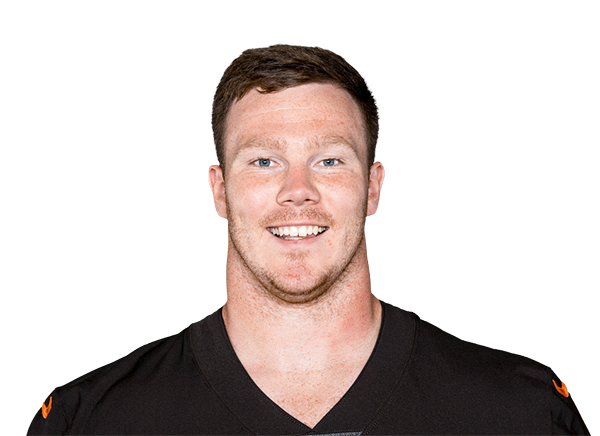 Ethan PocicC$3.7M$3.3M · 1 yr left−312% snaps
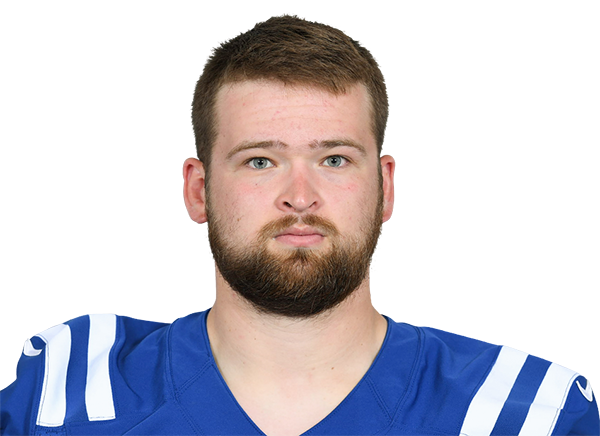 Danny PinterC · injured$2.8M$2.8M · 1 yr left−640% snaps
 Roger RosengartenRT$1.8M$1.6M · 2 yrs left+27100% snaps
 Andrew VorheesLG$1.7M$1.7M · 1 yr left−914% snaps
 Emery Jones Jr.RT$1.4M$1.6M · 3 yrs left+840% snaps
 Jovaughn GwynC$1.2M$1.2M · 1 yr left+1531% snaps
 Carson VinsonLT$1.1M$1.2M · 3 yrs left+1621% snaps
 Cam JurgensC$945K$17.0M · 3 yrs left+4673% snaps
 AJ ArcuriRT$248K$248K · 1 yr left−40% snaps
 Michael JordanLG$202K$330K · 1 yr left−20% snaps
12 contracts
Defensive line $41.5M
Player2026 capPer yearPaid / playedGapSnaps
 Trey HendricksonED$15.0M$28.0M · 4 yrs left−2347% snaps
 Calais CampbellED$6.0M$5.5M · 1 yr left−1145% snaps
 Travis JonesIDL$5.6M$13.5M · 2 yrs left+358% snaps
 Tavius RobinsonED · injured$3.9M$1.1M · 1 yr left+649% snaps
 Broderick Washington Jr.IDL$3.9M$2.0M · 1 yr left−1629% snaps
 Zion YoungED$2.8M$2.8M · 4 yrs left−137% snaps
 Mike GreenED$1.7M$1.9M · 3 yrs left+2451% snaps
 Aeneas PeeblesIDL$1.0M$1.1M · 3 yrs left+35% snaps
 Ethan BurkeED$1.0M$1.0M · 3 yrs left+1820% snaps
 Rayshaun BennyIDL$248K$248K · 1 yr left−60% snaps
 Kaimon RuckerED$248K$248K · 1 yr left−60% snaps
 Carl JonesED$165K$248K · 1 yr left−10% snaps
4 contracts
Linebackers $38.9M
13 contracts
Secondary $58.1M
Player2026 capPer yearPaid / playedGapSnaps
 Marlon HumphreyCB$26.3M$19.5M · final year−2079% snaps
 Kyle HamiltonS$10.7M$25.1M · 3 yrs left−493% snaps
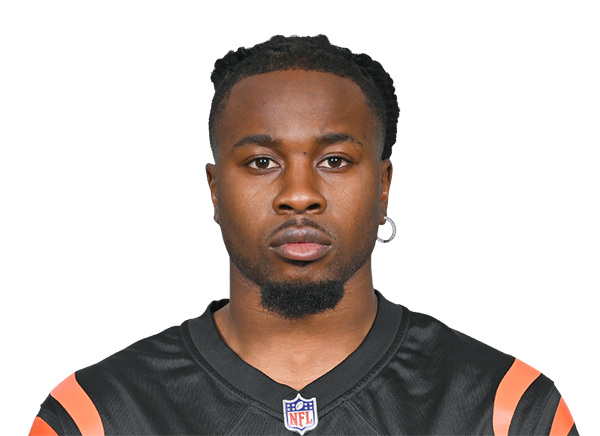 Chidobe AwuzieCB$5.0M$5.0M · 1 yr left−2929% snaps
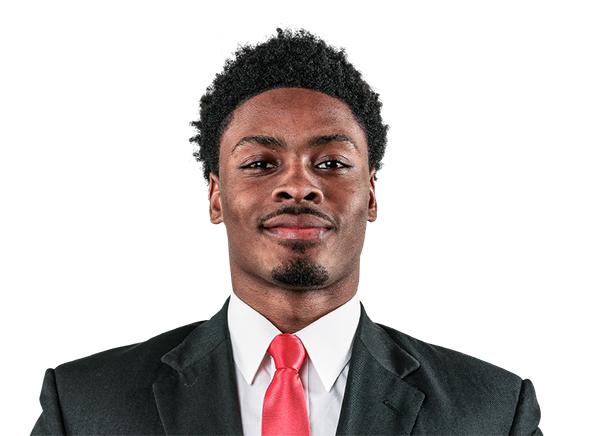 Malaki StarksS$3.8M$4.1M · 3 yrs left+1898% snaps
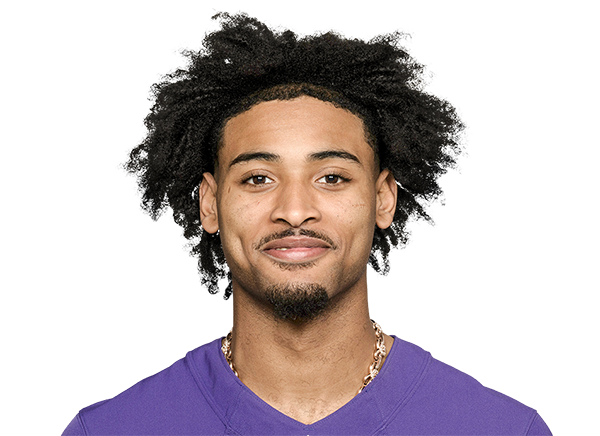 Nate WigginsCB$3.5M$3.2M · 2 yrs left+1085% snaps
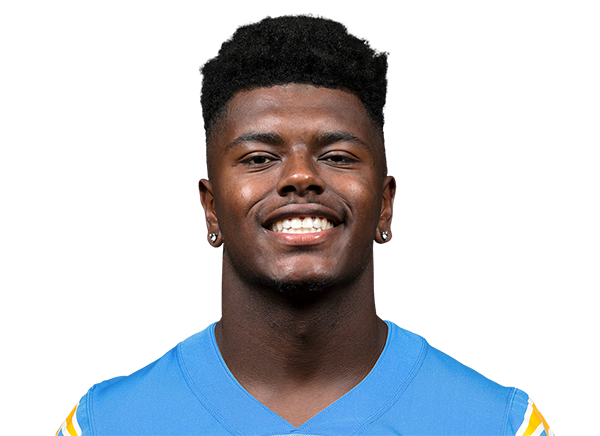 Jaylinn HawkinsS$3.1M$5.0M · 2 yrs left−455% snaps
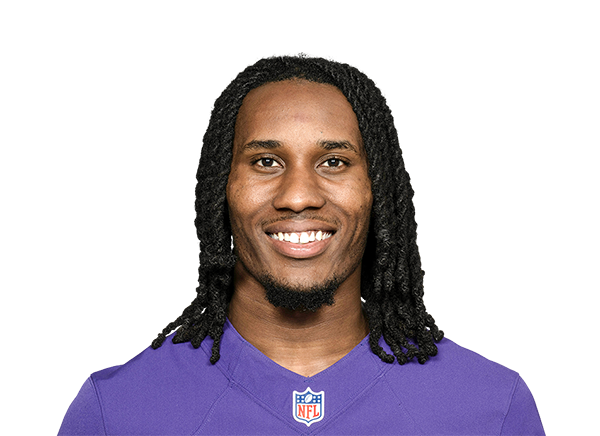 T.J. TampaCB$1.2M$1.2M · 2 yrs left−59% snaps
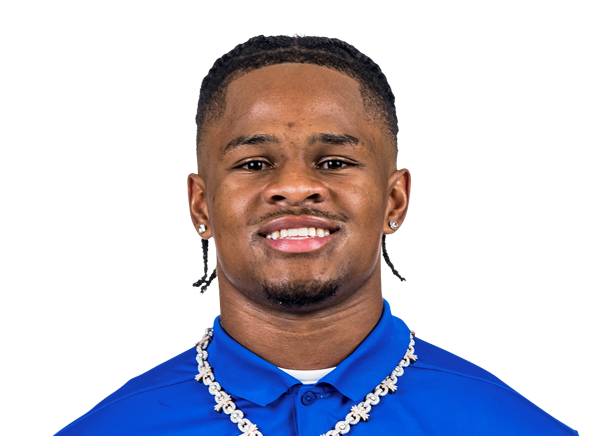 Chandler RiversCB$1.2M$1.2M · 4 yrs left+418% snaps
 Jahquez RobinsonS · injured$1.0M$1.0M · 3 yrs left−230% snaps
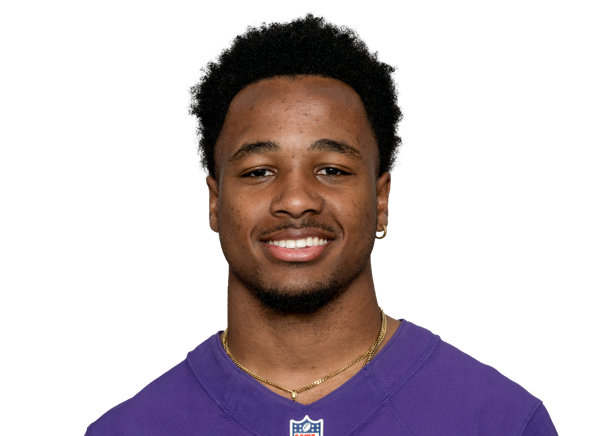 Keyon MartinCB$1.0M$988K · 2 yrs left+2418% snaps
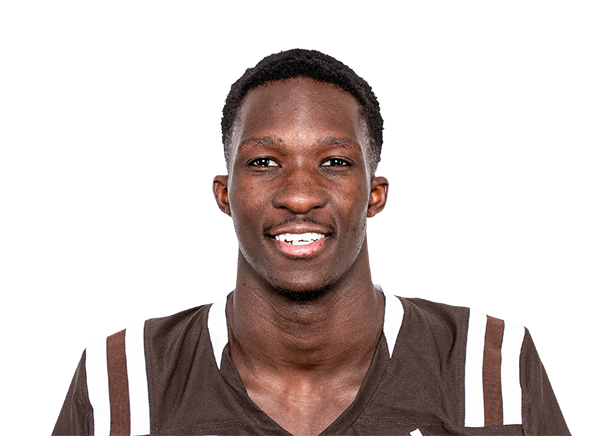 Bilhal KoneCB · injured$584K$1.1M · 3 yrs left−170% snaps
 Amani OruwariyeCB$388K$411K · 1 yr left−130% snaps
 Rayshawn JenkinsS$202K$330K · 1 yr left+4725% snaps
4 contracts
Specialists $3.9M
Gold bar: where the player's pay ranks among his position group league-wide. Green bar: where his play ranks (EPA for skill players, share of snaps for everyone else). Gap = played minus paid, in percentile points.