 New York GiantsGiants Now: Michael Strahan offers high praise of Arvell Reese
 Philadelphia EaglesAAA Official Review: What did the Eagles, Joe Milton learn from the QB's first start?
 Buffalo Bills'There's no panic' | The Bills stay strong through early struggles and injuries in MNF win over the Minnesota Vikings
 ESPNVikings left at QB crossroads after Carson Wentz's poor MNF showing vs. Bills
 Broncos DeskBroncos are 7-2, but the snaps say 4.1 wins and the 11th seed in the conference5 h ago
 Pro Football RumorsSeahawks Interested In Adding WR Depth
 InjuryCarl Granderson: Active → Cleared7 h ago
 ESPNCarson Beck next man up for Cardinals
The LabEvery contract against the field
 Pittsburgh SteelersThe cap file
71 contracts count $257M against the 2026 cap. 81% of it belongs to players on the field, 15th of 32. $19.7M is injured and $29.8M is healthy but not playing. The biggest building: defensive line, $93.2M, 1st in the league.
↳Bottom line81% of the Steelers cap is on the field (15th of 32). The most money goes to defensive line: $93.2M, 1st in the league.
?How to read this chart
- The skyline above:
- one building per position group, as tall as the cap hit (this season's salary-cap charge) Steelers spend on it, on the same scale as every other team. Lit windows are the share of that money on players who are actually on the field; dark windows are injured or idle money.
- The cards below:
- the same money in numbers. The bar fills with the share on the field, and "in spend" ranks the team among all 32 for that group.
Quarterbacks$7.5M0% on the field · 27th in spend
Running backs$4.9M77% on the field · 32nd in spend
Wide receivers$31.5M84% on the field · 11th in spend
Tight ends$12.9M80% on the field · 15th in spend
Offensive line$21.0M77% on the field · 31st in spend
Defensive line$93.2M88% on the field · 1st in spend
Linebackers$27.9M86% on the field · 3rd in spend
Secondary$51.2M73% on the field · 7th in spend
Specialists$7.3M100% on the field · 7th in spend
Best value on the roster
Earning more than they cost
↳Bottom lineBest value on the roster: Mason McCormick, played 87th and paid 46th among OLs.
?How to read the contract tables
- One row = one contract.
- 2026 cap hit, average per year and years left.
- Paid / played bars:
- the gold bar is where his pay ranks among players at his position across the league, the green bar where his play ranks (EPA, expected points added, for QB, RB, WR, TE; share of snaps for everyone else). Full bar = top of the league.
- Gap:
- played rank minus paid rank, in percentile points. Positive (green) means he gives more than he costs; negative (red) means the opposite.
3 contracts
Quarterbacks $7.5M
Player2026 capPer yearPaid / playedGapEPA
 Mason RudolphQB$4.6M$3.8M · 1 yr left−2-2.5 EPA
 Drew AllarQB$1.8M$1.8M · 4 yrs left−46+0.0 EPA
 Will HowardQB$1.1M$1.1M · 3 yrs left−26+0.0 EPA
2 contracts
Running backs $4.9M
Player2026 capPer yearPaid / playedGapEPA
 Rico DowdleRB$3.8M$6.1M · 2 yrs left−26-5.2 EPA
 Eli HeidenreichRB$1.1M$1.1M · 4 yrs left−39+0.0 EPA
9 contracts
Wide receivers $31.5M
Player2026 capPer yearPaid / playedGapEPA
 DK MetcalfWR$13.2M$33.0M · 3 yrs left−50-1.0 EPA
 Michael Pittman Jr.WR · injured$8.9M$17.5M · 2 yrs left−27+2.4 EPA
 Ben SkowronekWR$2.8M$2.3M · 1 yr left−9+1.7 EPA
 Germie BernardWR$2.6M$2.6M · 4 yrs left−22-1.3 EPA
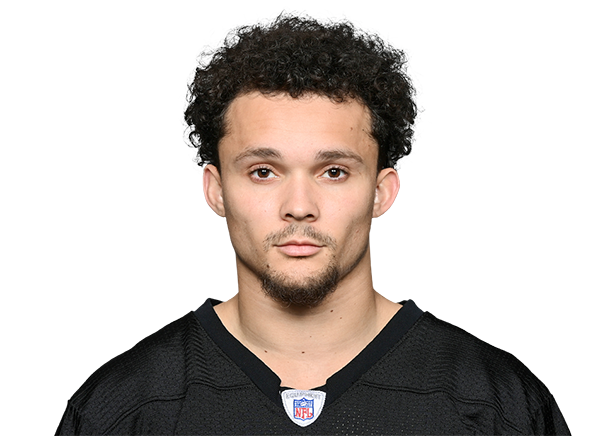 Roman WilsonWR · injured$1.6M$1.4M · 2 yrs left+17+6.3 EPA
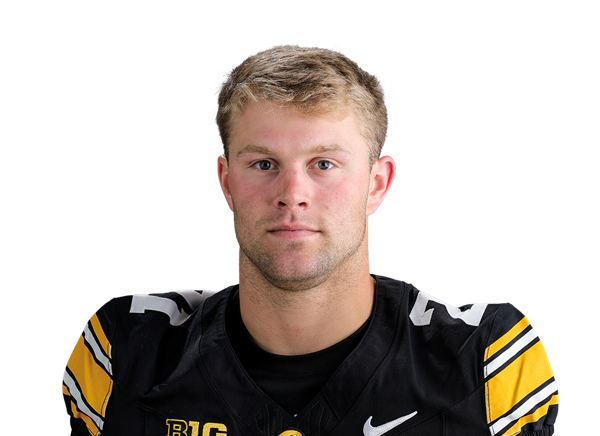 Kaden WetjenWR$1.4M$1.4M · 4 yrs left−51+0.0 EPA
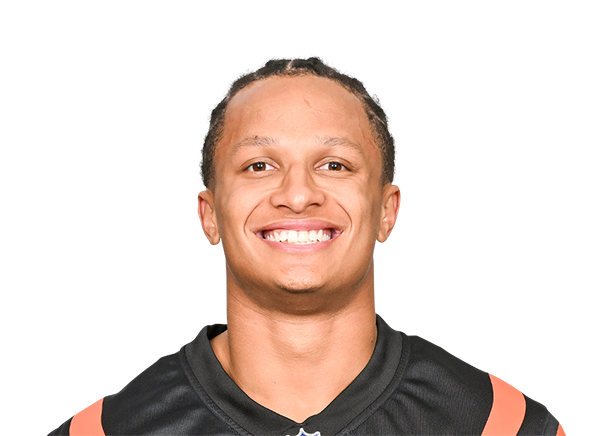 Cole BurgessWR · injured$515K$885K · 1 yr left−26+0.0 EPA
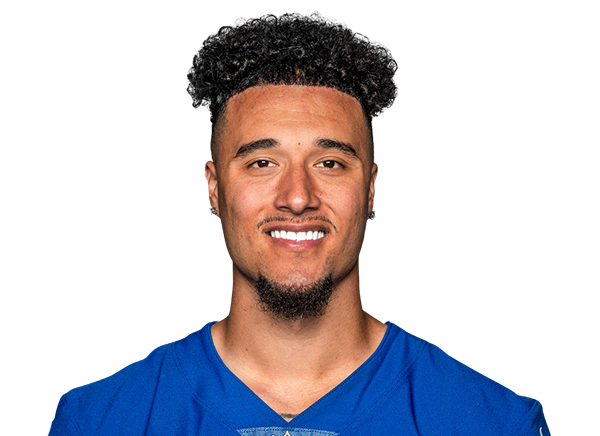 Isaiah HodginsWR$294K$330K · 1 yr left−22+0.0 EPA
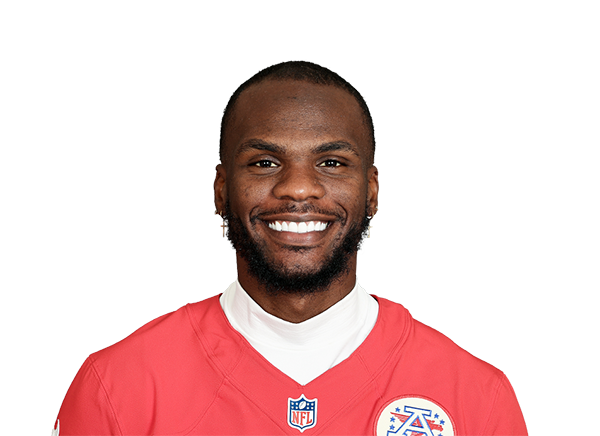 Marquez Valdes-ScantlingWR$220K$330K · 1 yr left+30-8.6 EPA
5 contracts
Tight ends $12.9M
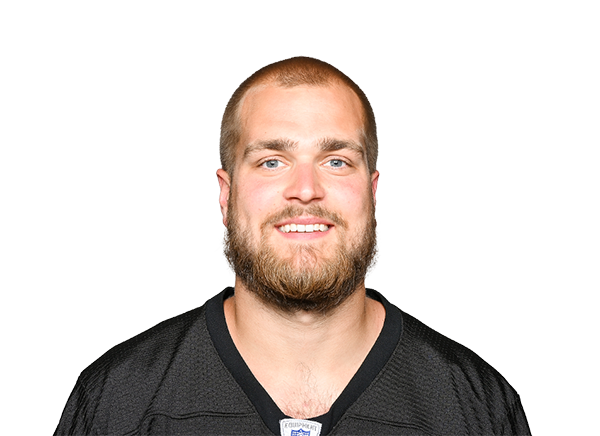
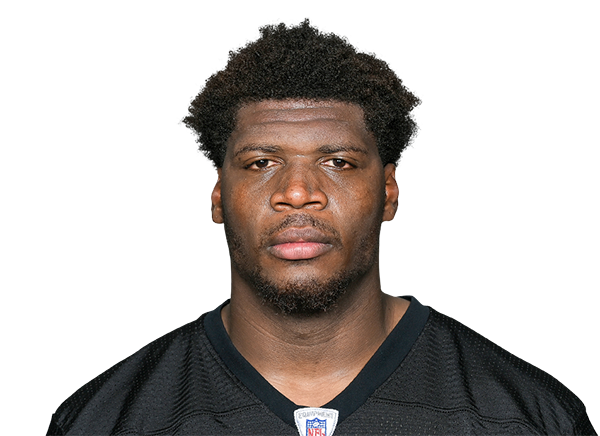
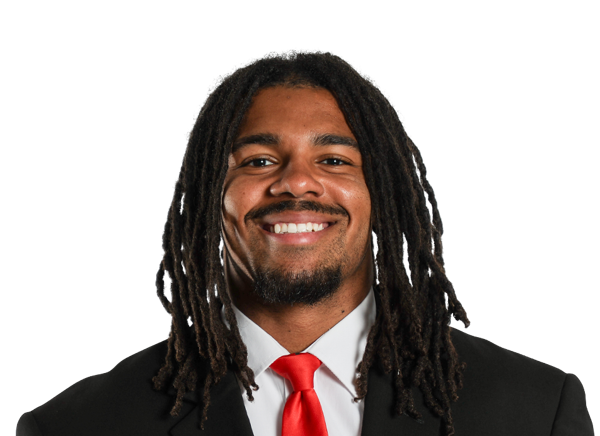

11 contracts
Offensive line $21.0M
Player2026 capPer yearPaid / playedGapSnaps
 Max IheanachorRT$5.2M$5.2M · 4 yrs left−1075% snaps
 Troy FautanuLG$4.1M$3.8M · 2 yrs left+14100% snaps
 Brock HoffmanRG$2.5M$2.5M · 1 yr left+675% snaps
 Zach FrazierC$2.1M$1.9M · 2 yrs left+27100% snaps
 Gennings DunkerLG · injured$1.7M$1.7M · 4 yrs left−560% snaps
 Ryan McCollumC$1.3M$1.3M · 1 yr left−470% snaps
 Mason McCormickLG$1.3M$1.2M · 2 yrs left+41100% snaps
 Jack DriscollRT · injured$1.3M$1.4M · 1 yr left−440% snaps
 Spencer AndersonRG$1.2M$979K · 1 yr left+1731% snaps
 Steven JonesLG$248K$248K · 1 yr left−40% snaps
 Doug NesterLT$248K$248K · 1 yr left−40% snaps
14 contracts
Defensive line $93.2M
Player2026 capPer yearPaid / playedGapSnaps
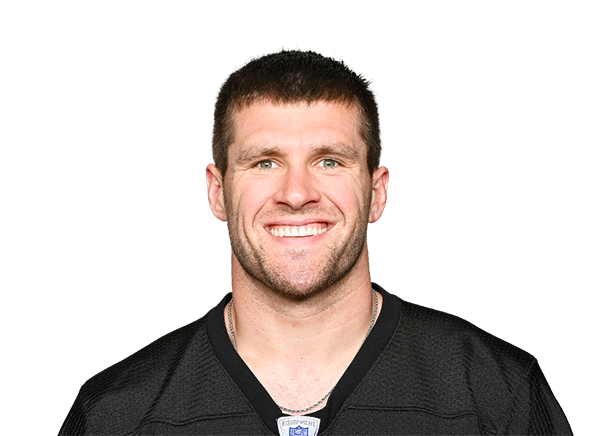 T.J. WattED$42.0M$41.0M · 2 yrs left−1066% snaps
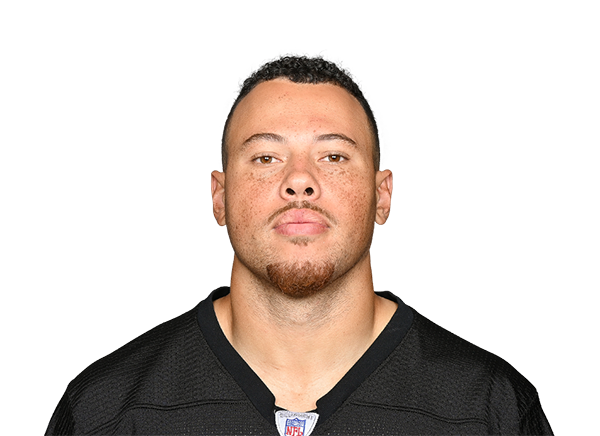 Alex HighsmithED$20.1M$17.0M · 1 yr left−965% snaps
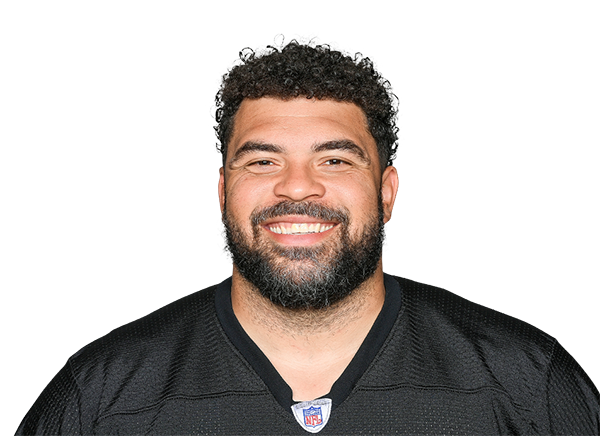 Cameron HeywardIDL$13.7M$18.0M · 1 yr left−763% snaps
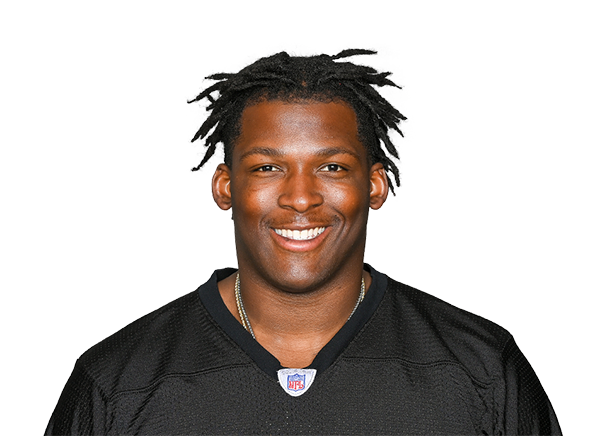 Keeanu BentonIDL$4.3M$18.0M · 4 yrs left+1361% snaps
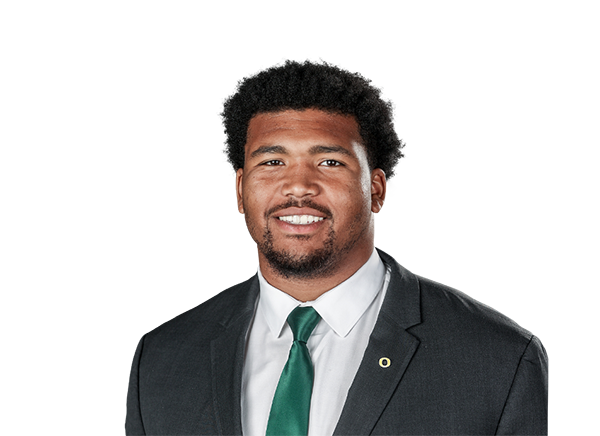 Derrick HarmonIDL · injured$4.1M$4.5M · 3 yrs left−3017% snaps
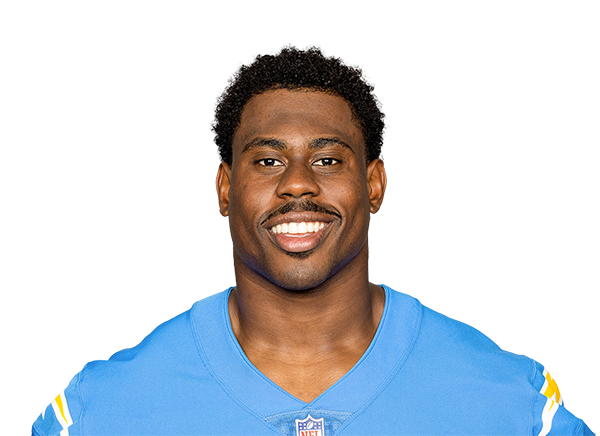 Sebastian Joseph-DayIDL · injured$3.6M$5.5M · 2 yrs left−2418% snaps
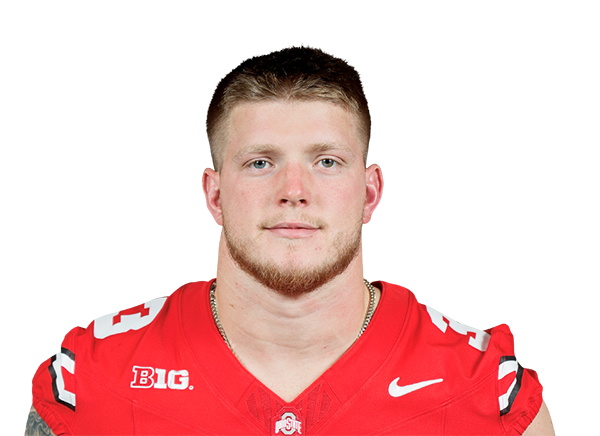 Jack SawyerED$1.2M$1.3M · 3 yrs left+1331% snaps
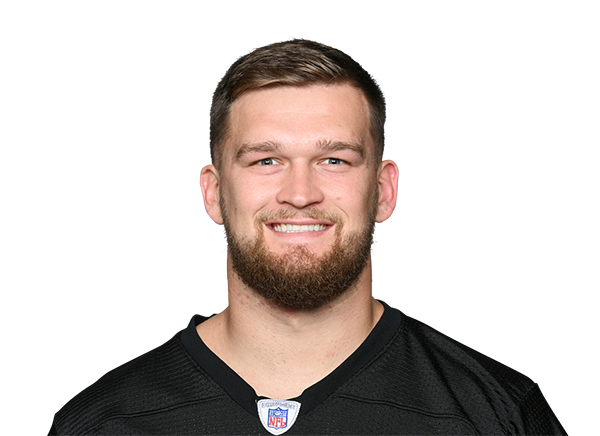 Logan LeeIDL · injured$1.1M$1.1M · 2 yrs left−350% snaps
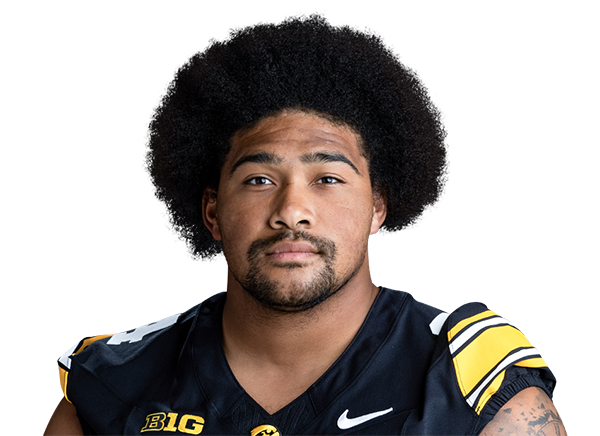 Yahya BlackIDL$1.1M$1.1M · 3 yrs left+3139% snaps
 Kevin Jobity Jr.IDL$1.0M$1.0M · 3 yrs left+45% snaps
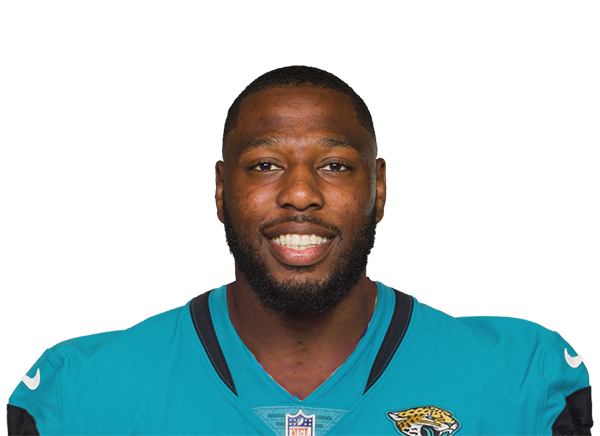 Esezi OtomewoED$411K$411K · 1 yr left−160% snaps
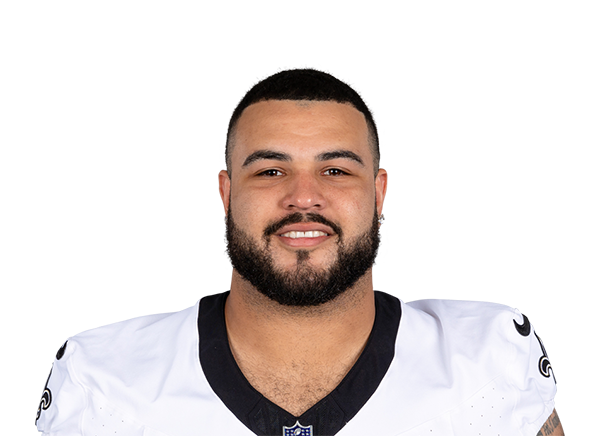 Kyler BaughIDL$248K$248K · 1 yr left−60% snaps
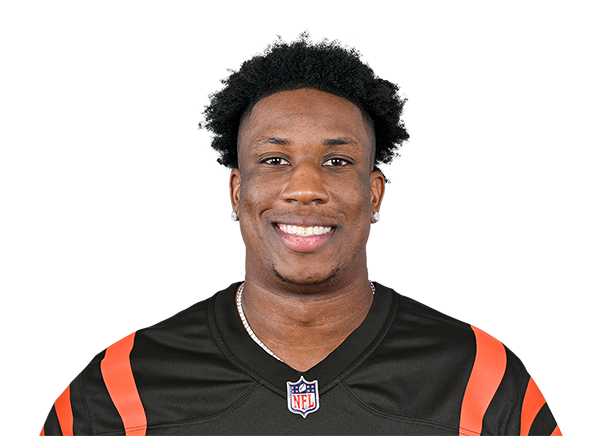 KJ HenryED$193K$248K · 1 yr left−20% snaps
 Julius WelschofED$0K$248K · 1 yr left00% snaps
8 contracts
Linebackers $27.9M
Player2026 capPer yearPaid / playedGapSnaps
 Patrick QueenLB$17.2M$13.7M · 1 yr left0100% snaps
 Nick HerbigLB$5.4M$25.0M · 4 yrs left−1754% snaps
 Cole HolcombLB$2.0M$2.5M · 2 yrs left−214% snaps
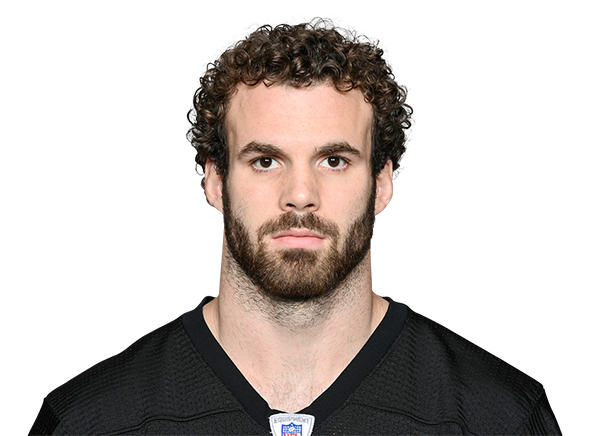 Payton WilsonLB$1.5M$1.4M · 2 yrs left+2686% snaps
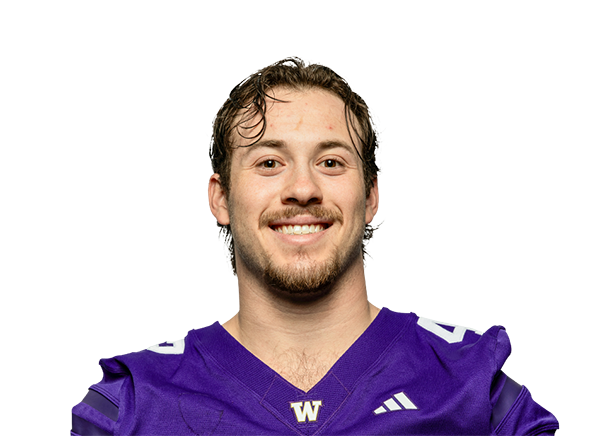 Carson BruenerLB$1.0M$1.1M · 3 yrs left−290% snaps
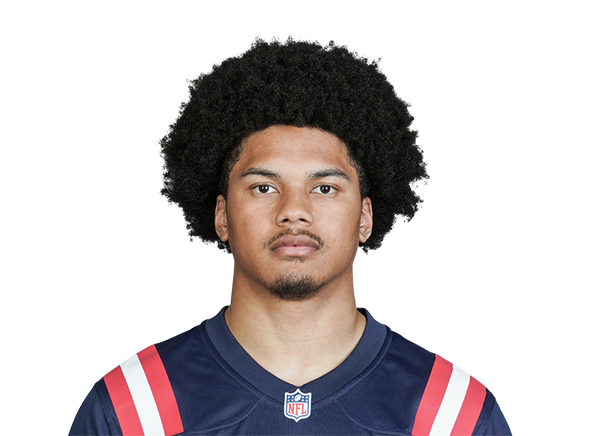 Marte MapuLB$257K$330K · 1 yr left−100% snaps
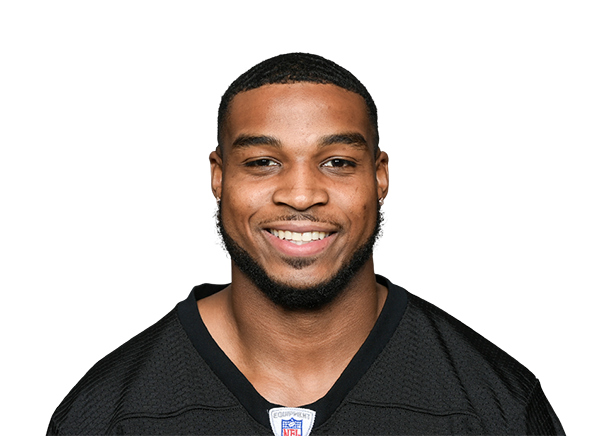 Jacoby WindmonLB$248K$248K · 1 yr left−10% snaps
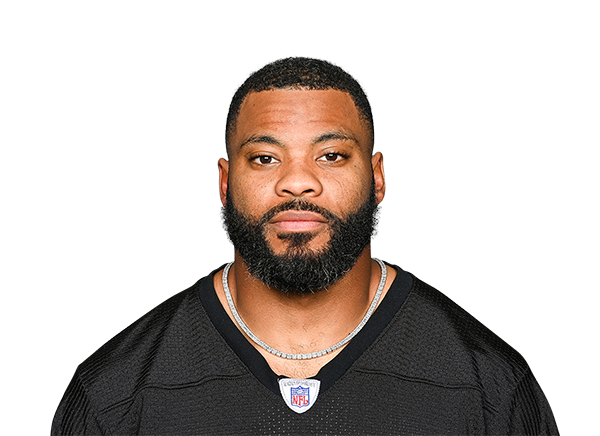 Elandon RobertsLB$239K$330K · 1 yr left−10% snaps
16 contracts
Secondary $51.2M
Player2026 capPer yearPaid / playedGapSnaps
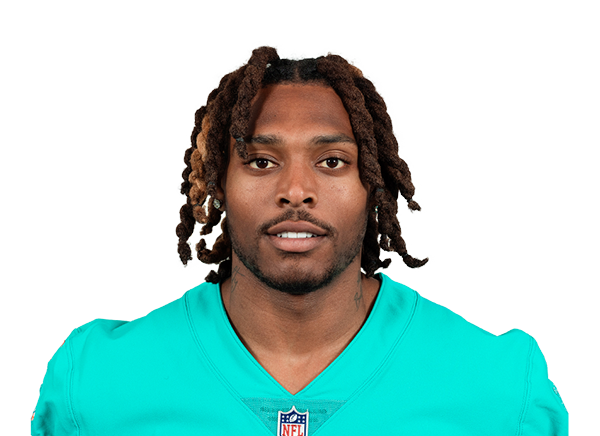 Jalen RamseyCB$19.5M$24.1M · 1 yr left−1100% snaps
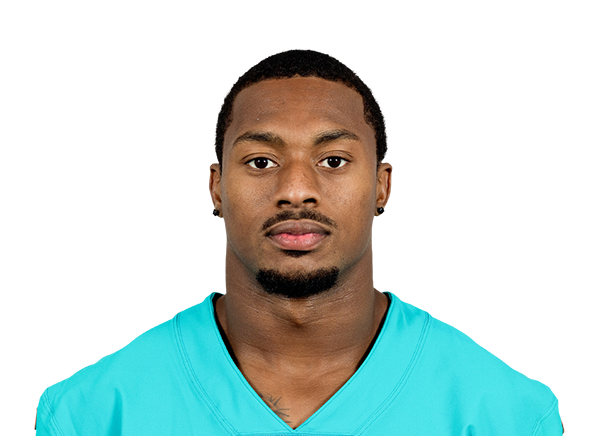 DeShon ElliottS · injured$6.1M$6.3M · 1 yr left−488% snaps
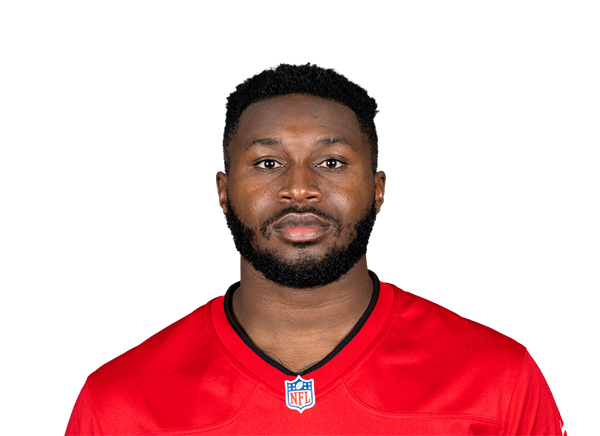 Jamel DeanCB$5.5M$12.3M · 3 yrs left−970% snaps
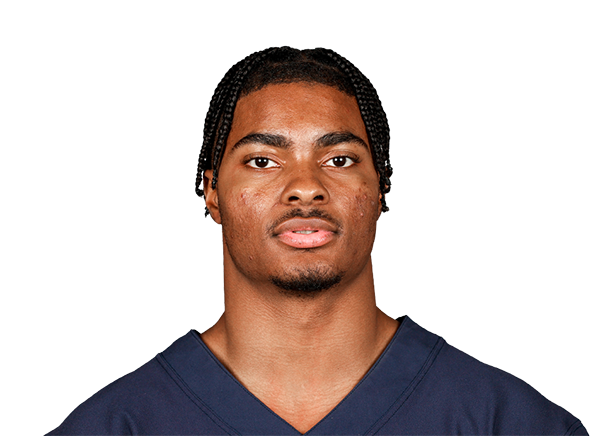 Jaquan BriskerS$5.5M$5.5M · 1 yr left+13100% snaps
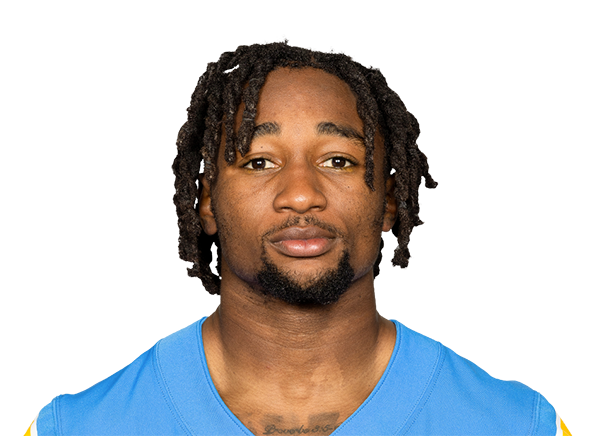 Asante Samuel Jr.CB$4.0M$4.0M · 1 yr left+1194% snaps
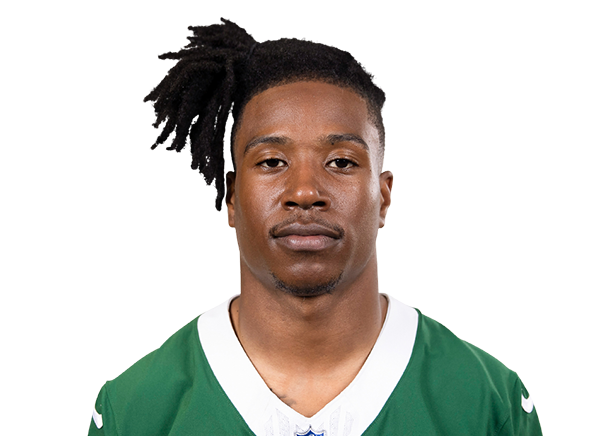 Brandin EcholsCB$3.9M$3.0M · 1 yr left−434% snaps
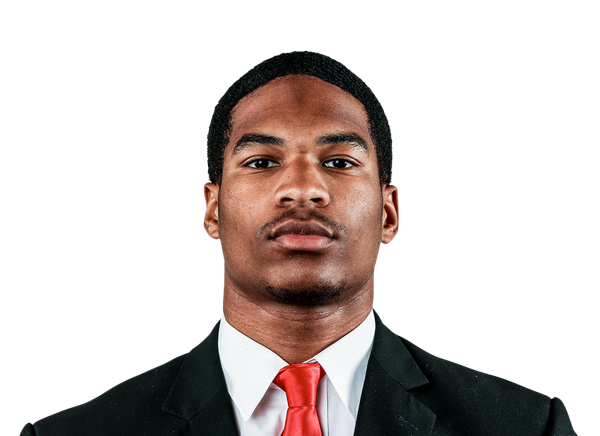 Daylen EveretteCB$1.7M$1.7M · 4 yrs left−435% snaps
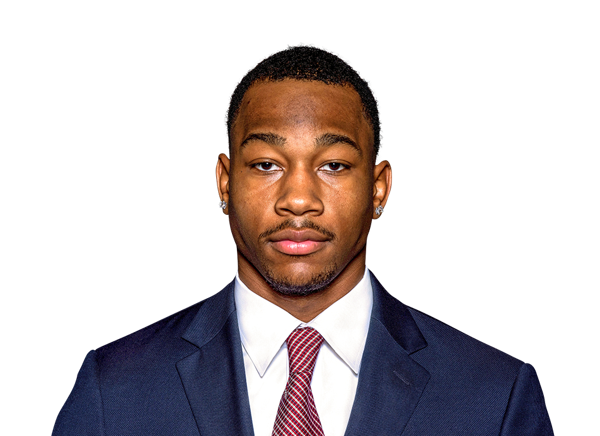 Robert Spears-JenningsS$1.1M$1.1M · 4 yrs left+2336% snaps
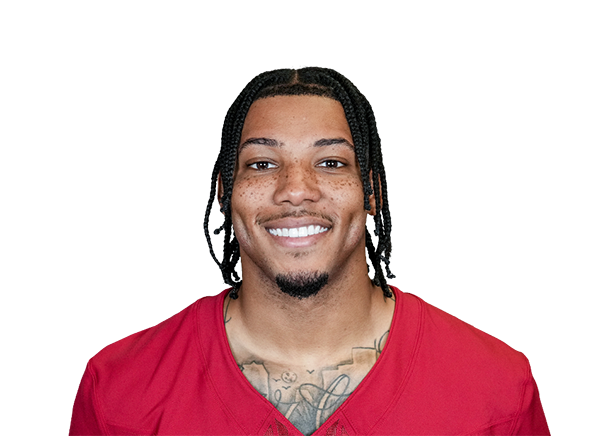 Sean Murphy-BuntingCB$1.0M$1.3M · 1 yr left−230% snaps
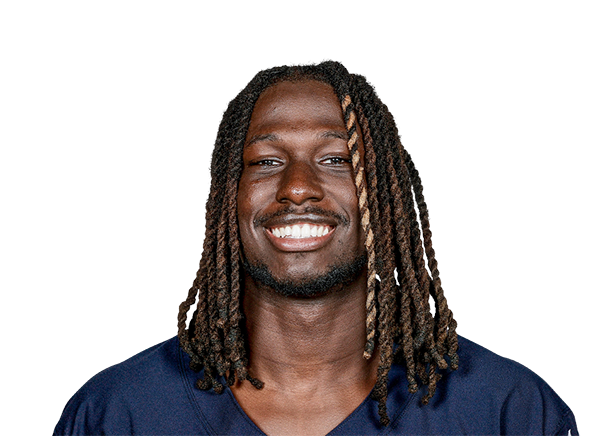 Terell SmithCB$836K$1.1M · 1 yr left−190% snaps
 Donte KentCB · injured$548K$1.1M · 3 yrs left−150% snaps
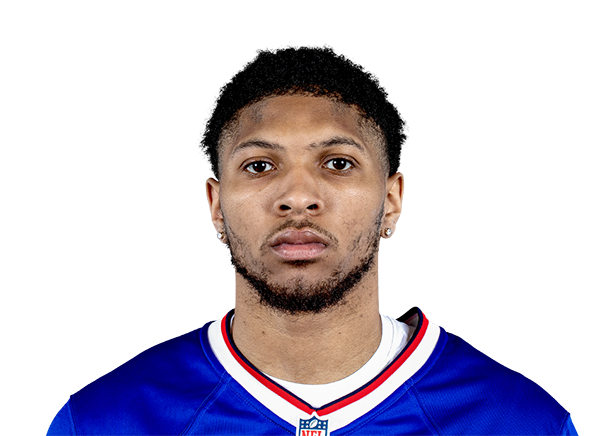 Daequan HardyCB · injured$515K$885K · 1 yr left−140% snaps
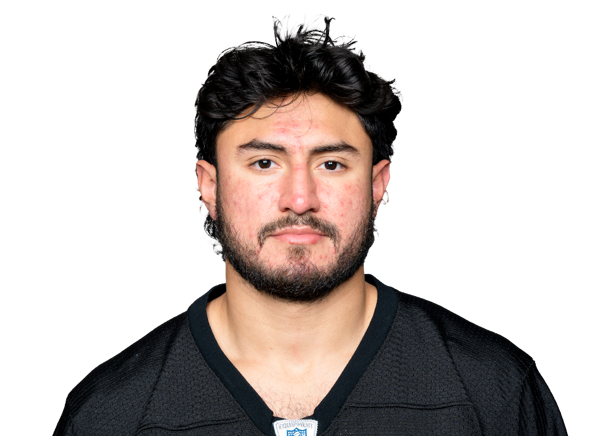 Sebastian CastroS$248K$248K · 1 yr left−50% snaps
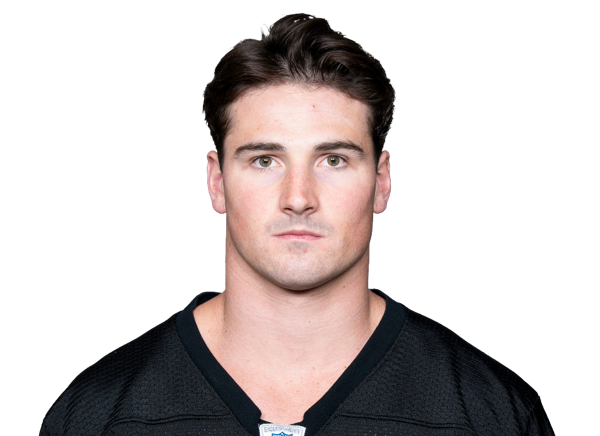 Max HurlemanS · injured$248K$248K · 1 yr left−50% snaps
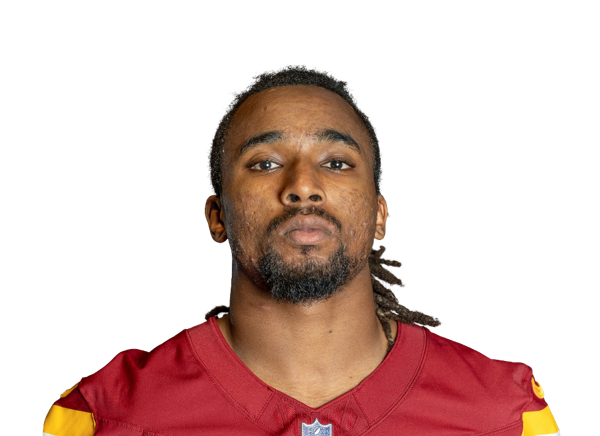 Car'lin VigersCB$248K$248K · 1 yr left−50% snaps
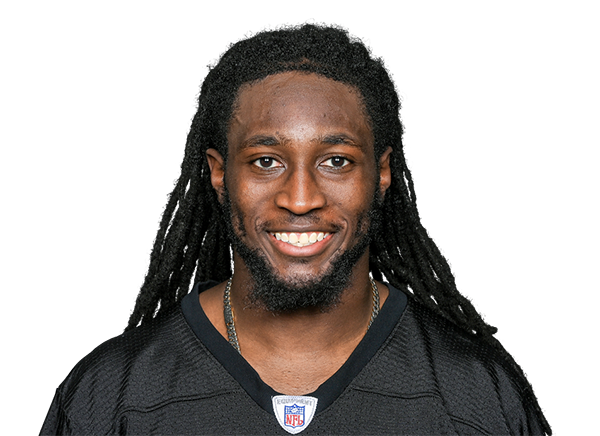 Darius RushCB$220K$248K · 1 yr left−40% snaps
3 contracts
Specialists $7.3M
Player2026 capPer yearPaid / playedGapSnaps
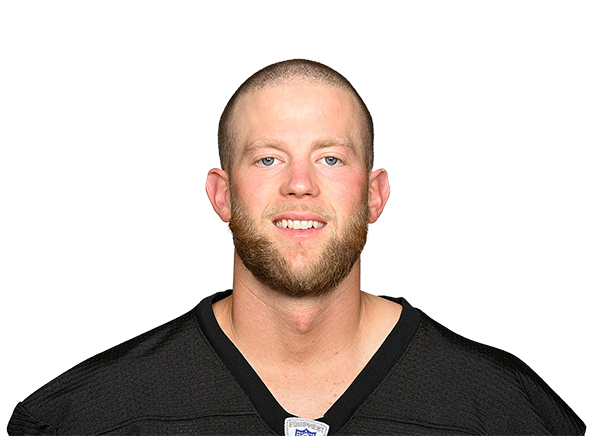 Chris BoswellK$4.9M$7.0M · 4 yrs left−515% snaps
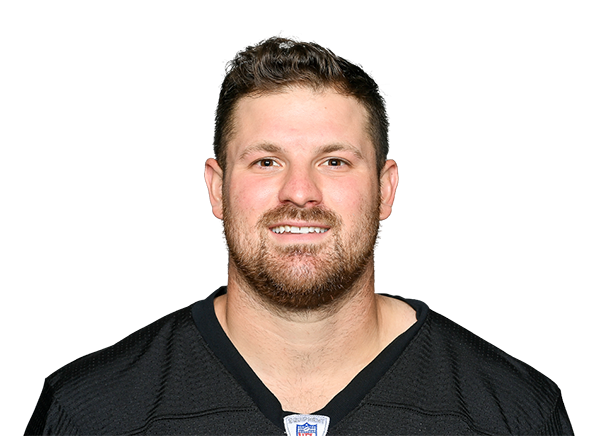 Christian KuntzLS$1.3M$1.2M · 1 yr left+1714% snaps
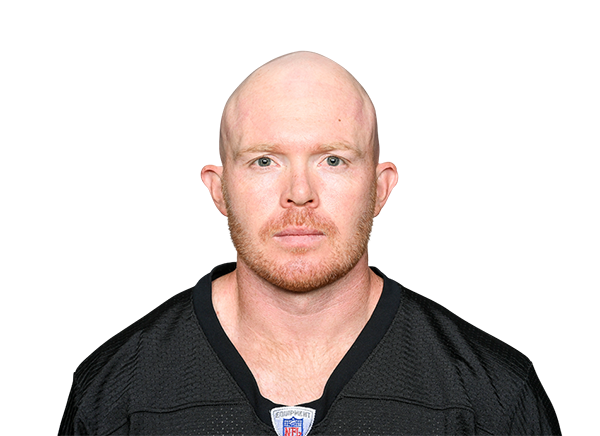 Cameron JohnstonP$1.1M$1.3M · 1 yr left+3914% snaps
Gold bar: where the player's pay ranks among his position group league-wide. Green bar: where his play ranks (EPA for skill players, share of snaps for everyone else). Gap = played minus paid, in percentile points.