 Pittsburgh SteelersAsked and Answered: Nov. 10
 New York GiantsGiants Now: Michael Strahan offers high praise of Arvell Reese
 Philadelphia EaglesAAA Official Review: What did the Eagles, Joe Milton learn from the QB's first start?
 Buffalo Bills'There's no panic' | The Bills stay strong through early struggles and injuries in MNF win over the Minnesota Vikings
 ESPNVikings left at QB crossroads after Carson Wentz's poor MNF showing vs. Bills
 Broncos DeskBroncos are 7-2, but the snaps say 4.1 wins and the 11th seed in the conference5 h ago
 Pro Football RumorsSeahawks Interested In Adding WR Depth
 InjuryCarl Granderson: Active → Cleared7 h ago
 ESPNCarson Beck next man up for Cardinals
The LabEvery contract against the field
 New York JetsThe cap file
63 contracts count $179M against the 2026 cap. 77% of it belongs to players on the field, 22nd of 32. $14.9M is injured and $25.9M is healthy but not playing. The biggest building: defensive line, $48.2M, 21st in the league.
↳Bottom line77% of the Jets cap is on the field (22nd of 32). The most money goes to defensive line: $48.2M, 21st in the league.
?How to read this chart
- The skyline above:
- one building per position group, as tall as the cap hit (this season's salary-cap charge) Jets spend on it, on the same scale as every other team. Lit windows are the share of that money on players who are actually on the field; dark windows are injured or idle money.
- The cards below:
- the same money in numbers. The bar fills with the share on the field, and "in spend" ranks the team among all 32 for that group.
Quarterbacks$5.0M66% on the field · 29th in spend
Running backs$5.3M23% on the field · 31st in spend
Wide receivers$18.9M84% on the field · 25th in spend
Tight ends$13.8M91% on the field · 12th in spend
Offensive line$27.7M83% on the field · 30th in spend
Defensive line$48.2M74% on the field · 21st in spend
Linebackers$18.6M89% on the field · 11th in spend
Secondary$39.2M71% on the field · 19th in spend
Specialists$2.5M100% on the field · 29th in spend
Best value on the roster
Earning more than they cost
↳Bottom lineBest value on the roster: Jowon Briggs, played 81st and paid 28th among DLs.
?How to read the contract tables
- One row = one contract.
- 2026 cap hit, average per year and years left.
- Paid / played bars:
- the gold bar is where his pay ranks among players at his position across the league, the green bar where his play ranks (EPA, expected points added, for QB, RB, WR, TE; share of snaps for everyone else). Full bar = top of the league.
- Gap:
- played rank minus paid rank, in percentile points. Positive (green) means he gives more than he costs; negative (red) means the opposite.
3 contracts
Quarterbacks $5.0M
Player2026 capPer yearPaid / playedGapEPA
 Geno SmithQB$3.3M$3.3M · 1 yr left+24+13.4 EPA
 Cade KlubnikQB$1.4M$1.4M · 4 yrs left−42+0.0 EPA
 Will LevisQB$294K$330K · 1 yr left−10+0.0 EPA
4 contracts
Running backs $5.3M

6 contracts
Wide receivers $18.9M
Player2026 capPer yearPaid / playedGapEPA
 Garrett WilsonWR$10.1M$32.5M · 3 yrs left+4+24.7 EPA
 Omar Cooper Jr.WR$4.4M$4.4M · 4 yrs left+14+20.8 EPA
 Tim PatrickWR · injured$2.0M$2.0M · 1 yr left−1+2.2 EPA
 Adonai MitchellWR$1.5M$1.8M · 2 yrs left+33+12.8 EPA
 Arian SmithWR · injured$852K$1.3M · 3 yrs left+19-0.6 EPA
 Jamaal PritchettWR$179K$248K · 1 yr left−1+0.0 EPA
5 contracts
Tight ends $13.8M
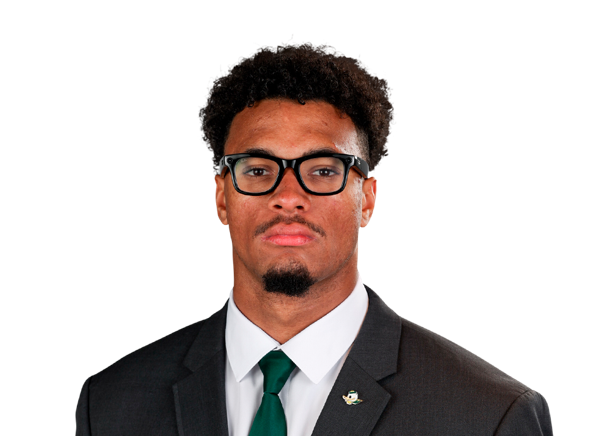
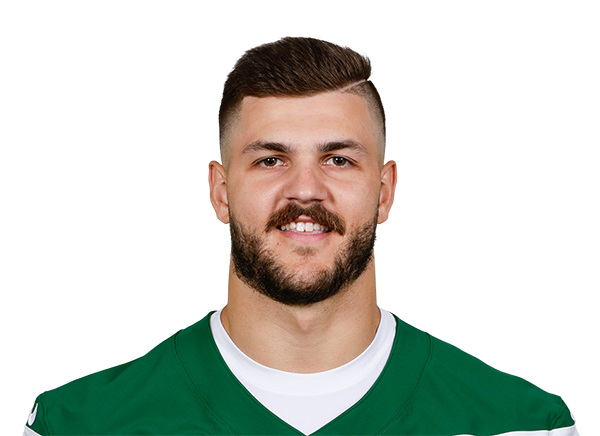
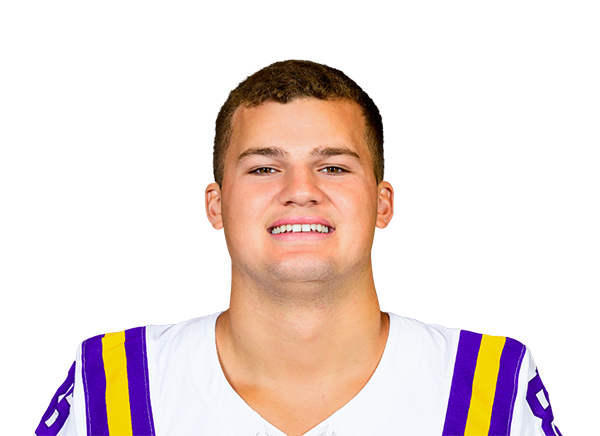
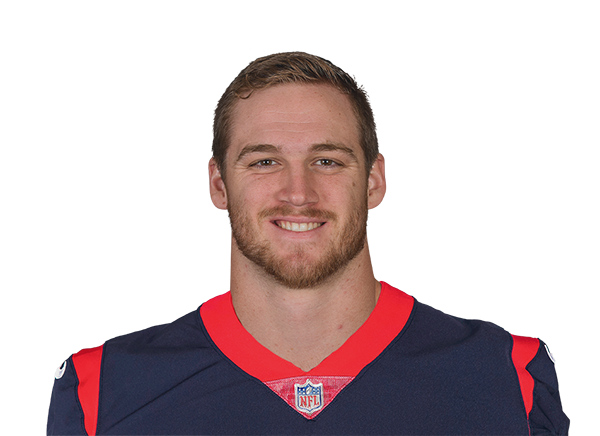
11 contracts
Offensive line $27.7M
Player2026 capPer yearPaid / playedGapSnaps
 Armand MembouRT$7.3M$8.0M · 3 yrs left+2100% snaps
 Olu FashanuLT$5.6M$5.1M · 2 yrs left+7100% snaps
 Dylan ParhamLG$4.0M$8.0M · 2 yrs left−955% snaps
 Joe TippmannRG$3.8M$15.5M · 4 yrs left+17100% snaps
 Jordan MeredithC$2.4M$2.0M · 1 yr left+145% snaps
 Max MitchellLG · injured$1.4M$2.0M · 1 yr left−170% snaps
 Chukwuma OkoraforRT$1.3M$1.5M · 1 yr left−110% snaps
 Anez CooperRG · injured$1.2M$1.2M · 4 yrs left−400% snaps
 Blake FreelandLT$411K$1.1M · 1 yr left−160% snaps
 Nick DawkinsC$248K$248K · 1 yr left−40% snaps
 Jimmy MorrisseyC$206K$248K · 1 yr left−30% snaps
15 contracts
Defensive line $48.2M
Player2026 capPer yearPaid / playedGapSnaps
 David BaileyED$13.7M$13.7M · 4 yrs left+272% snaps
 Harrison PhillipsIDL$7.5M$7.5M · final year−456% snaps
 Joseph OssaiED$5.5M$11.5M · 3 yrs left−3718% snaps
 Will McDonald IVED$5.2M$4.1M · 1 yr left−646% snaps
 Kingsley EnagbareED$5.0M$9.0M · 1 yr left+1062% snaps
 David OnyemataIDL · injured$4.5M$10.5M · 1 yr left−398% snaps
 T'Vondre SweatIDL · injured$1.7M$2.4M · 2 yrs left+1038% snaps
 Darrell Jackson Jr.IDL$1.4M$1.4M · 4 yrs left+2346% snaps
 Braiden McGregorED · injured$1.1M$950K · 1 yr left+38% snaps
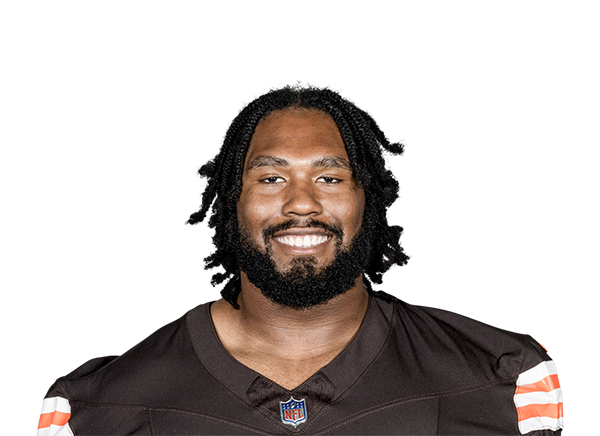 Jowon BriggsIDL$1.1M$1.1M · 1 yr left+5357% snaps
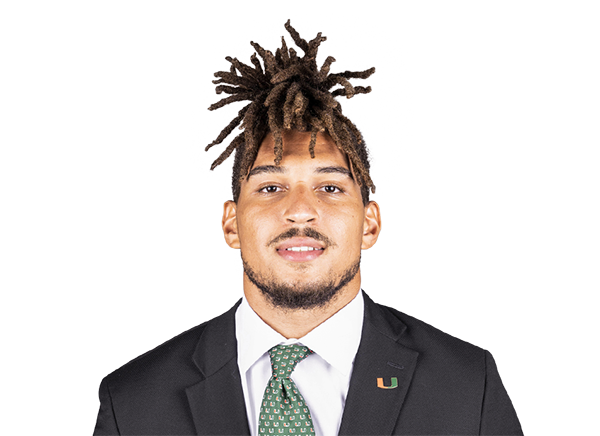 Tyler BaronED · injured$620K$1.1M · 3 yrs left−190% snaps
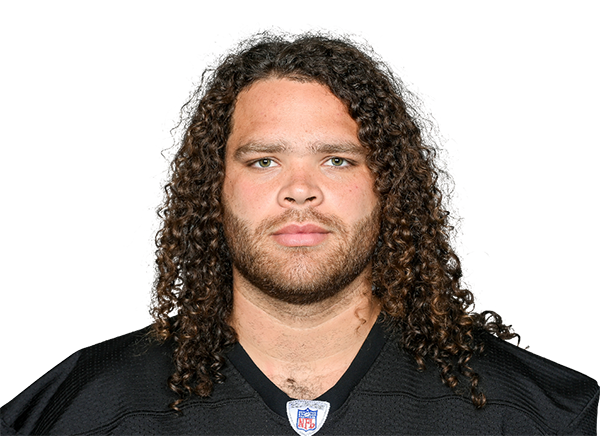 Isaiahh LoudermilkED$294K$330K · 1 yr left−140% snaps
 Amari McNeillIDL$248K$248K · 1 yr left−60% snaps
 Nathan VoorhisED$248K$248K · 1 yr left−60% snaps
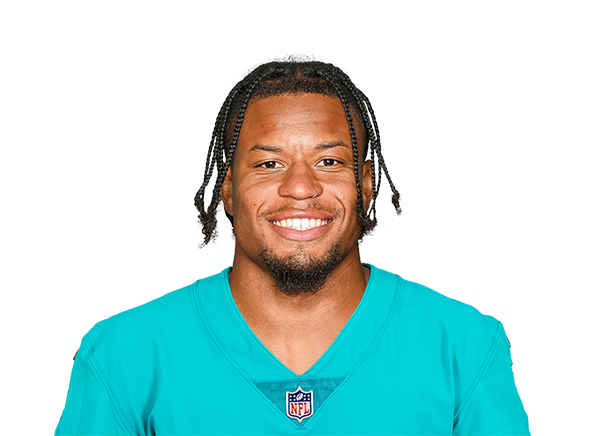 Quinton BellED$239K$330K · 1 yr left+232% snaps
4 contracts
Linebackers $18.6M
13 contracts
Secondary $39.2M
Player2026 capPer yearPaid / playedGapSnaps
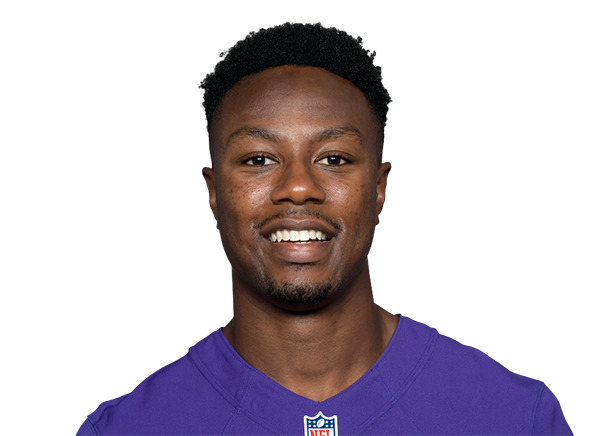 Brandon StephensCB$14.0M$12.0M · 2 yrs left−597% snaps
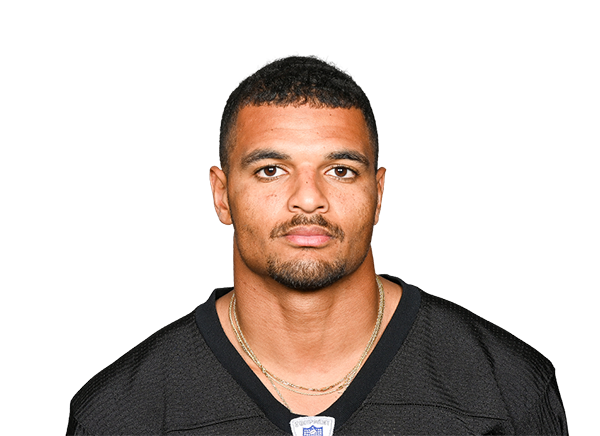 Minkah FitzpatrickS$7.4M$13.3M · 3 yrs left−1272% snaps
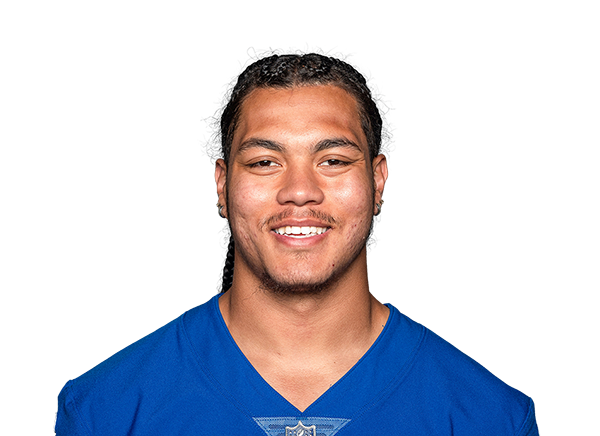 Dane BeltonS$4.0M$4.0M · 1 yr left+20100% snaps
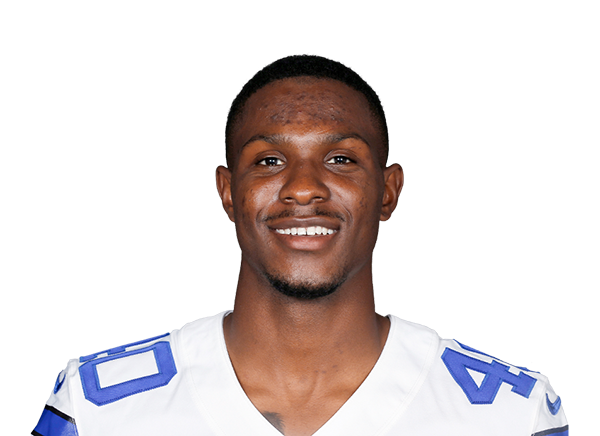 Nahshon WrightCB$3.5M$3.5M · 1 yr left−740% snaps
 D'Angelo PondsCB$2.5M$2.5M · 4 yrs left−2414% snaps
 Azareye'h ThomasCB$1.5M$1.6M · 3 yrs left+44100% snaps
 Malachi MooreS$1.2M$1.3M · 3 yrs left−74% snaps
 Marcelino McCrary-BallCB · injured$1.1M$1.1M · 1 yr left−61% snaps
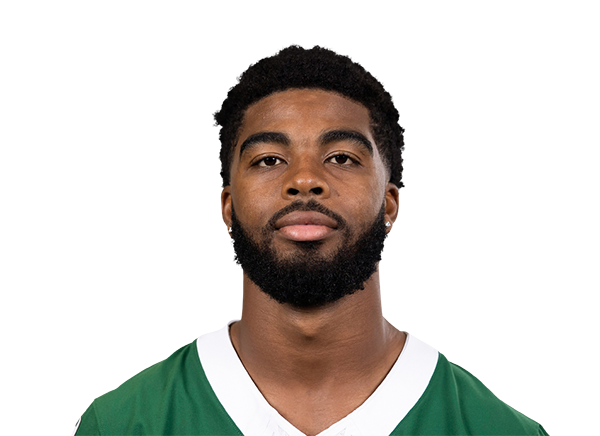 Qwan'tez StiggersCB$1.1M$1.1M · 2 yrs left−80% snaps
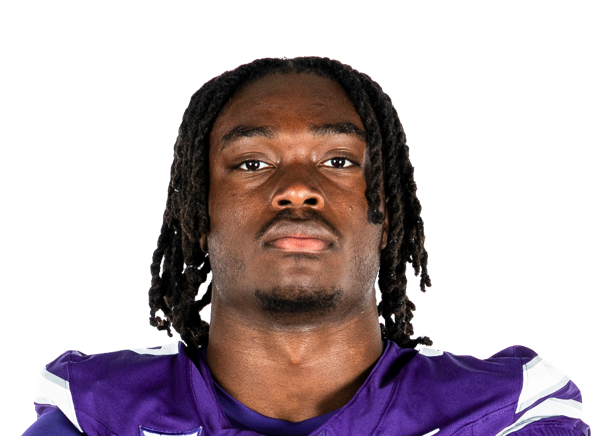 VJ PayneS · injured$1.1M$1.1M · 4 yrs left−330% snaps
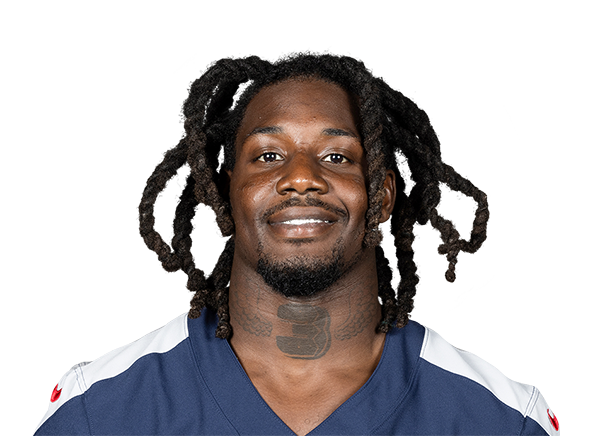 Jarvis Brownlee Jr.CB$1.1M$1.1M · 2 yrs left+3646% snaps
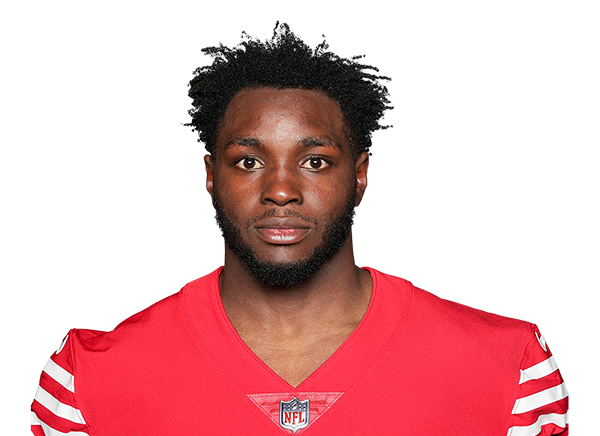 Samuel Womack IIICB$411K$411K · 1 yr left−140% snaps
 Mory BambaCB$248K$248K · 1 yr left−50% snaps
2 contracts
Specialists $2.5M
Player2026 capPer yearPaid / playedGapSnaps
 Thomas HennessyLS$1.5M$1.5M · 1 yr left−213% snaps
 Austin McNamaraP$1.0M$923K · 1 yr left+7215% snaps
Gold bar: where the player's pay ranks among his position group league-wide. Green bar: where his play ranks (EPA for skill players, share of snaps for everyone else). Gap = played minus paid, in percentile points.