 Pittsburgh SteelersAsked and Answered: Nov. 10
 New York GiantsGiants Now: Michael Strahan offers high praise of Arvell Reese
 Philadelphia EaglesAAA Official Review: What did the Eagles, Joe Milton learn from the QB's first start?
 Buffalo Bills'There's no panic' | The Bills stay strong through early struggles and injuries in MNF win over the Minnesota Vikings
 ESPNVikings left at QB crossroads after Carson Wentz's poor MNF showing vs. Bills
 Broncos DeskBroncos are 7-2, but the snaps say 4.1 wins and the 11th seed in the conference5 h ago
 Pro Football RumorsSeahawks Interested In Adding WR Depth
 InjuryCarl Granderson: Active → Cleared7 h ago
The LabEvery contract against the field
 Arizona CardinalsThe cap file
65 contracts count $213M against the 2026 cap. 79% of it belongs to players on the field, 21st of 32. $18.8M is injured and $25.9M is healthy but not playing. The biggest building: defensive line, $50.8M, 19th in the league.
↳Bottom line79% of the Cardinals cap is on the field (21st of 32). The most money goes to defensive line: $50.8M, 19th in the league.
?How to read this chart
- The skyline above:
- one building per position group, as tall as the cap hit (this season's salary-cap charge) Cardinals spend on it, on the same scale as every other team. Lit windows are the share of that money on players who are actually on the field; dark windows are injured or idle money.
- The cards below:
- the same money in numbers. The bar fills with the share on the field, and "in spend" ranks the team among all 32 for that group.
Quarterbacks$7.5M0% on the field · 26th in spend
Running backs$25.5M69% on the field · 1st in spend
Wide receivers$19.9M74% on the field · 23rd in spend
Tight ends$12.7M69% on the field · 18th in spend
Offensive line$37.5M84% on the field · 24th in spend
Defensive line$50.8M89% on the field · 19th in spend
Linebackers$16.9M86% on the field · 14th in spend
Secondary$37.2M83% on the field · 21st in spend
Specialists$4.8M100% on the field · 16th in spend
Best value on the roster
Earning more than they cost
↳Bottom lineBest value on the roster: Denzel Burke, played 84th and paid 30th among DBs.
?How to read the contract tables
- One row = one contract.
- 2026 cap hit, average per year and years left.
- Paid / played bars:
- the gold bar is where his pay ranks among players at his position across the league, the green bar where his play ranks (EPA, expected points added, for QB, RB, WR, TE; share of snaps for everyone else). Full bar = top of the league.
- Gap:
- played rank minus paid rank, in percentile points. Positive (green) means he gives more than he costs; negative (red) means the opposite.
2 contracts
Quarterbacks $7.5M
Player2026 capPer yearPaid / playedGapEPA
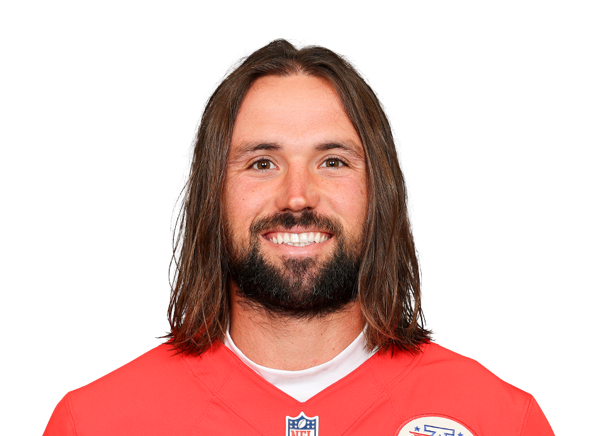 Gardner Minshew IIQB$5.7M$5.8M · 1 yr left+7+7.7 EPA
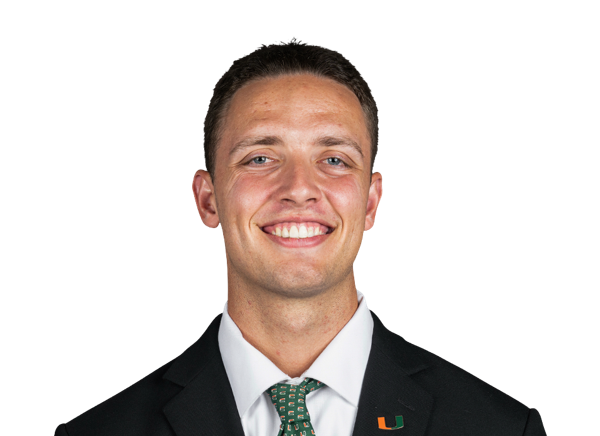 Carson BeckQB$1.9M$1.9M · 4 yrs left−47+0.0 EPA
6 contracts
Running backs $25.5M
Player2026 capPer yearPaid / playedGapEPA
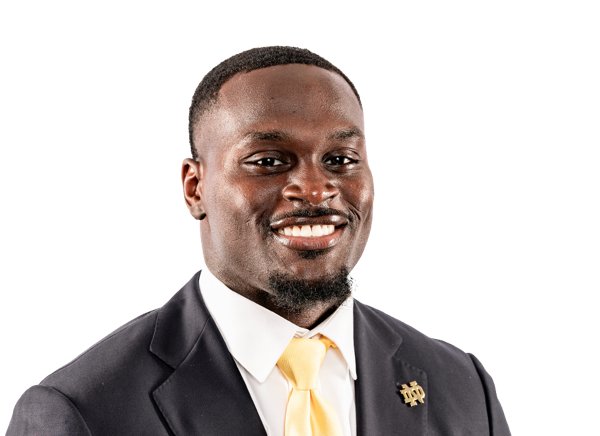 Jeremiyah LoveRB · injured$13.3M$13.3M · 4 yrs left−62-12.9 EPA
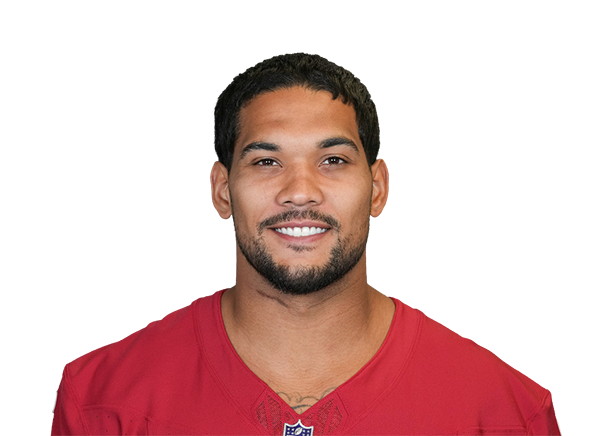 James ConnerRB · injured$4.8M$3.0M · 1 yr left−85+0.0 EPA
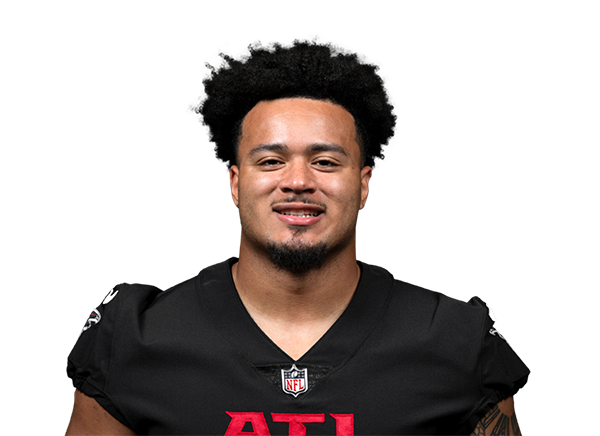 Tyler AllgeierRB$4.3M$6.1M · 2 yrs left−41-9.4 EPA
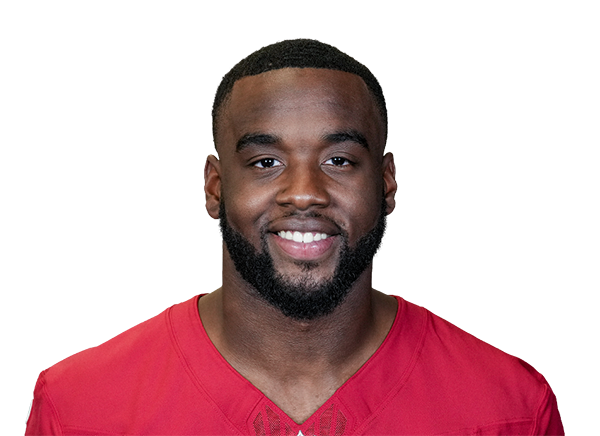 Trey BensonRB · injured$1.7M$1.5M · 2 yrs left−61+0.0 EPA
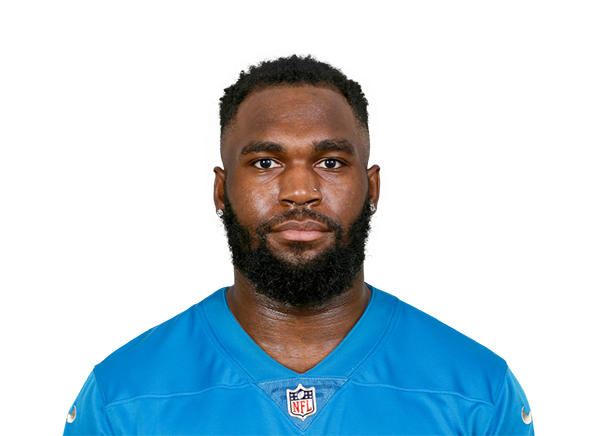 Bam KnightRB$1.2M$1.2M · 1 yr left+3-8.2 EPA
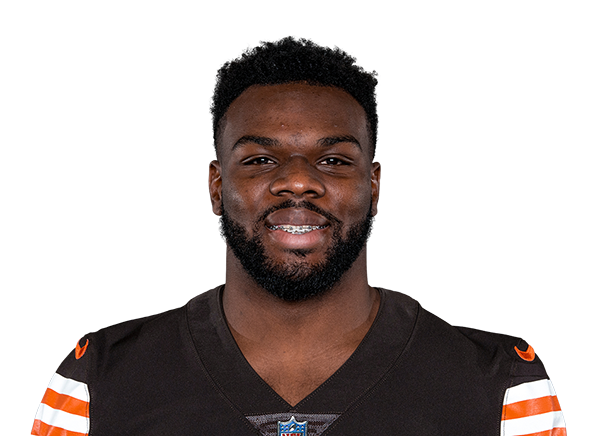 Jerome FordRB$239K$330K · 1 yr left−4+0.0 EPA
8 contracts
Wide receivers $19.9M
Player2026 capPer yearPaid / playedGapEPA
 Michael WilsonWR · injured$6.2M$25.0M · 3 yrs left−12+5.4 EPA
 Kendrick BourneWR · injured$4.8M$5.0M · 2 yrs left−6+6.8 EPA
 Elijah HigginsWR$3.7M$1.0M · 1 yr left−9+2.9 EPA
 Devin DuvernayWR$2.4M$1.9M · 1 yr left−13-0.3 EPA
 Simi FehokoWR$1.3M$1.4M · 1 yr left+4-0.4 EPA
 Reggie VirgilWR$1.2M$1.2M · 4 yrs left+7-0.2 EPA
 Zay JonesWR$202K$330K · 1 yr left−3+0.0 EPA
 Shedrick JacksonWR$179K$248K · 1 yr left−1+0.0 EPA
4 contracts
Tight ends $12.7M
13 contracts
Offensive line $37.5M
Player2026 capPer yearPaid / playedGapSnaps
 Paris Johnson Jr.RT · injured$8.9M$7.0M · 1 yr left−2643% snaps
 Hjalte FroholdtRG$7.9M$10.0M · 2 yrs left+2100% snaps
 Isaac SeumaloLG$6.9M$10.5M · 3 yrs left099% snaps
 Chase BisontisRG · injured$3.3M$3.3M · 4 yrs left−660% snaps
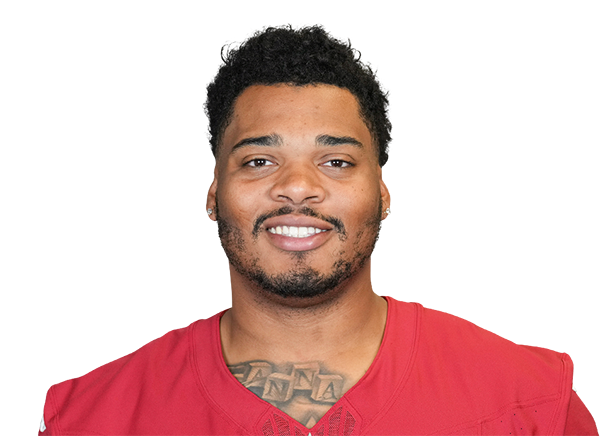 Elijah WilkinsonLG$2.9M$3.1M · 2 yrs left+23100% snaps
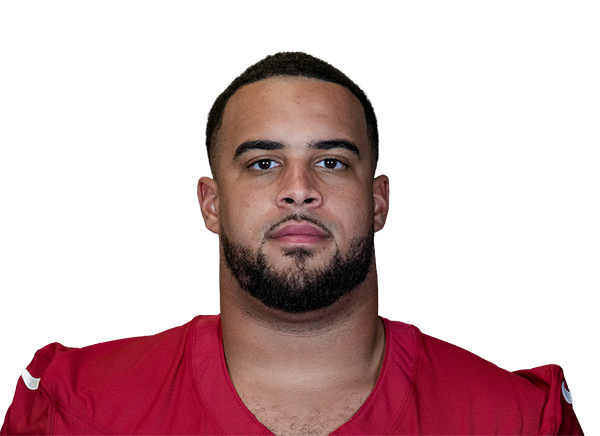 Isaiah AdamsLG · injured$1.6M$1.5M · 2 yrs left+334% snaps
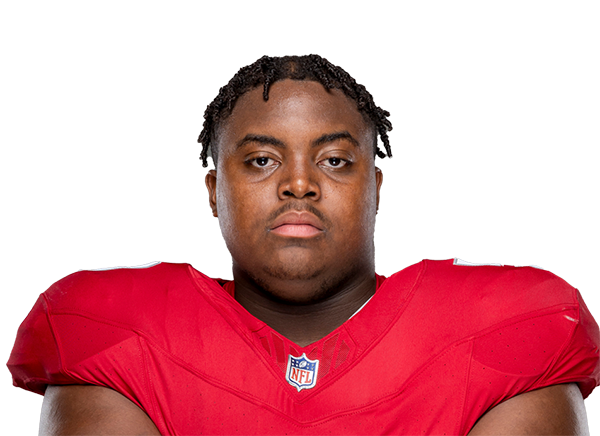 Jon Gaines IILG$1.3M$1.1M · 1 yr left+1440% snaps
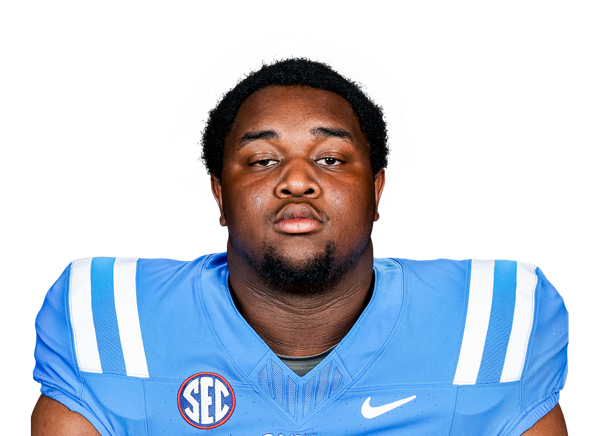 Jayden WilliamsRG$1.1M$1.1M · 4 yrs left+2646% snaps
 Hayden ConnerLG$1.0M$1.1M · 3 yrs left+2526% snaps
 Albert Reese IVRT$1.0M$1.0M · 3 yrs left−280% snaps
 Josh FryarRT$1.0M$1.0M · 2 yrs left+2214% snaps
 Demontrey JacobsRT$248K$248K · 1 yr left−40% snaps
 Austin DeculusRT$202K$330K · 1 yr left−20% snaps
13 contracts
Defensive line $50.8M
Player2026 capPer yearPaid / playedGapSnaps
 Josh SweatED$16.4M$19.1M · 3 yrs left−1459% snaps
 Baron BrowningED$9.4M$7.5M · 1 yr left−1448% snaps
 Walter Nolen IIIIDL$4.4M$4.8M · 3 yrs left−147% snaps
 Roy LopezIDL$4.4M$5.3M · 2 yrs left−645% snaps
 Darius RobinsonIDL$3.8M$3.5M · 2 yrs left−837% snaps
 Dante StillsIDL$3.7M$993K · 1 yr left+1659% snaps
 Andrew BillingsIDL$2.5M$2.5M · 1 yr left−2212% snaps
 L.J. CollierED$1.7M$2.0M · 1 yr left+1645% snaps
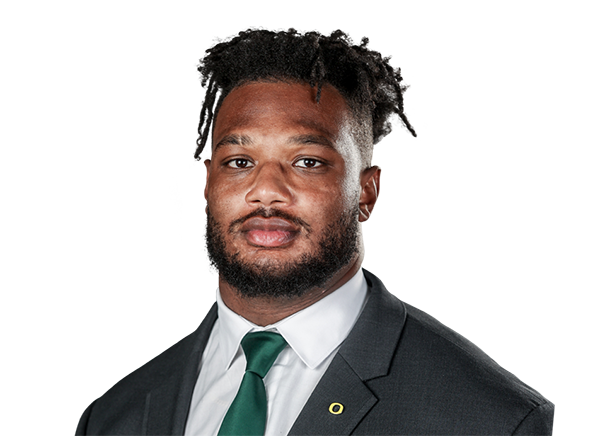 Jordan BurchED$1.5M$1.6M · 3 yrs left+1641% snaps
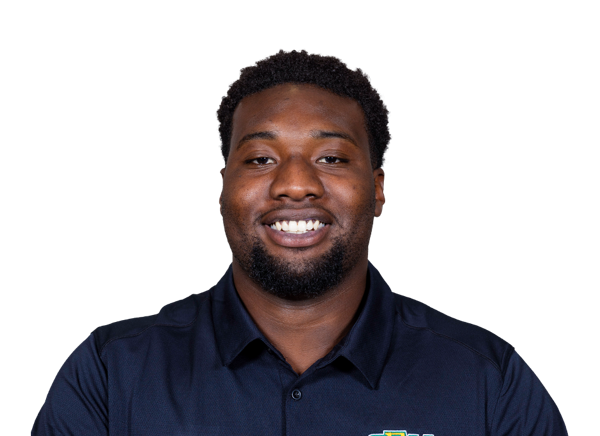 Kaleb ProctorIDL · injured$1.4M$1.4M · 4 yrs left−470% snaps
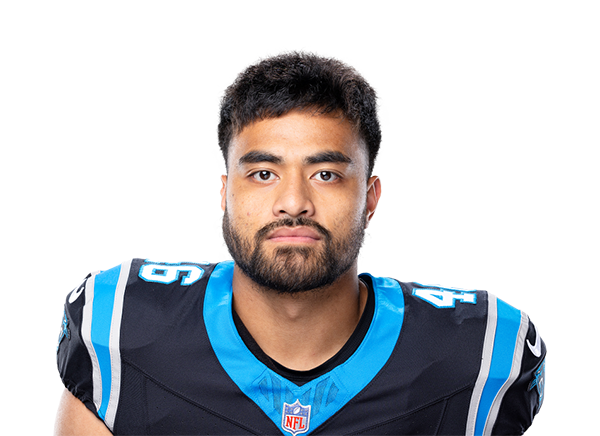 Eku LeotaED$1.1M$1.1M · 1 yr left010% snaps
 Damonic WilliamsIDL$248K$248K · 1 yr left−60% snaps
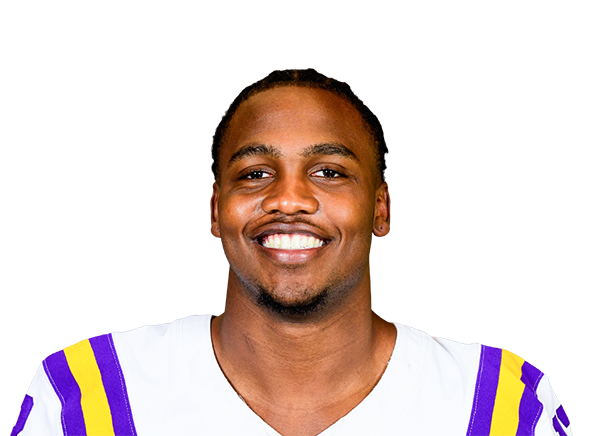 Bradyn SwinsonED$165K$248K · 1 yr left−10% snaps
5 contracts
Linebackers $16.9M
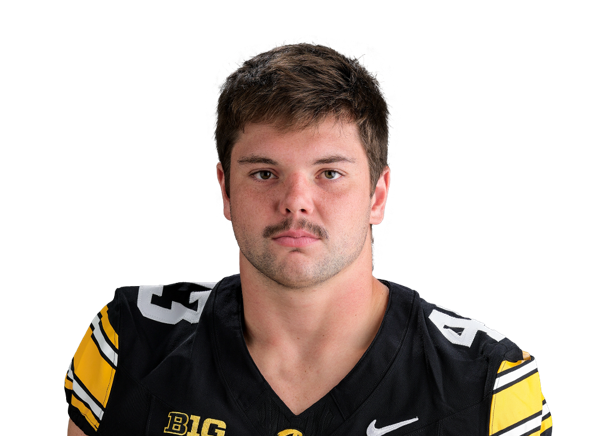
11 contracts
Secondary $37.2M
Player2026 capPer yearPaid / playedGapSnaps
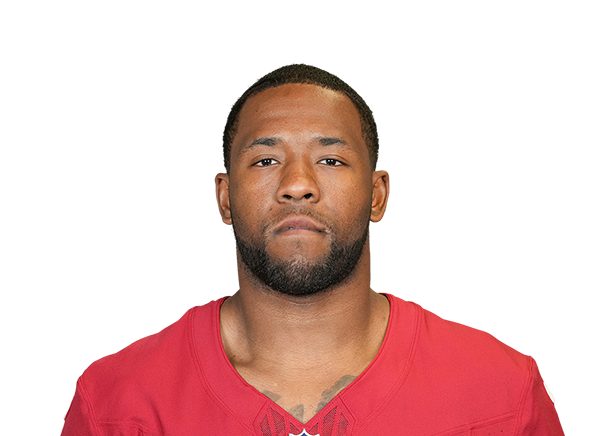 Budda BakerS$19.2M$18.0M · 1 yr left−499% snaps
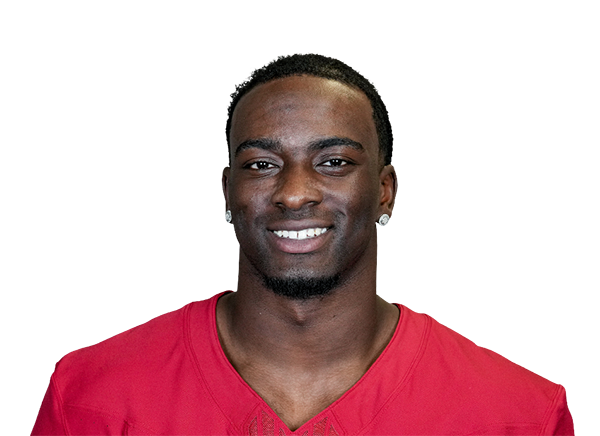 Garrett WilliamsCB$3.9M$1.4M · 1 yr left−2529% snaps
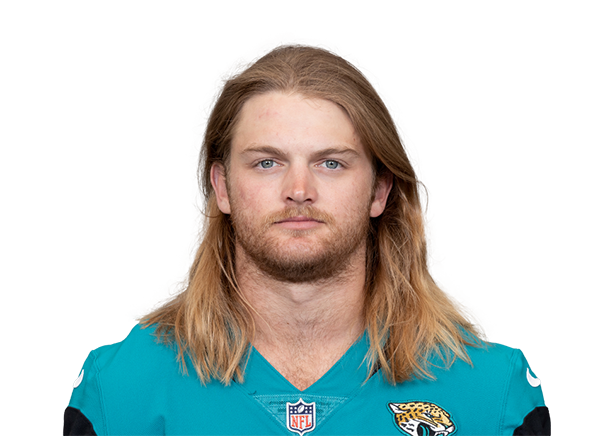 Andrew WingardS$3.0M$3.0M · 1 yr left−256% snaps
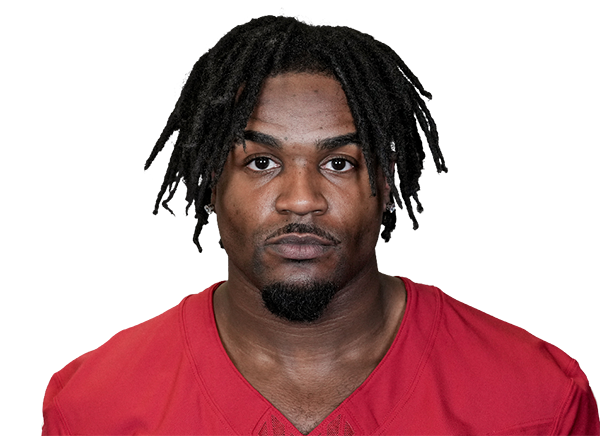 Max MeltonCB$2.4M$2.2M · 2 yrs left+357% snaps
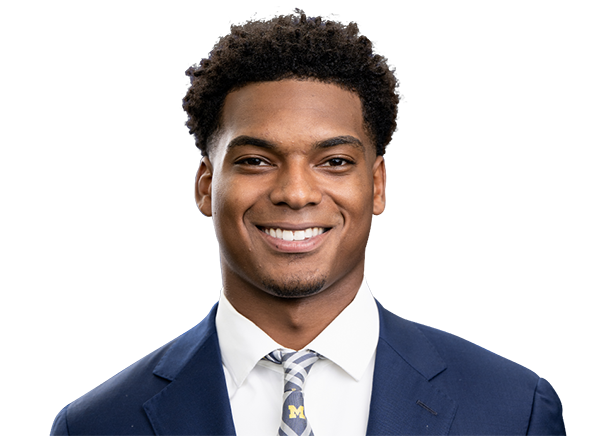 Will JohnsonCB · injured$2.1M$2.4M · 3 yrs left−1919% snaps
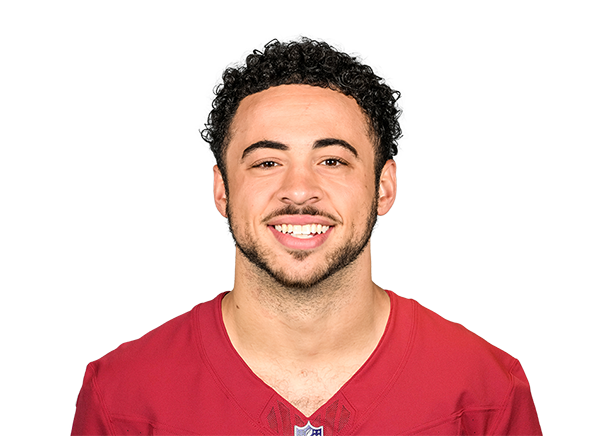 Joey BlountS · injured$1.8M$1.9M · 1 yr left−600% snaps
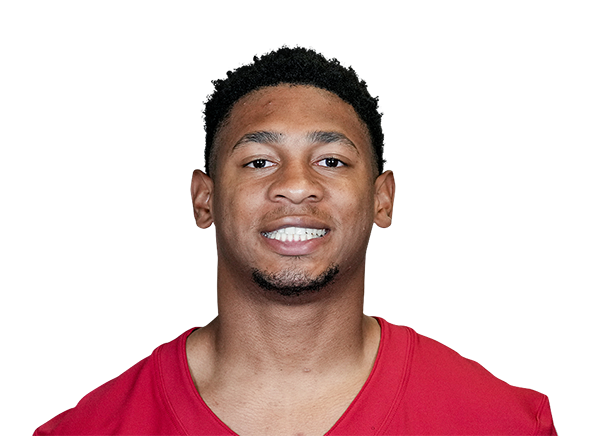 Dadrion Taylor-DemersonS$1.3M$1.2M · 2 yrs left−317% snaps
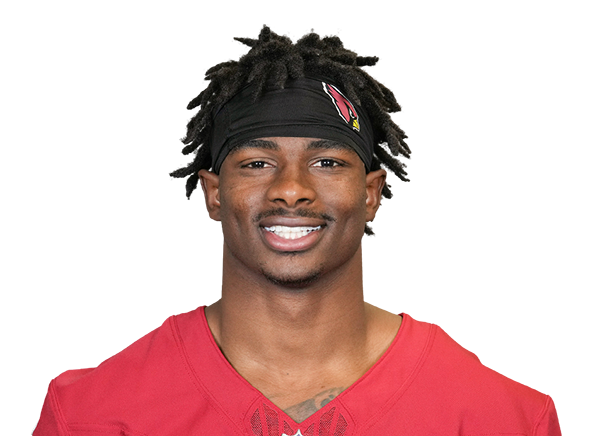 Kei'Trel ClarkCB$1.2M$1.0M · 1 yr left+2342% snaps
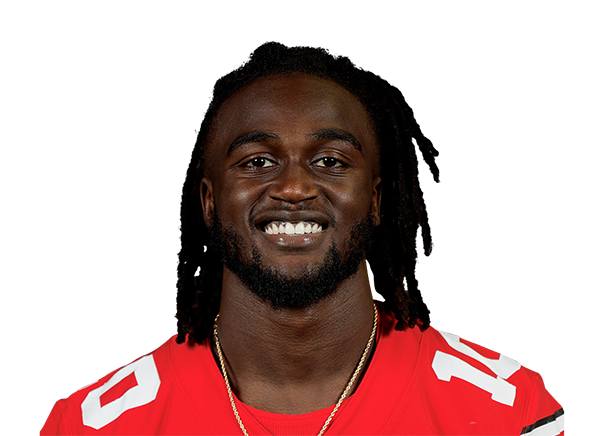 Denzel BurkeCB$1.1M$1.1M · 3 yrs left+5486% snaps
 Kitan CrawfordS$936K$1.1M · 3 yrs left+144% snaps
 Wydett Williams Jr.S$248K$248K · 1 yr left+3918% snaps
3 contracts
Specialists $4.8M
Player2026 capPer yearPaid / playedGapSnaps
 Chad RylandK$1.9M$1.9M · 1 yr left−2813% snaps
 Blake GillikinP$1.7M$1.9M · 1 yr left−2313% snaps
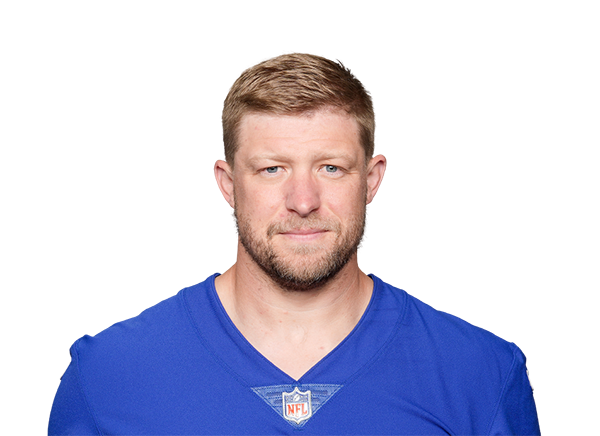 Casey KreiterLS$1.3M$1.5M · 1 yr left+313% snaps
Gold bar: where the player's pay ranks among his position group league-wide. Green bar: where his play ranks (EPA for skill players, share of snaps for everyone else). Gap = played minus paid, in percentile points.