 Pittsburgh SteelersAsked and Answered: Nov. 10
 New York GiantsGiants Now: Michael Strahan offers high praise of Arvell Reese
 Philadelphia EaglesAAA Official Review: What did the Eagles, Joe Milton learn from the QB's first start?
 Buffalo Bills'There's no panic' | The Bills stay strong through early struggles and injuries in MNF win over the Minnesota Vikings
 ESPNVikings left at QB crossroads after Carson Wentz's poor MNF showing vs. Bills
 Broncos DeskBroncos are 7-2, but the snaps say 4.1 wins and the 11th seed in the conference5 h ago
 Pro Football RumorsSeahawks Interested In Adding WR Depth
 InjuryCarl Granderson: Active → Cleared7 h ago
 ESPNCarson Beck next man up for Cardinals
The LabEvery contract against the field
 Los Angeles ChargersThe cap file
70 contracts count $264M against the 2026 cap. 83% of it belongs to players on the field, 11th of 32. $15.8M is injured and $28.0M is healthy but not playing. The biggest building: offensive line, $60.3M, 6th in the league.
↳Bottom line83% of the Chargers cap is on the field (11th of 32). The most money goes to offensive line: $60.3M, 6th in the league.
?How to read this chart
- The skyline above:
- one building per position group, as tall as the cap hit (this season's salary-cap charge) Chargers spend on it, on the same scale as every other team. Lit windows are the share of that money on players who are actually on the field; dark windows are injured or idle money.
- The cards below:
- the same money in numbers. The bar fills with the share on the field, and "in spend" ranks the team among all 32 for that group.
Quarterbacks$49.1M94% on the field · 2nd in spend
Running backs$11.8M70% on the field · 15th in spend
Wide receivers$13.1M69% on the field · 31st in spend
Tight ends$9.5M57% on the field · 24th in spend
Offensive line$60.3M78% on the field · 6th in spend
Defensive line$51.8M89% on the field · 18th in spend
Linebackers$13.9M48% on the field · 19th in spend
Secondary$51.0M93% on the field · 8th in spend
Specialists$3.8M100% on the field · 22nd in spend
Best value on the roster
Earning more than they cost
↳Bottom lineBest value on the roster: Tarheeb Still, played 90th and paid 37th among DBs.
?How to read the contract tables
- One row = one contract.
- 2026 cap hit, average per year and years left.
- Paid / played bars:
- the gold bar is where his pay ranks among players at his position across the league, the green bar where his play ranks (EPA, expected points added, for QB, RB, WR, TE; share of snaps for everyone else). Full bar = top of the league.
- Gap:
- played rank minus paid rank, in percentile points. Positive (green) means he gives more than he costs; negative (red) means the opposite.
3 contracts
Quarterbacks $49.1M
Player2026 capPer yearPaid / playedGapEPA
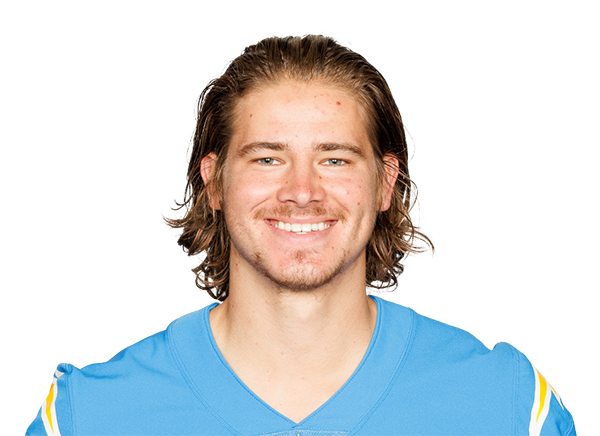 Justin HerbertQB$46.3M$52.5M · 2 yrs left−58-74.5 EPA
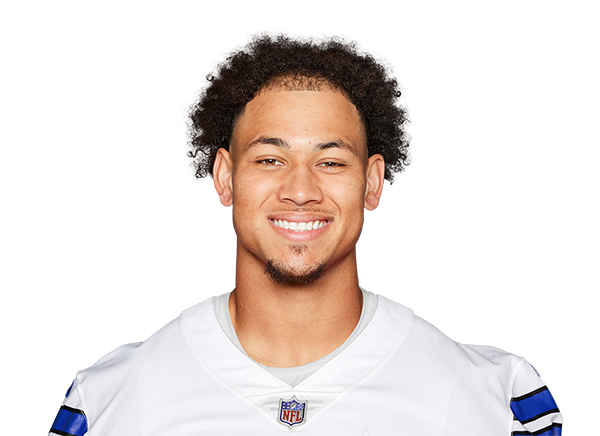 Trey LanceQB · injured$2.5M$2.5M · 1 yr left−53+0.0 EPA
 Jake BrowningQB$239K$330K · 1 yr left−3+0.0 EPA
5 contracts
Running backs $11.8M
8 contracts
Wide receivers $13.1M
Player2026 capPer yearPaid / playedGapEPA
 Quentin JohnstonWR$4.5M$3.5M · 1 yr left0+8.1 EPA
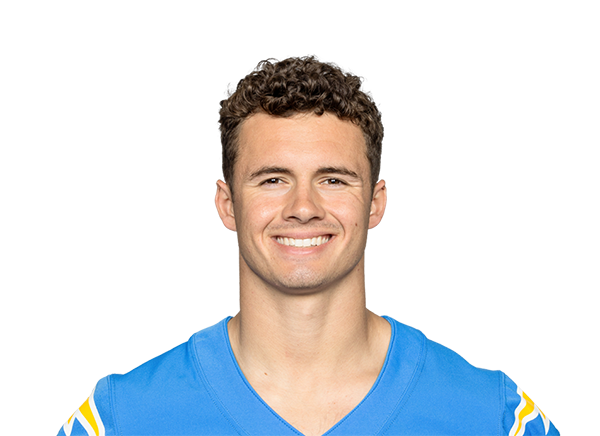 Ladd McConkeyWR$2.7M$2.5M · 2 yrs left+13+9.3 EPA
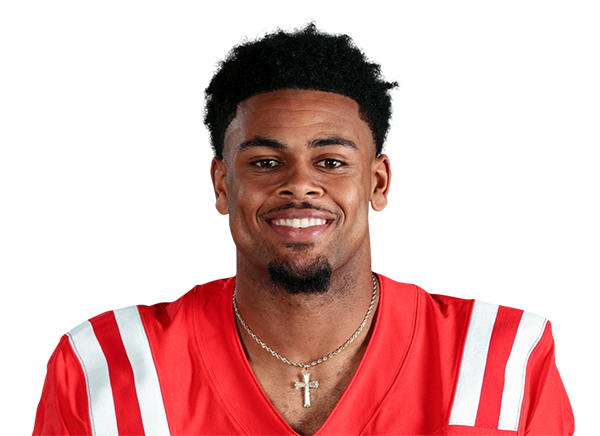 Tre' HarrisWR$1.8M$2.0M · 3 yrs left+11+5.3 EPA
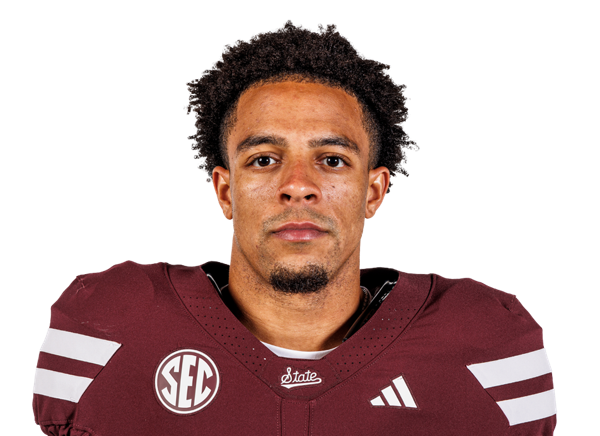 Brenen ThompsonWR$1.4M$1.4M · 4 yrs left−5-0.9 EPA
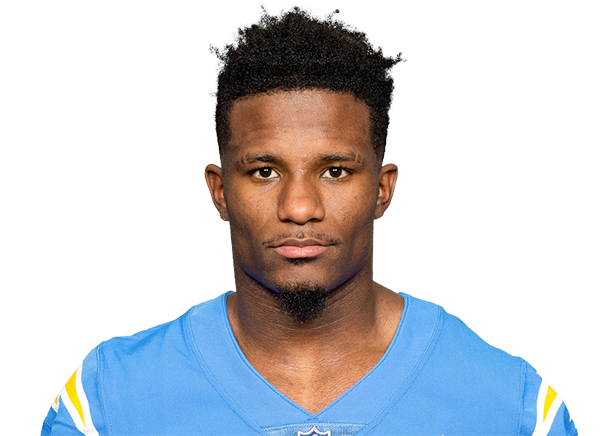 Derius DavisWR$1.3M$1.1M · 1 yr left−8-2.5 EPA
 KeAndre Lambert-SmithWR$1.0M$1.2M · 3 yrs left+3-12.4 EPA
 Luke GrimmWR$179K$248K · 1 yr left−1+0.0 EPA
 Tejhaun PalmerWR$151K$248K · 1 yr left0+0.0 EPA
5 contracts
Tight ends $9.5M

16 contracts
Offensive line $60.3M
Player2026 capPer yearPaid / playedGapSnaps
 Rashawn SlaterLT · injured$23.8M$28.5M · 3 yrs left−3747% snaps
 Joe AltRT$9.0M$8.3M · 2 yrs left−2165% snaps
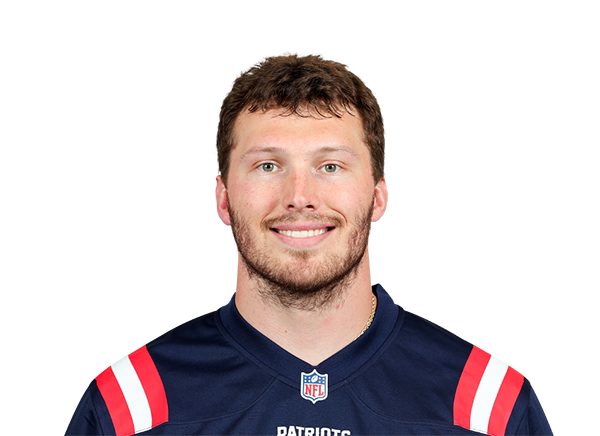 Cole StrangeLG$5.3M$6.5M · 2 yrs left−492% snaps
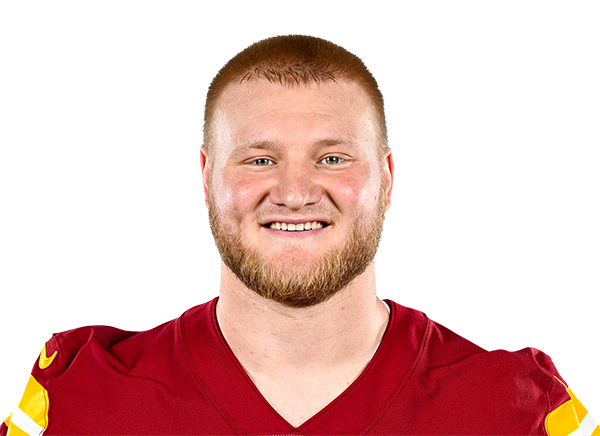 Tyler BiadaszC$4.3M$10.0M · 3 yrs left−730% snaps
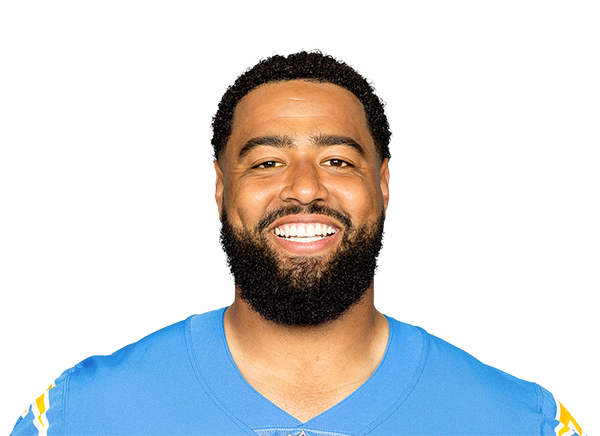 Trey Pipkins IIIRT · injured$3.8M$5.0M · 2 yrs left−284% snaps
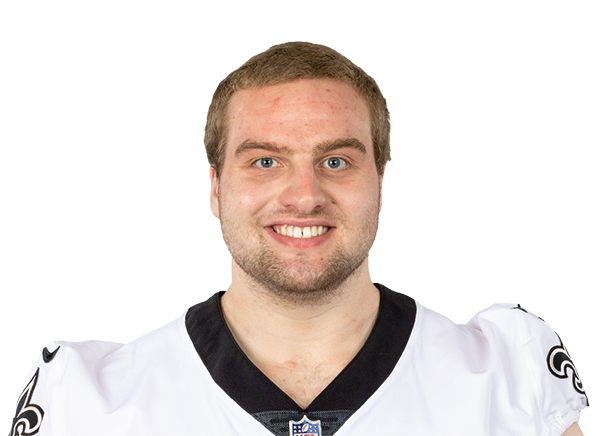 Trevor PenningLT · injured$3.5M$3.5M · 1 yr left−1327% snaps
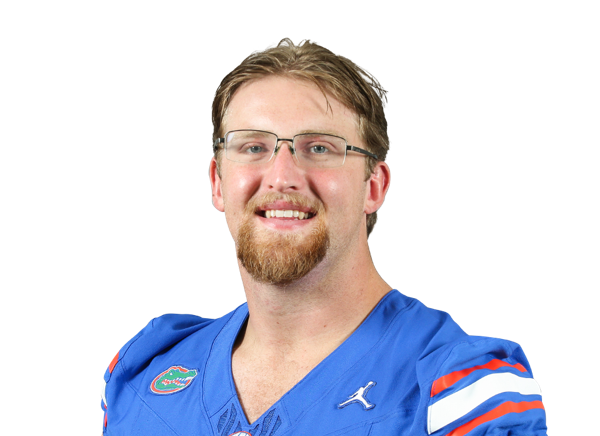 Jake SlaughterC$2.0M$2.0M · 4 yrs left+2599% snaps
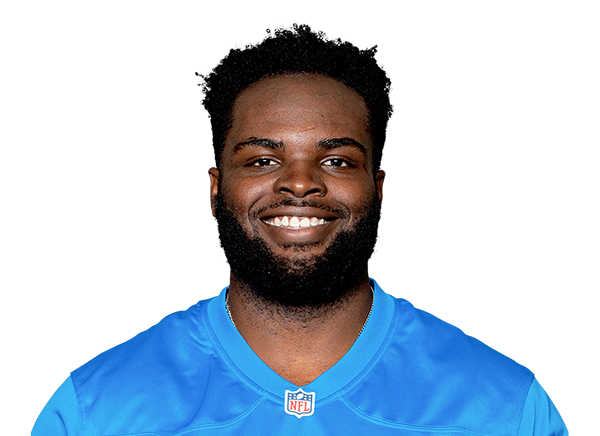 Kayode AwosikaRT$1.9M$2.0M · 1 yr left−1016% snaps
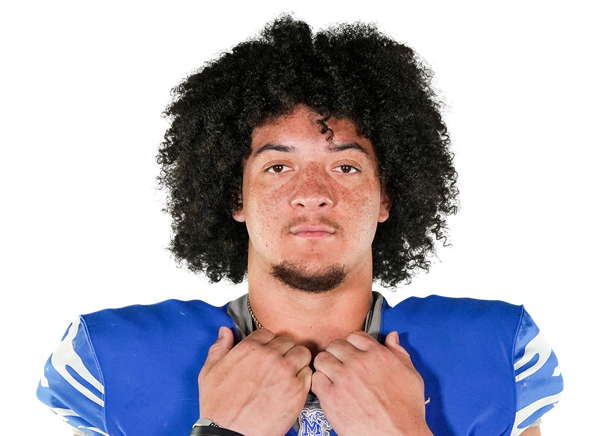 Travis BurkeLT$1.4M$1.4M · 4 yrs left+1661% snaps
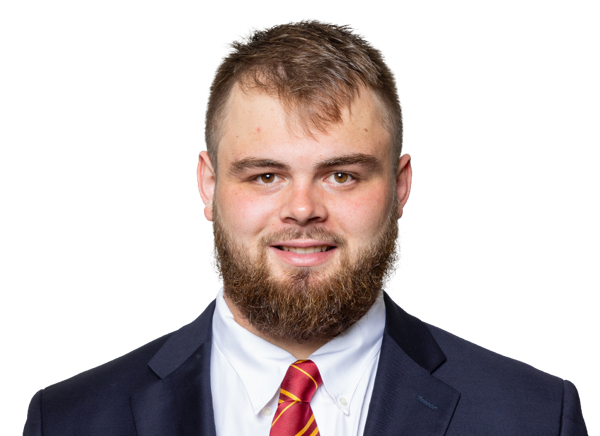 Logan TaylorLG$1.2M$1.2M · 4 yrs left+2656% snaps
 Alex HarkeyRG$1.2M$1.2M · 4 yrs left+1830% snaps
 Isaiah WorldLT · injured$1.0M$1.0M · 3 yrs left−280% snaps
 Jacob SpomerC$1.0M$1.0M · 3 yrs left+133% snaps
 Branson TaylorLT$803K$885K · 1 yr left+162% snaps
 Josh KaltenbergerC$248K$248K · 1 yr left−40% snaps
 Laekin VakalahiLT$0K$248K · 1 yr left00% snaps
13 contracts
Defensive line $51.8M
Player2026 capPer yearPaid / playedGapSnaps
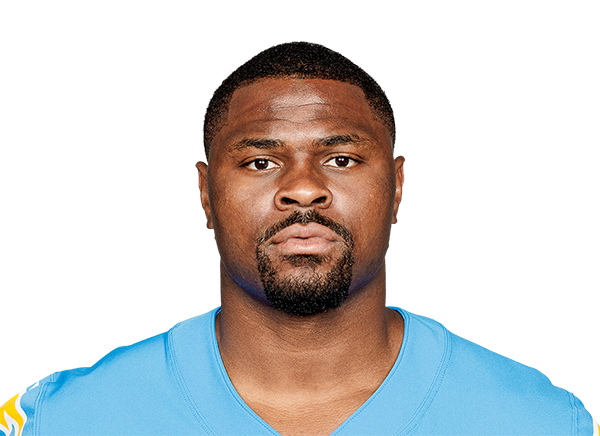 Khalil MackED$18.0M$18.0M · 1 yr left−371% snaps
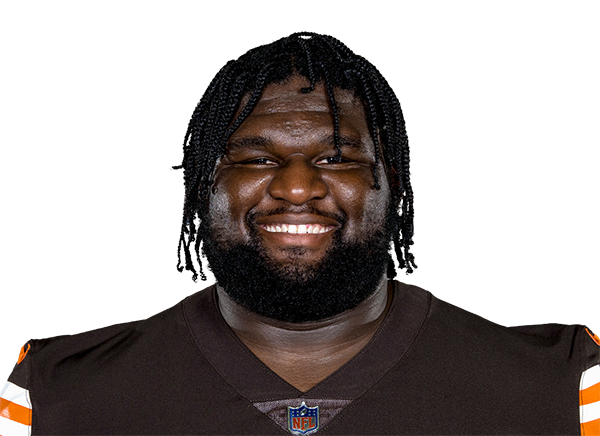 Dalvin TomlinsonIDL$6.8M$6.5M · 1 yr left−2337% snaps
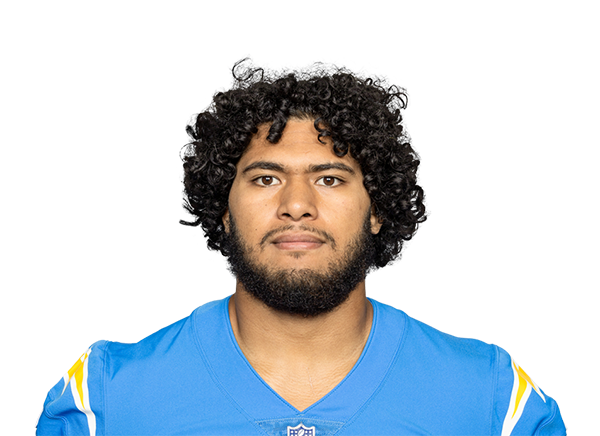 Tuli TuipulotuED$6.2M$1.6M · 1 yr left+1783% snaps
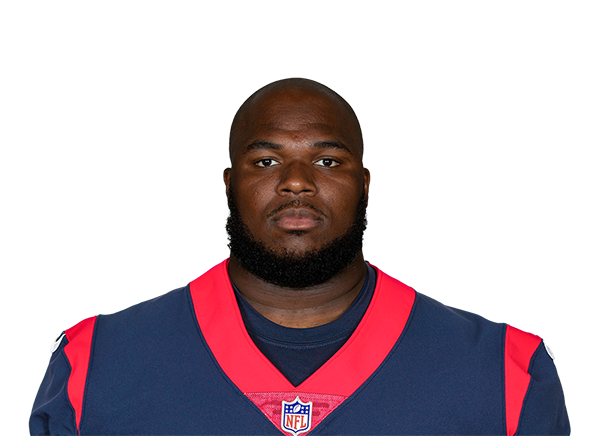 Teair TartIDL$6.0M$10.0M · 3 yrs left−156% snaps
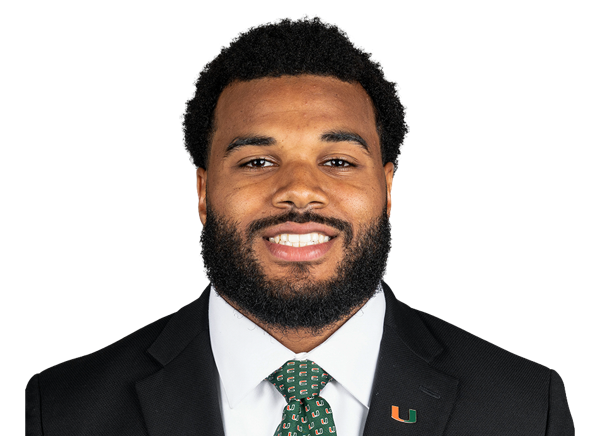 Akheem MesidorED$5.1M$5.1M · 4 yrs left+558% snaps
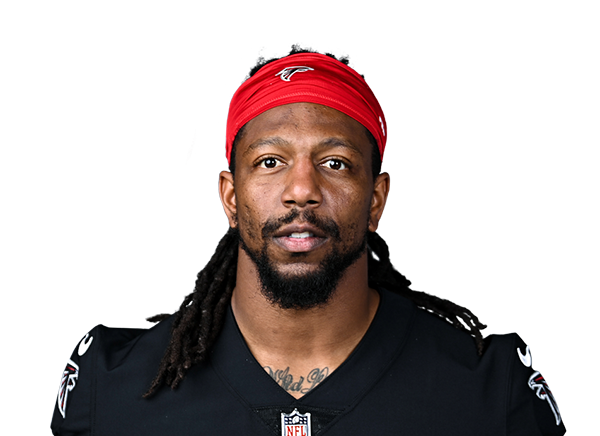 Bud DupreeED$3.7M$4.0M · final year−2915% snaps
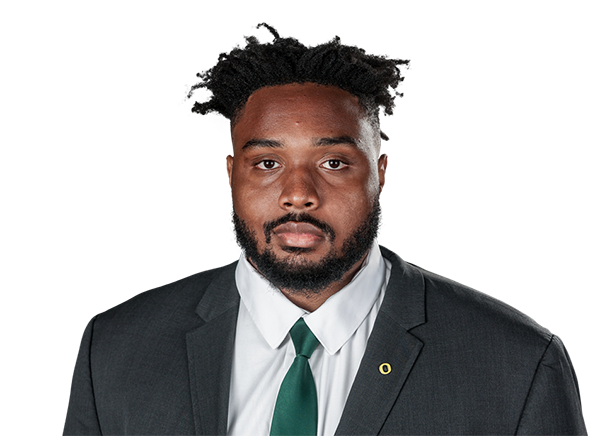 Jamaree CaldwellIDL$1.4M$1.6M · 3 yrs left+2649% snaps
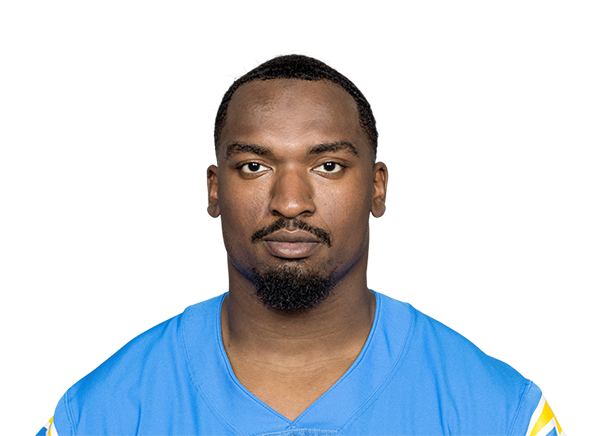 Justin EboigbeED$1.3M$1.2M · 2 yrs left+2948% snaps
 Nick BarrettIDL$1.2M$1.2M · 4 yrs left+725% snaps
 Scott MatlockIDL$1.2M$1.0M · 1 yr left−130% snaps
 Myles AdamsED$275K$330K · 1 yr left−140% snaps
 Andre Carter IIED$248K$248K · 1 yr left−60% snaps
 Terry WebbIDL$248K$248K · 1 yr left−60% snaps
7 contracts
Linebackers $13.9M
Player2026 capPer yearPaid / playedGapSnaps
 Daiyan HenleyLB$3.9M$1.4M · 1 yr left+890% snaps
 Troy DyeLB$3.4M$2.8M · 1 yr left−1818% snaps
 Del'Shawn PhillipsLB$2.8M$3.8M · 2 yrs left+264% snaps
 Denzel PerrymanLB · injured$2.3M$2.8M · 1 yr left−650% snaps
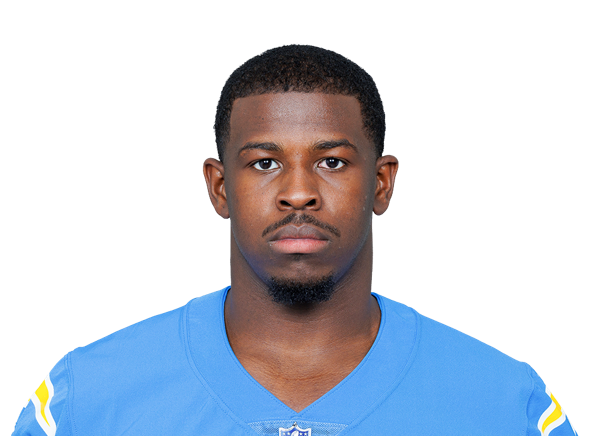 Marlowe WaxLB$1.0M$989K · 2 yrs left+2110% snaps
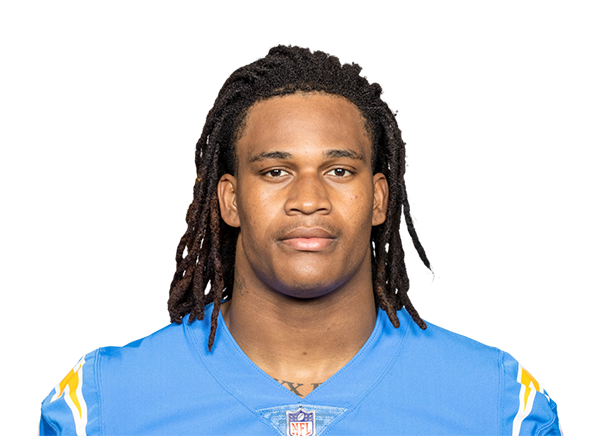 Junior ColsonLB$248K$248K · 1 yr left−10% snaps
 Lander BartonLB$248K$248K · 1 yr left−10% snaps
11 contracts
Secondary $51.0M
Player2026 capPer yearPaid / playedGapSnaps
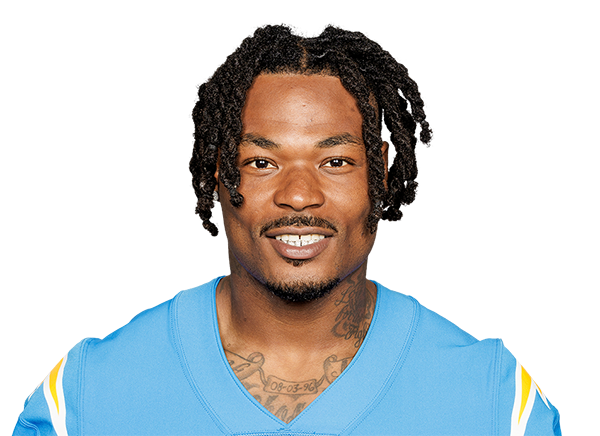 Derwin James Jr.S · injured$24.6M$25.2M · 3 yrs left−4039% snaps
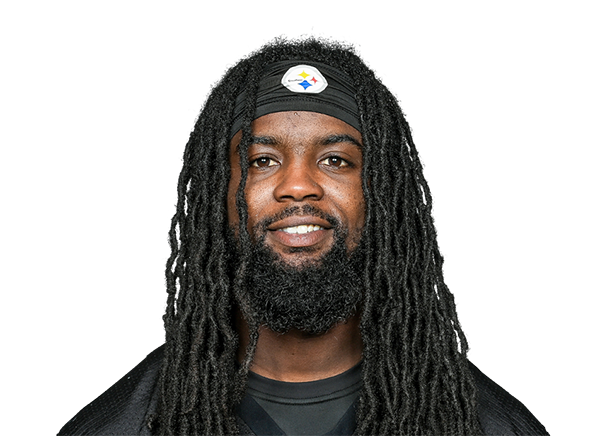 Donte JacksonCB$8.5M$6.5M · 1 yr left−3535% snaps
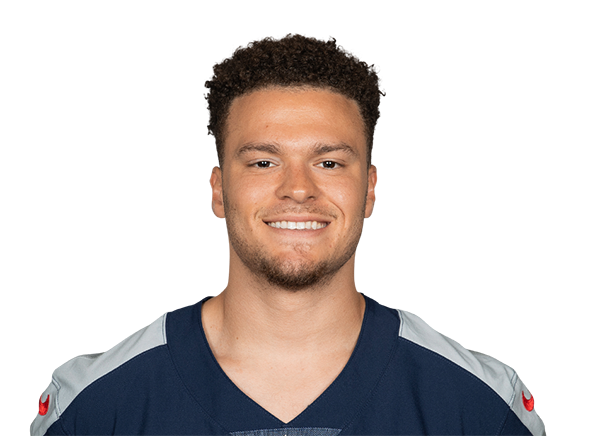 Elijah MoldenS$7.9M$6.3M · 2 yrs left−2057% snaps
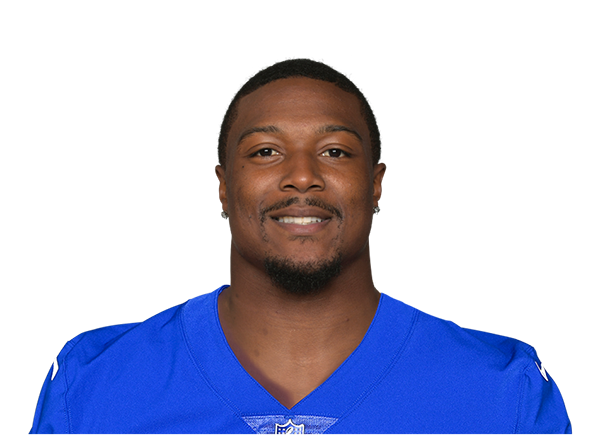 Tony JeffersonS$1.8M$1.5M · 1 yr left+1569% snaps
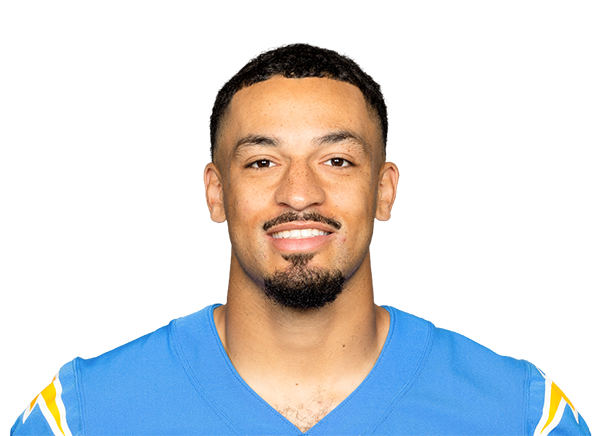 Deane LeonardCB$1.4M$2.0M · 1 yr left−912% snaps
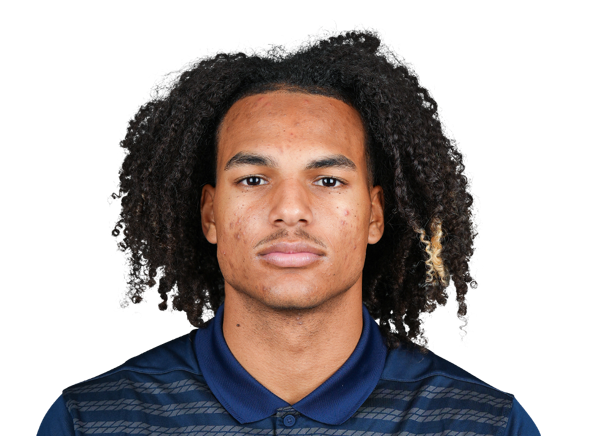 Genesis SmithS$1.4M$1.4M · 4 yrs left+1751% snaps
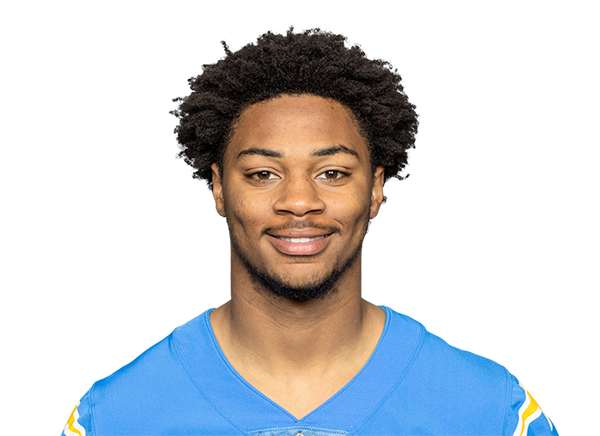 Tarheeb StillCB$1.2M$1.1M · 2 yrs left+5397% snaps
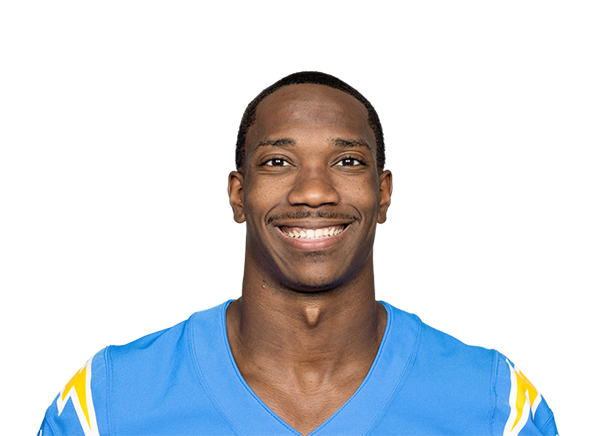 Cam HartCB$1.2M$1.1M · 2 yrs left+4786% snaps
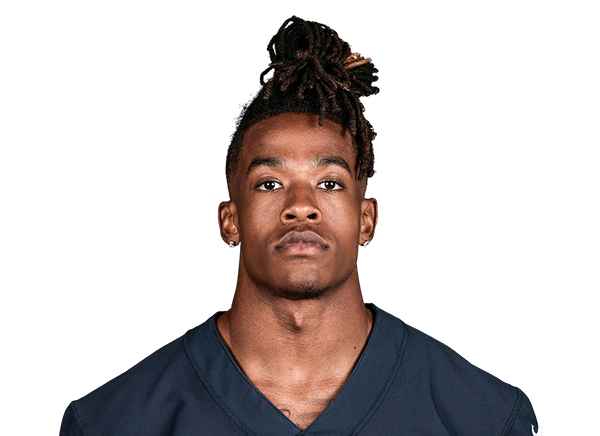 Kendall WilliamsonS$1.1M$1.1M · 1 yr left−270% snaps
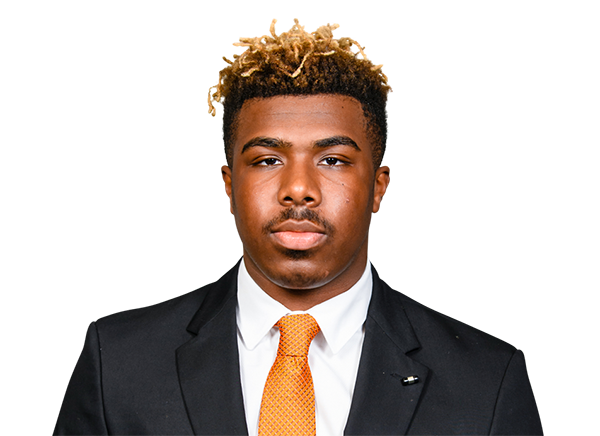 RJ MickensS$1.0M$1.1M · 3 yrs left+3137% snaps
 Rodney ShelleyCB$1.0M$1.0M · 3 yrs left+149% snaps
2 contracts
Specialists $3.8M
Player2026 capPer yearPaid / playedGapSnaps
 JK ScottP$2.4M$2.4M · 1 yr left−5112% snaps
 Josh HarrisLS$1.5M$1.8M · 1 yr left−2912% snaps
Gold bar: where the player's pay ranks among his position group league-wide. Green bar: where his play ranks (EPA for skill players, share of snaps for everyone else). Gap = played minus paid, in percentile points.