 Pittsburgh SteelersAsked and Answered: Nov. 10
 New York GiantsGiants Now: Michael Strahan offers high praise of Arvell Reese
 Philadelphia EaglesAAA Official Review: What did the Eagles, Joe Milton learn from the QB's first start?
 Buffalo Bills'There's no panic' | The Bills stay strong through early struggles and injuries in MNF win over the Minnesota Vikings
 ESPNVikings left at QB crossroads after Carson Wentz's poor MNF showing vs. Bills
 Broncos DeskBroncos are 7-2, but the snaps say 4.1 wins and the 11th seed in the conference5 h ago
 Pro Football RumorsSeahawks Interested In Adding WR Depth
 InjuryCarl Granderson: Active → Cleared7 h ago
 ESPNCarson Beck next man up for Cardinals
The LabEvery contract against the field
 Miami DolphinsThe cap file
69 contracts count $119M against the 2026 cap. 70% of it belongs to players on the field, 29th of 32. $8.1M is injured and $27.4M is healthy but not playing. The biggest building: offensive line, $28.8M, 28th in the league.
↳Bottom line70% of the Dolphins cap is on the field (29th of 32). The most money goes to offensive line: $28.8M, 28th in the league.
?How to read this chart
- The skyline above:
- one building per position group, as tall as the cap hit (this season's salary-cap charge) Dolphins spend on it, on the same scale as every other team. Lit windows are the share of that money on players who are actually on the field; dark windows are injured or idle money.
- The cards below:
- the same money in numbers. The bar fills with the share on the field, and "in spend" ranks the team among all 32 for that group.
Quarterbacks$6.7M84% on the field · 28th in spend
Running backs$7.7M27% on the field · 25th in spend
Wide receivers$8.7M75% on the field · 32nd in spend
Tight ends$6.5M50% on the field · 31st in spend
Offensive line$28.8M84% on the field · 28th in spend
Defensive line$28.4M69% on the field · 32nd in spend
Linebackers$13.6M76% on the field · 22nd in spend
Secondary$16.2M58% on the field · 32nd in spend
Specialists$2.4M100% on the field · 30th in spend
Best value on the roster
Earning more than they cost

↳Bottom lineBest value on the roster: Zeek Biggers, played 83rd and paid 25th among DLs.
?How to read the contract tables
- One row = one contract.
- 2026 cap hit, average per year and years left.
- Paid / played bars:
- the gold bar is where his pay ranks among players at his position across the league, the green bar where his play ranks (EPA, expected points added, for QB, RB, WR, TE; share of snaps for everyone else). Full bar = top of the league.
- Gap:
- played rank minus paid rank, in percentile points. Positive (green) means he gives more than he costs; negative (red) means the opposite.
3 contracts
Quarterbacks $6.7M
Player2026 capPer yearPaid / playedGapEPA
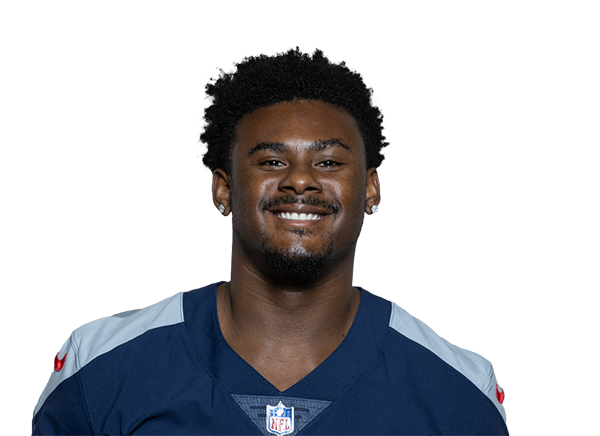 Malik WillisQB$5.7M$22.5M · 3 yrs left−22-12.8 EPA
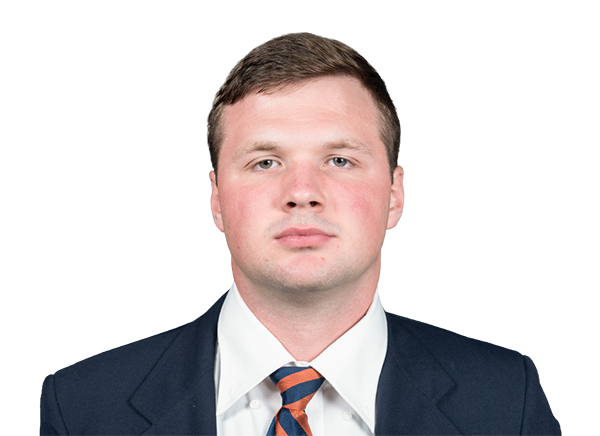 Kyle McCordQB$885K$885K · 1 yr left−16+0.0 EPA
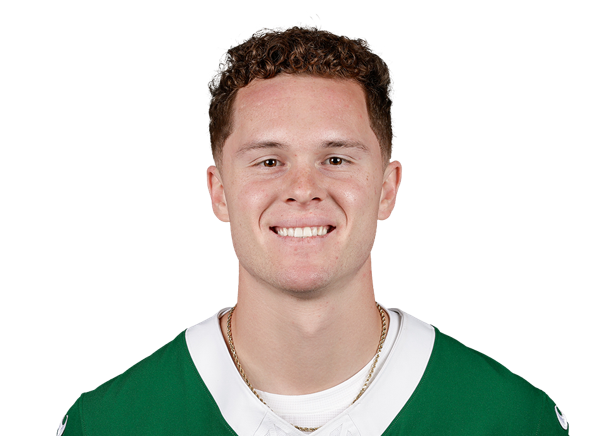 Brady CookQB$179K$248K · 1 yr left−1+0.0 EPA
5 contracts
Running backs $7.7M
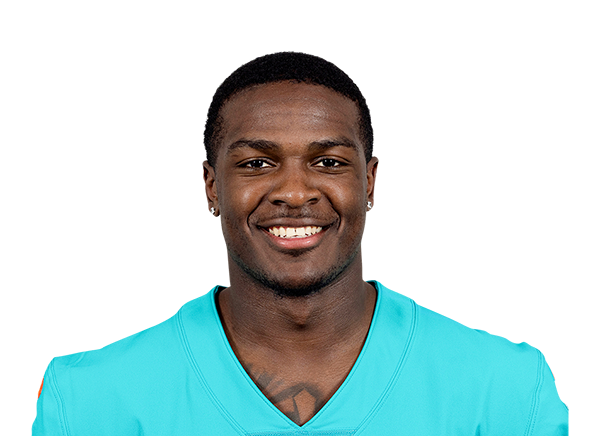
9 contracts
Wide receivers $8.7M
Player2026 capPer yearPaid / playedGapEPA
 Caleb DouglasWR$1.8M$1.8M · 4 yrs left+22+10.0 EPA
 Chris BellWR$1.7M$1.7M · 4 yrs left−12-1.3 EPA
 Jalen TolbertWR$1.3M$1.4M · 1 yr left+15+2.2 EPA
 Kevin Coleman Jr.WR$1.2M$1.2M · 4 yrs left−8-6.0 EPA
 Malik WashingtonWR$1.1M$1.1M · 2 yrs left+36+7.3 EPA
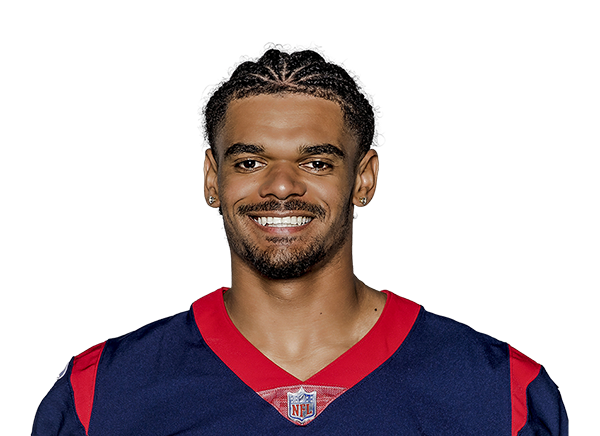 Jared WayneWR$726K$1.0M · 1 yr left+12-3.6 EPA
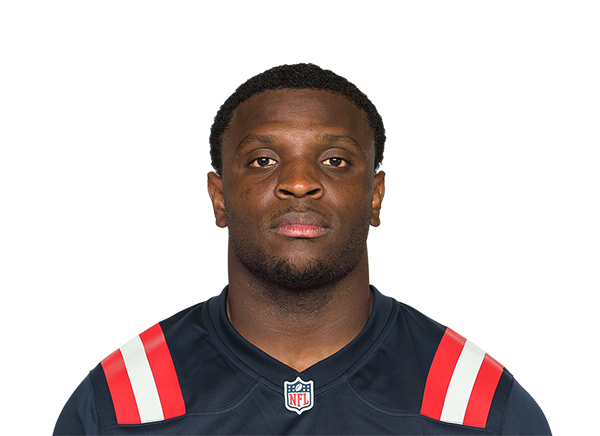 Jalen ReagorWR$411K$411K · 1 yr left−25+0.0 EPA
 Will SheppardWR$248K$248K · 1 yr left−7+0.0 EPA
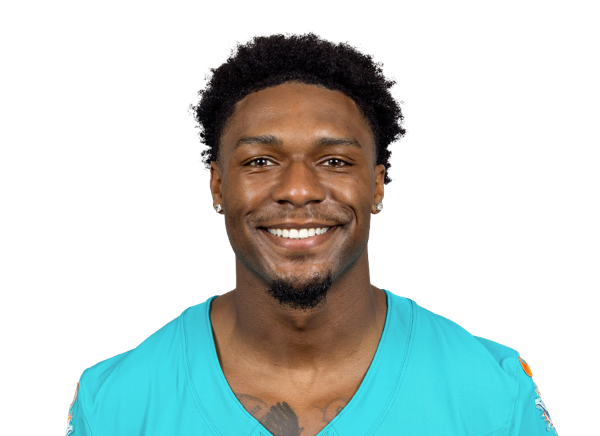 AJ HenningWR$220K$248K · 1 yr left−4+0.0 EPA
6 contracts
Tight ends $6.5M
Player2026 capPer yearPaid / playedGapEPA
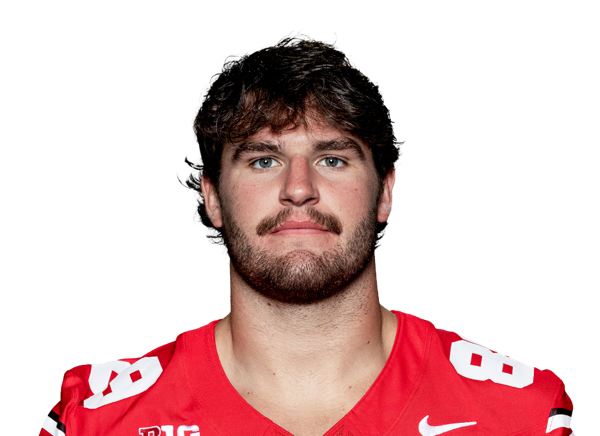 Will KacmarekTE$1.7M$1.7M · 4 yrs left−17-5.2 EPA
 Greg DulcichTE$1.6M$3.3M · 1 yr left+34+11.4 EPA
 Justin JolyTE$1.2M$1.2M · 4 yrs left−42+0.0 EPA
 Seydou TraoreTE$1.2M$1.2M · 4 yrs left+16-0.5 EPA
 Cole TurnerTE · injured$565K$1.1M · 1 yr left−19+0.0 EPA
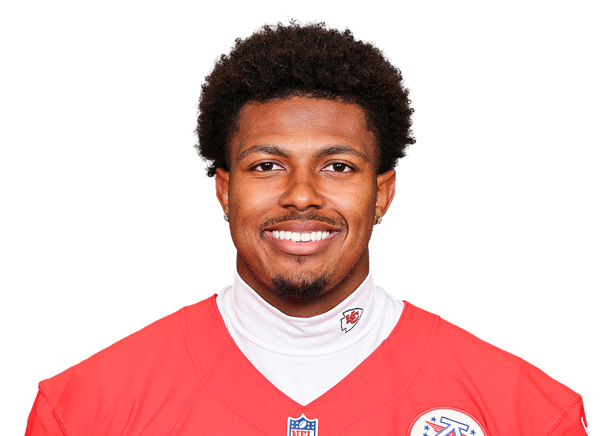 Tre WatsonTE$248K$248K · 1 yr left−4+0.0 EPA
11 contracts
Offensive line $28.8M
Player2026 capPer yearPaid / playedGapSnaps
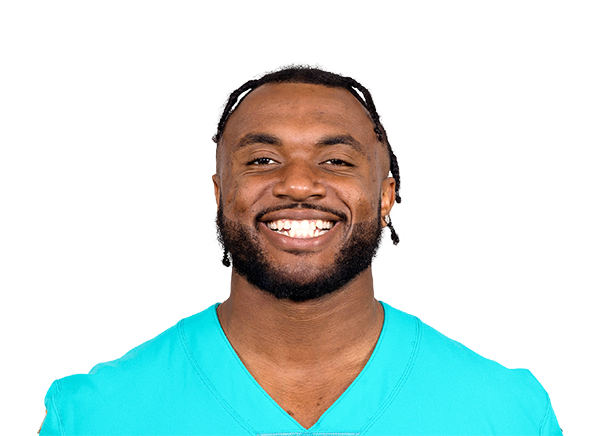 Austin JacksonRT$6.7M$7.0M · 1 yr left+4100% snaps
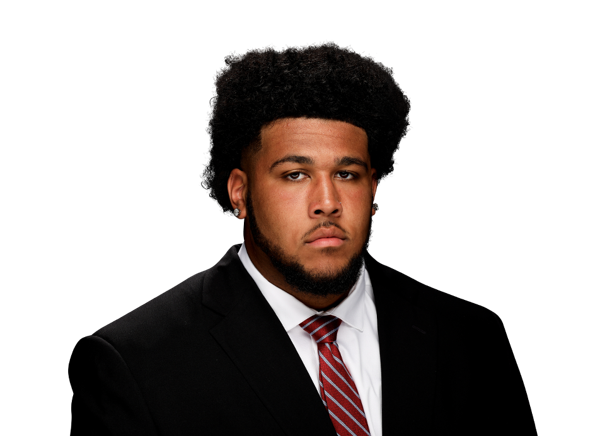 Kadyn ProctorLG$6.5M$6.5M · 4 yrs left−1186% snaps
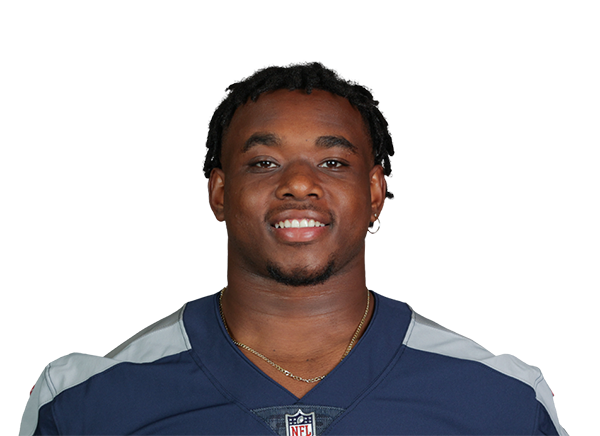 Aaron BrewerC$5.6M$17.5M · 3 yrs left+7100% snaps
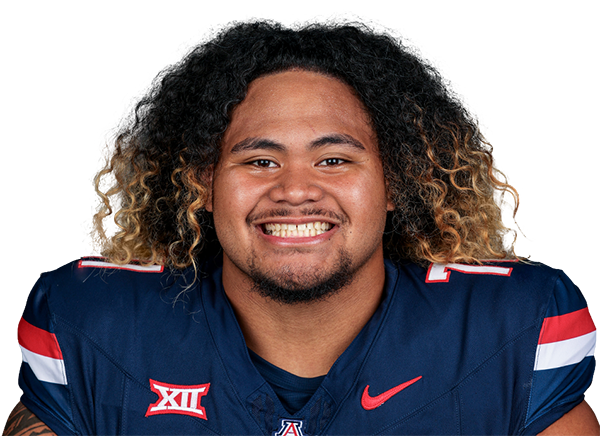 Jonah SavaiinaeaLT$2.6M$2.8M · 3 yrs left+1190% snaps
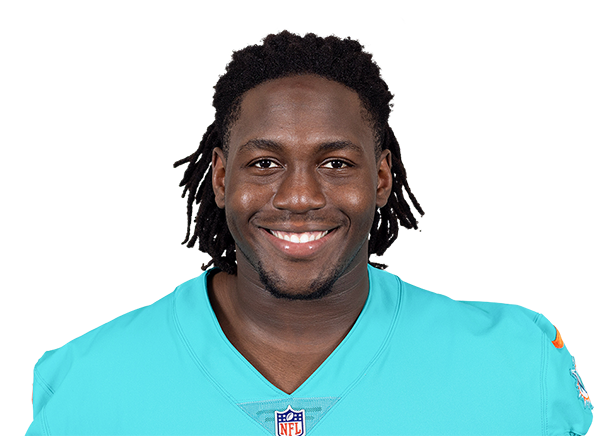 Patrick PaulLT$1.9M$1.7M · 2 yrs left+28100% snaps
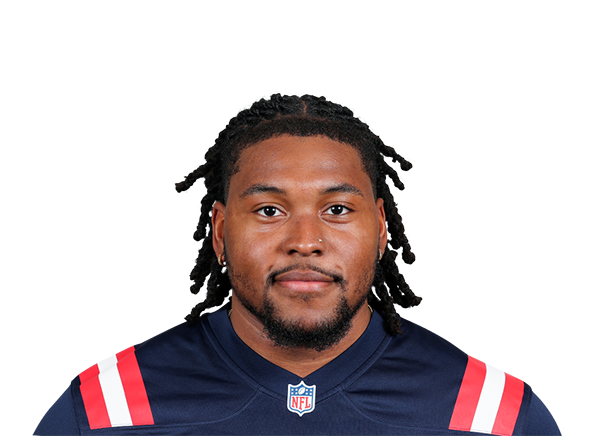 Caedan WallaceLT$1.3M$1.5M · 2 yrs left−63% snaps
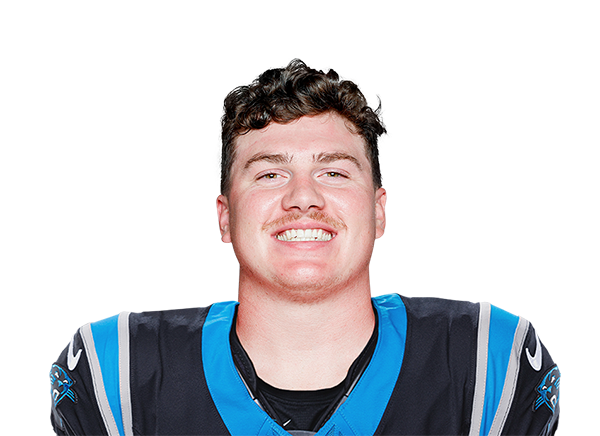 Jarrett KingstonLG$1.1M$1.1M · 1 yr left+2324% snaps
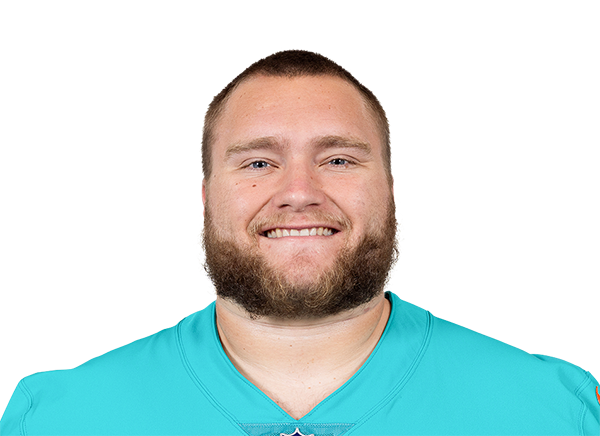 Andrew MeyerC$1.0M$948K · 1 yr left−250% snaps
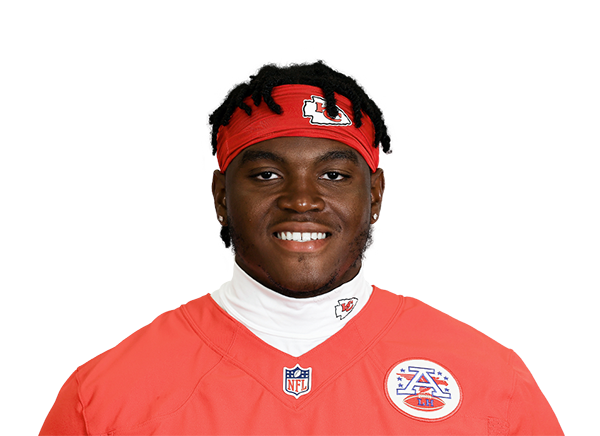 Chukwuebuka GodrickRT$1.0M$923K · 1 yr left−230% snaps
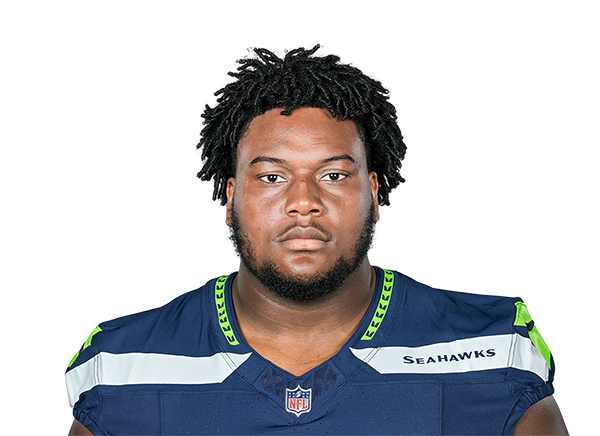 Christian HaynesRG$808K$1.5M · 2 yrs left+3735% snaps
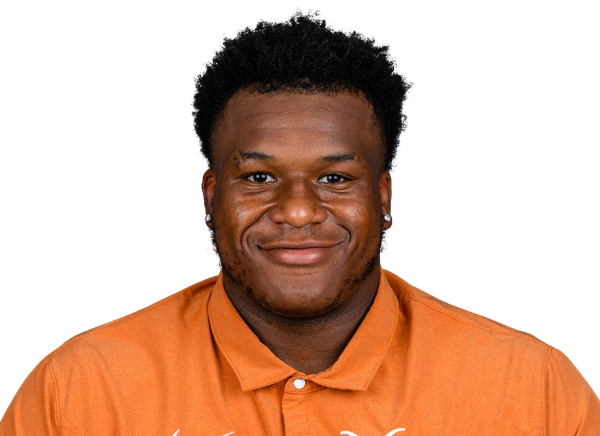 DJ CampbellRG$248K$248K · 1 yr left−40% snaps
14 contracts
Defensive line $28.4M
Player2026 capPer yearPaid / playedGapSnaps
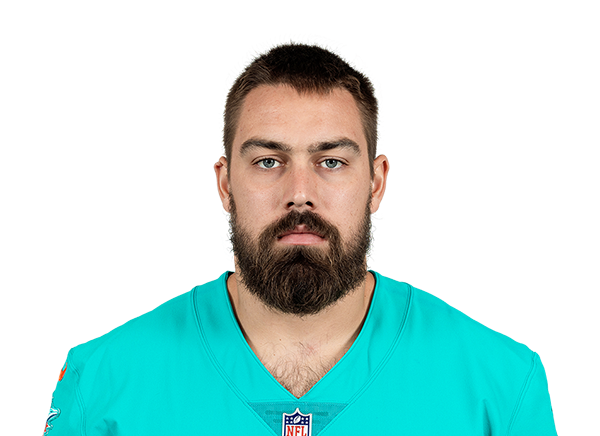 Zach SielerIDL$11.0M$21.3M · 2 yrs left+677% snaps
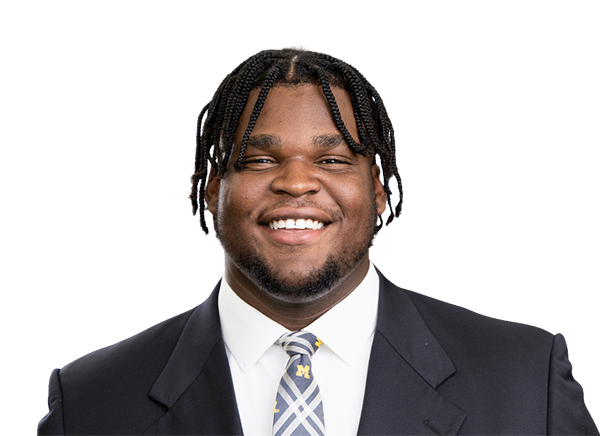 Kenneth GrantIDL$5.0M$5.5M · 3 yrs left−3418% snaps
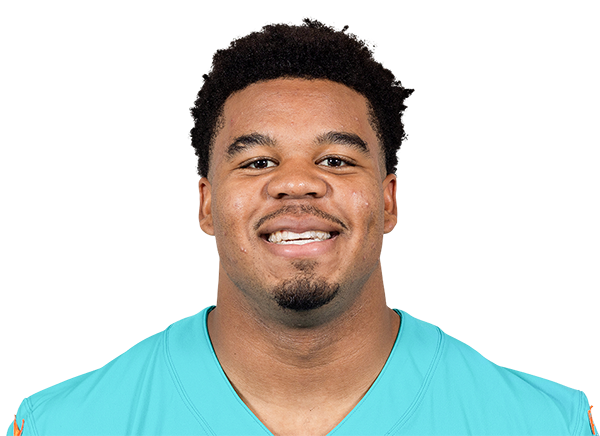 Chop RobinsonED$4.1M$3.7M · 2 yrs left+956% snaps
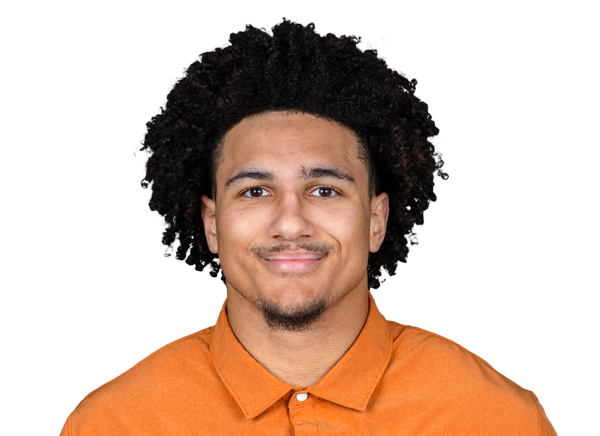 Trey MooreED · injured$1.4M$1.4M · 4 yrs left−460% snaps
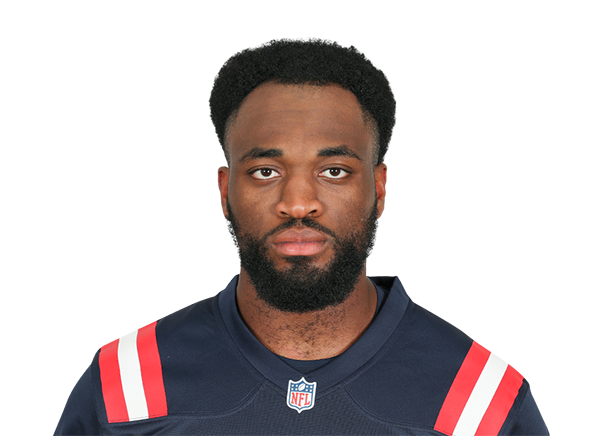 Josh UcheED$1.3M$1.4M · 1 yr left+4766% snaps
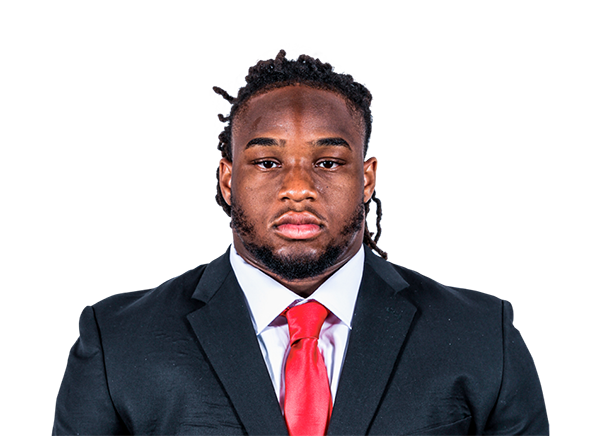 Jordan PhillipsIDL$1.1M$1.2M · 3 yrs left+5160% snaps
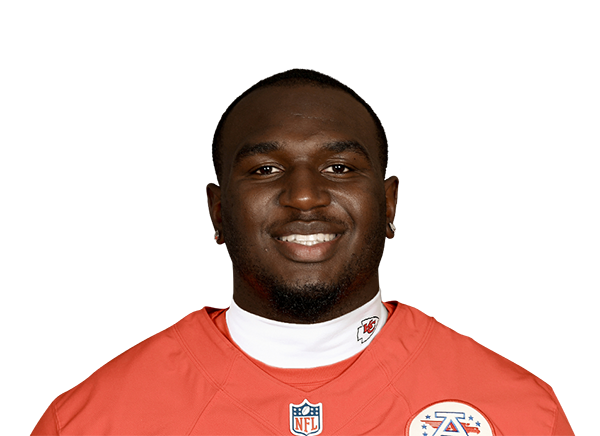 Malik HerringED$1.1M$1.2M · 1 yr left+2732% snaps
 Rene KongaIDL · injured$1.0M$1.0M · 3 yrs left−270% snaps
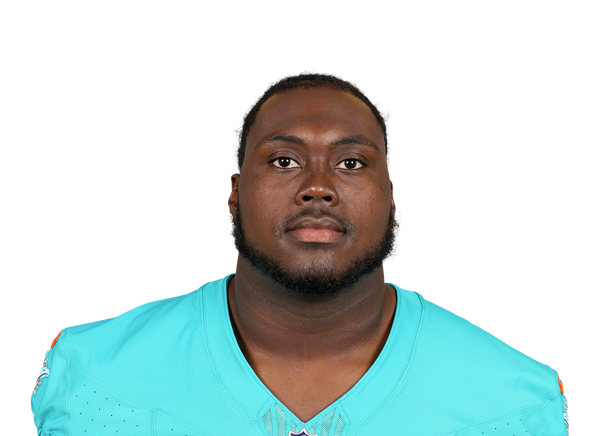 Zeek BiggersIDL$1.0M$1.1M · 3 yrs left+5860% snaps
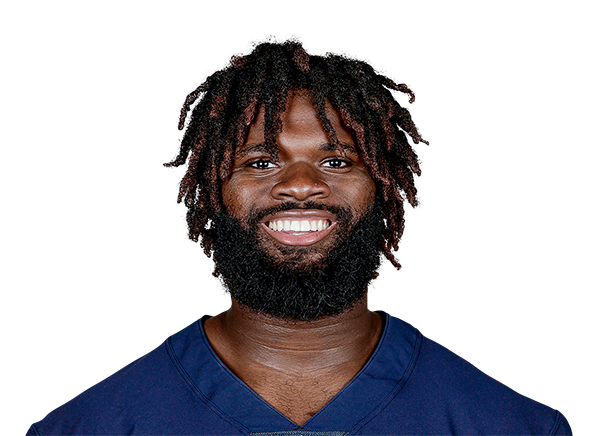 Jamree KromahED$614K$1.0M · 1 yr left+136% snaps
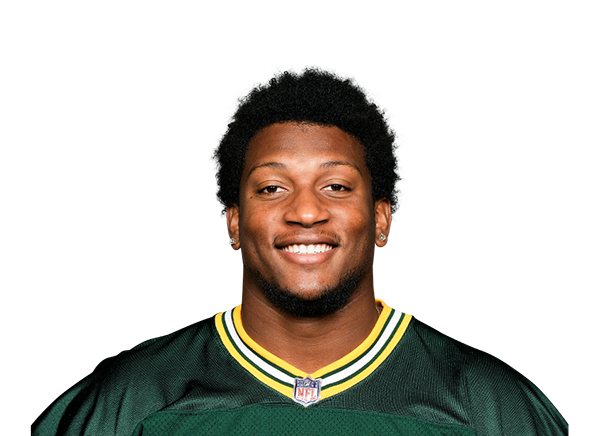 James EsterIDL$206K$248K · 1 yr left−30% snaps
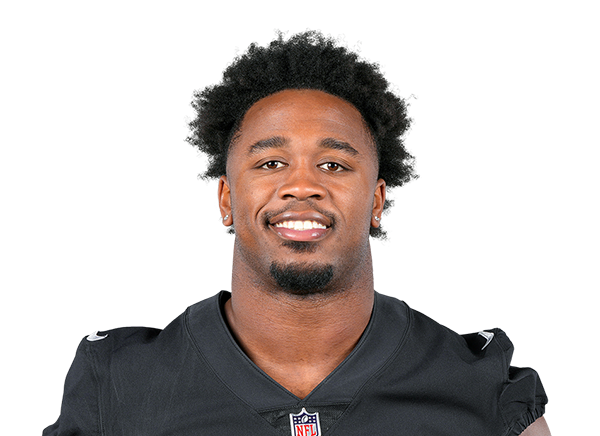 Amari GainerED$193K$248K · 1 yr left−20% snaps
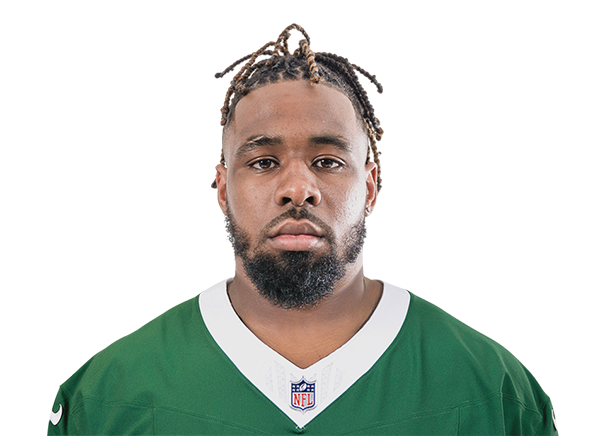 Eric WattsED$193K$248K · 1 yr left−20% snaps
 Jordan JeffersonIDL$179K$248K · 1 yr left−20% snaps
6 contracts
Linebackers $13.6M
Player2026 capPer yearPaid / playedGapSnaps
 Jordyn BrooksLB$6.2M$16.0M · 3 yrs left095% snaps
 Jacob RodriguezLB$2.9M$2.9M · 4 yrs left+26100% snaps
 Kyle LouisLB$1.3M$1.3M · 4 yrs left−75% snaps
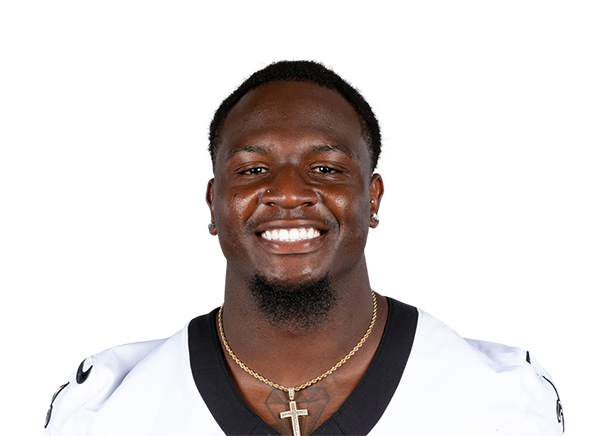 Willie Gay Jr.LB$1.3M$1.4M · 1 yr left+1644% snaps
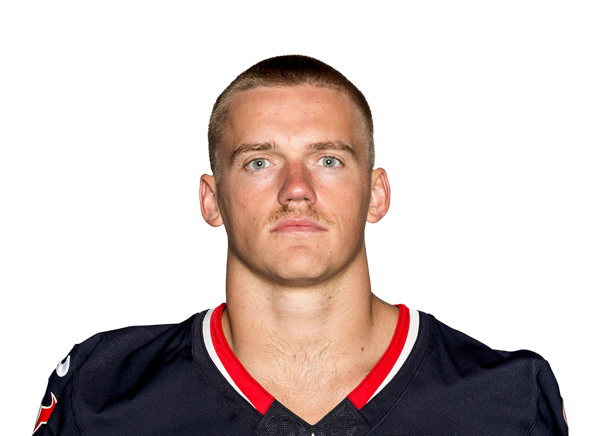 Jackson WoodardLB$1.0M$923K · 1 yr left+2310% snaps
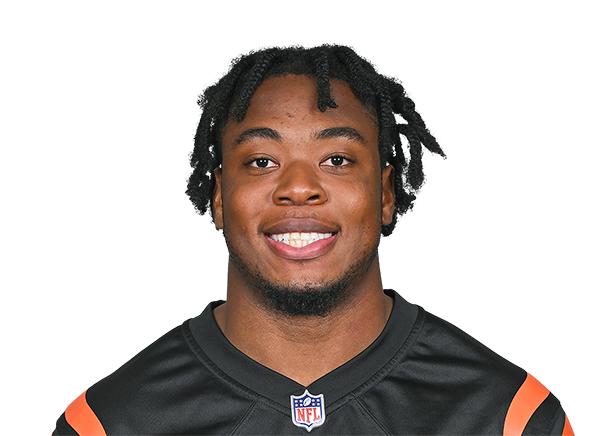 Shaka HeywardLB$896K$1.1M · 1 yr left+60% snaps
13 contracts
Secondary $16.2M
Player2026 capPer yearPaid / playedGapSnaps
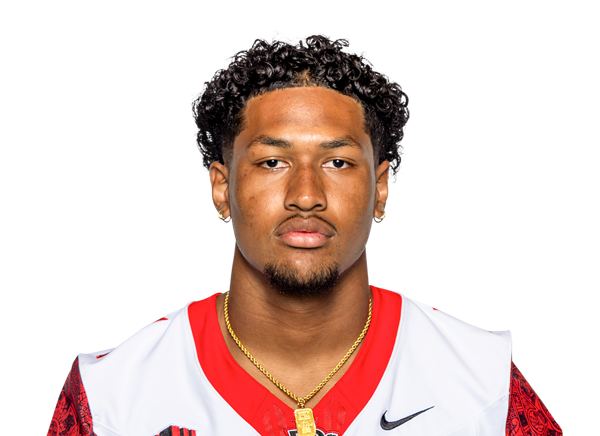 Chris JohnsonCB$4.8M$4.8M · 4 yrs left+1298% snaps
 Zayne AndersonS$1.3M$1.4M · 1 yr left+323% snaps
 Darrell Baker Jr.CB · injured$1.3M$1.4M · 1 yr left−440% snaps
 JuJu BrentsCB$1.2M$2.0M · 1 yr left+3370% snaps
 Michael TaaffeS$1.2M$1.2M · 4 yrs left+4895% snaps
 Jason Marshall Jr.CB$1.1M$1.2M · 3 yrs left+4675% snaps
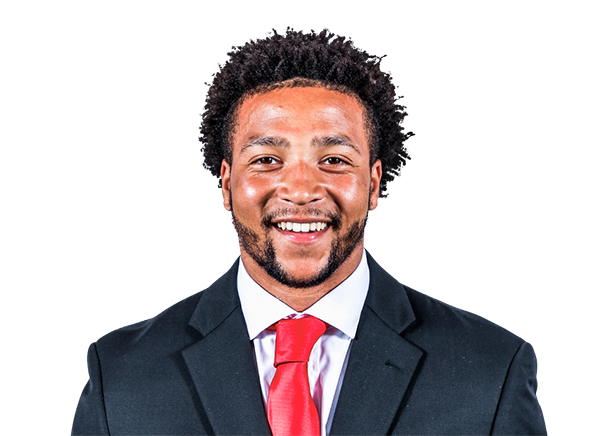 Dante Trader Jr.S$1.1M$1.2M · 3 yrs left+5183% snaps
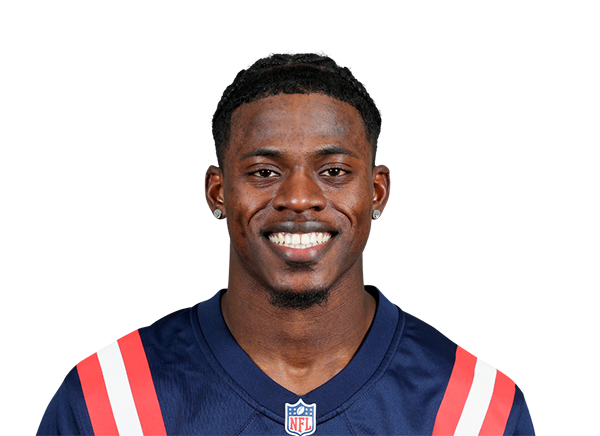 Marcellas Dial Jr.CB$1.1M$1.1M · 2 yrs left−270% snaps
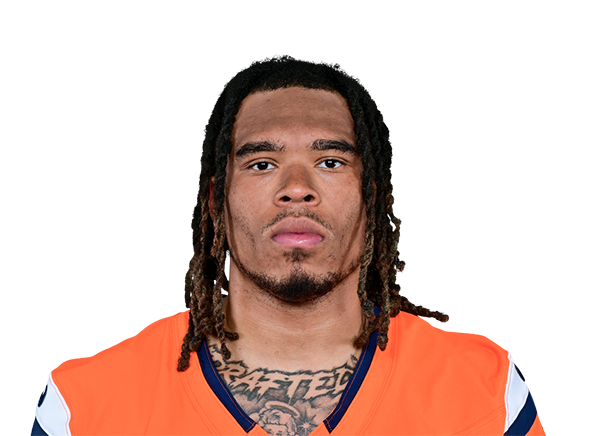 Reese TaylorCB$1.0M$923K · 1 yr left−210% snaps
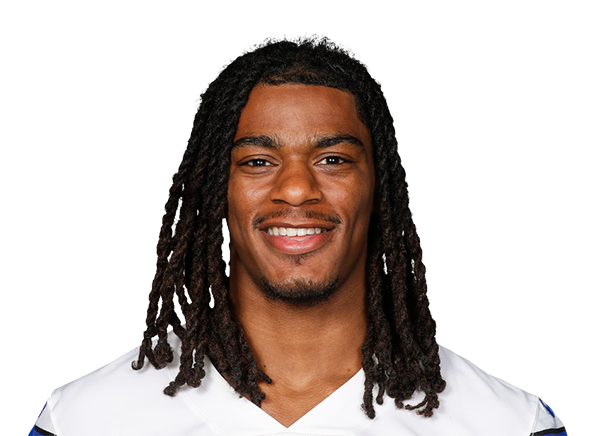 Julius WoodS$1.0M$1.1M · 2 yrs left+124% snaps
 Ronnie Harrison Jr.S · injured$693K$1.4M · 1 yr left−180% snaps
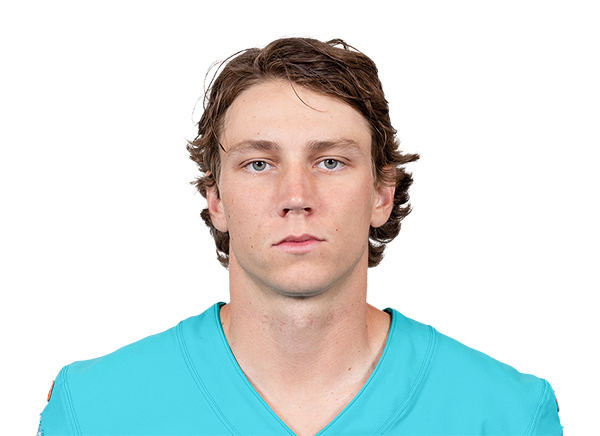 Ethan BonnerCB$248K$248K · 1 yr left−50% snaps
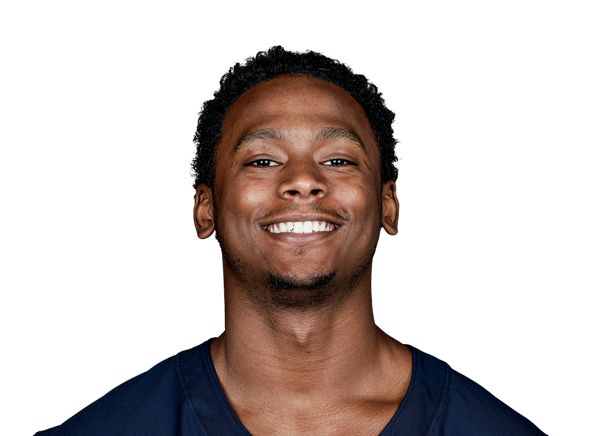 Major BurnsS$248K$248K · 1 yr left−50% snaps
2 contracts
Specialists $2.4M
Player2026 capPer yearPaid / playedGapSnaps
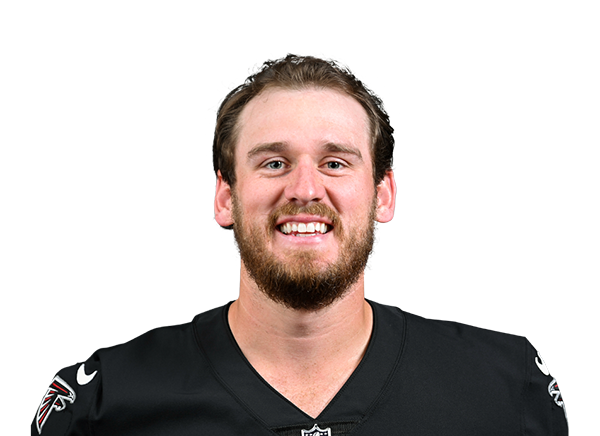 Bradley PinionP$1.3M$1.5M · 1 yr left+1914% snaps
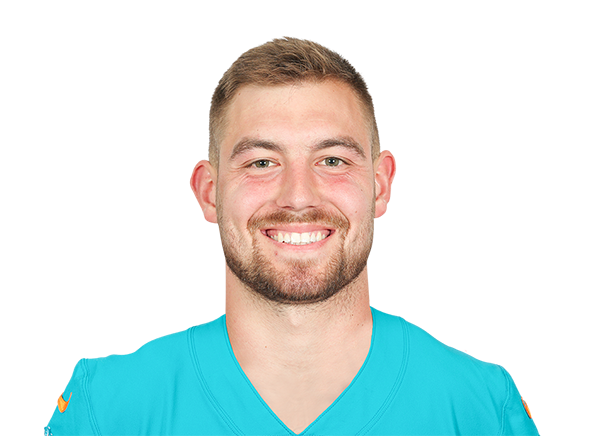 Tucker AddingtonLS$1.1M$1.1M · 1 yr left−812% snaps
Gold bar: where the player's pay ranks among his position group league-wide. Green bar: where his play ranks (EPA for skill players, share of snaps for everyone else). Gap = played minus paid, in percentile points.