 Pittsburgh SteelersAsked and Answered: Nov. 10
 New York GiantsGiants Now: Michael Strahan offers high praise of Arvell Reese
 Philadelphia EaglesAAA Official Review: What did the Eagles, Joe Milton learn from the QB's first start?
 Buffalo Bills'There's no panic' | The Bills stay strong through early struggles and injuries in MNF win over the Minnesota Vikings
 ESPNVikings left at QB crossroads after Carson Wentz's poor MNF showing vs. Bills
 Broncos DeskBroncos are 7-2, but the snaps say 4.1 wins and the 11th seed in the conference5 h ago
 Pro Football RumorsSeahawks Interested In Adding WR Depth
 InjuryCarl Granderson: Active → Cleared7 h ago
 ESPNCarson Beck next man up for Cardinals
The LabEvery contract against the field
 Atlanta FalconsThe cap file
68 contracts count $195M against the 2026 cap. 73% of it belongs to players on the field, 26th of 32. $11.3M is injured and $41.4M is healthy but not playing. The biggest building: offensive line, $55.8M, 9th in the league.
↳Bottom line73% of the Falcons cap is on the field (26th of 32). The most money goes to offensive line: $55.8M, 9th in the league.
?How to read this chart
- The skyline above:
- one building per position group, as tall as the cap hit (this season's salary-cap charge) Falcons spend on it, on the same scale as every other team. Lit windows are the share of that money on players who are actually on the field; dark windows are injured or idle money.
- The cards below:
- the same money in numbers. The bar fills with the share on the field, and "in spend" ranks the team among all 32 for that group.
Quarterbacks$9.4M67% on the field · 24th in spend
Running backs$13.3M75% on the field · 10th in spend
Wide receivers$19.2M78% on the field · 24th in spend
Tight ends$9.1M63% on the field · 25th in spend
Offensive line$55.8M84% on the field · 9th in spend
Defensive line$33.9M44% on the field · 30th in spend
Linebackers$16.6M69% on the field · 15th in spend
Secondary$30.3M81% on the field · 25th in spend
Specialists$6.9M100% on the field · 9th in spend
Best value on the roster
Earning more than they cost
↳Bottom lineBest value on the roster: Xavier Watts, played 96th and paid 51st among DBs.
?How to read the contract tables
- One row = one contract.
- 2026 cap hit, average per year and years left.
- Paid / played bars:
- the gold bar is where his pay ranks among players at his position across the league, the green bar where his play ranks (EPA, expected points added, for QB, RB, WR, TE; share of snaps for everyone else). Full bar = top of the league.
- Gap:
- played rank minus paid rank, in percentile points. Positive (green) means he gives more than he costs; negative (red) means the opposite.
4 contracts
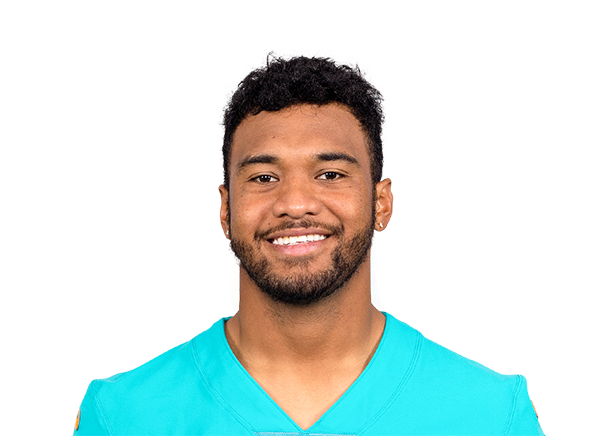
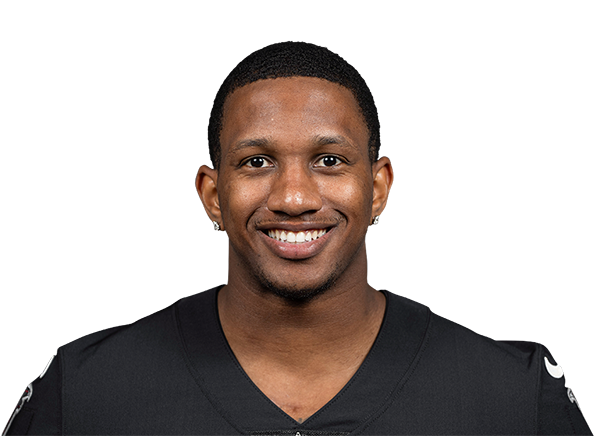
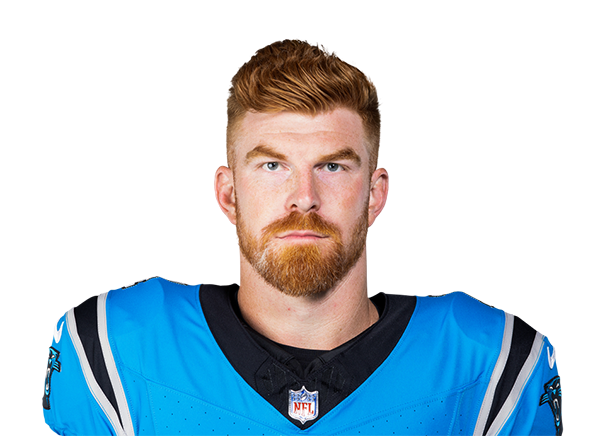
Quarterbacks $9.4M
4 contracts
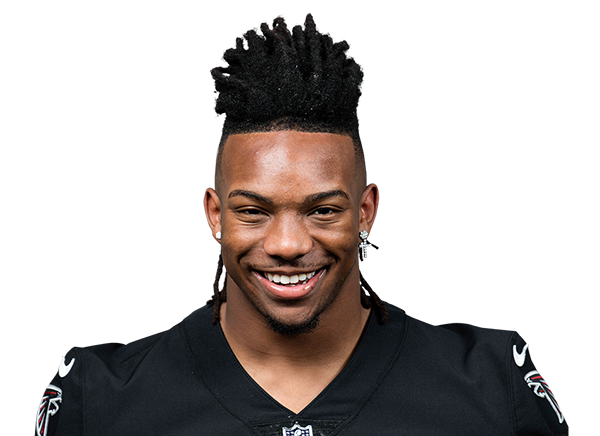
Running backs $13.3M
9 contracts
Wide receivers $19.2M
Player2026 capPer yearPaid / playedGapEPA
 Drake LondonWR$8.0M$35.3M · 4 yrs left+10+28.2 EPA
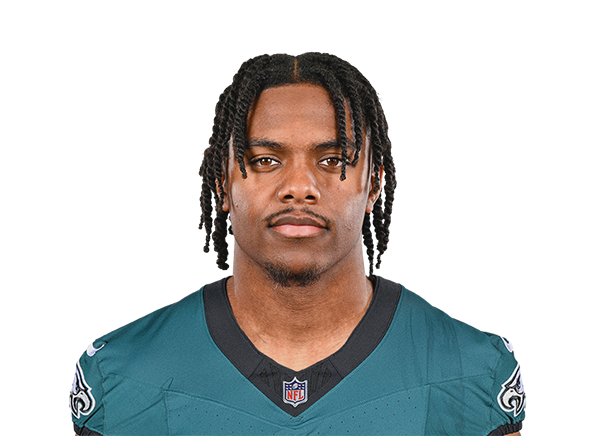 Jahan DotsonWR$5.0M$7.5M · 2 yrs left−46-4.8 EPA
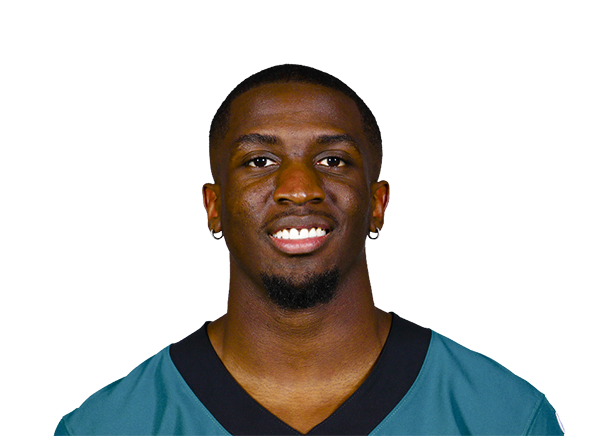 Olamide ZaccheausWR$2.0M$2.3M · 2 yrs left−32-14.2 EPA
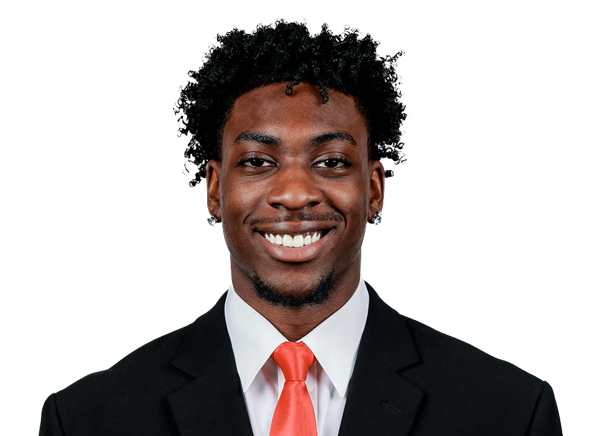 Zachariah BranchWR$1.8M$1.8M · 4 yrs left−10-0.6 EPA
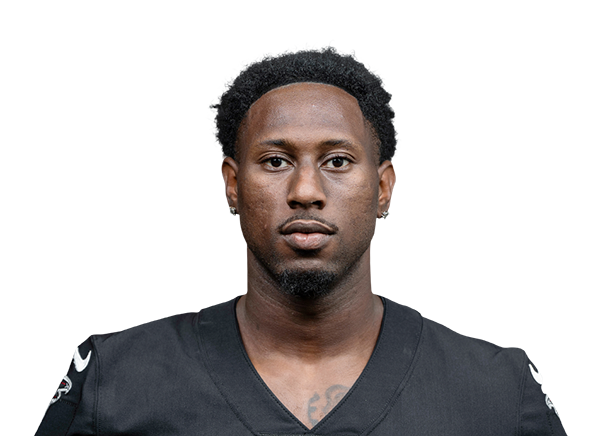 Chris BlairWR$1.1M$1.1M · 1 yr left+7-2.0 EPA
 Beaux CollinsWR$540K$1.1M · 2 yrs left−27+0.0 EPA
 Dylan DrummondWR$248K$248K · 1 yr left−7+0.0 EPA
 Antwane Wells Jr.WR$248K$248K · 1 yr left−7+0.0 EPA
 Vinny Anthony IIWR$248K$248K · 1 yr left−7+0.0 EPA
3 contracts
Tight ends $9.1M
Player2026 capPer yearPaid / playedGapEPA
 Charlie WoernerTE$5.8M$4.0M · 1 yr left−47-6.4 EPA
 Austin HooperTE$3.2M$3.3M · 1 yr left+12+8.3 EPA
 E.J. JenkinsTE$151K$248K · 1 yr left0+0.0 EPA
14 contracts
Offensive line $55.8M
Player2026 capPer yearPaid / playedGapSnaps
 Jake MatthewsLT$16.8M$22.5M · 1 yr left−2092% snaps
 Chris LindstromRG$14.5M$20.5M · 2 yrs left−1697% snaps
 Ryan NeuzilC$6.2M$4.8M · 1 yr left+5100% snaps
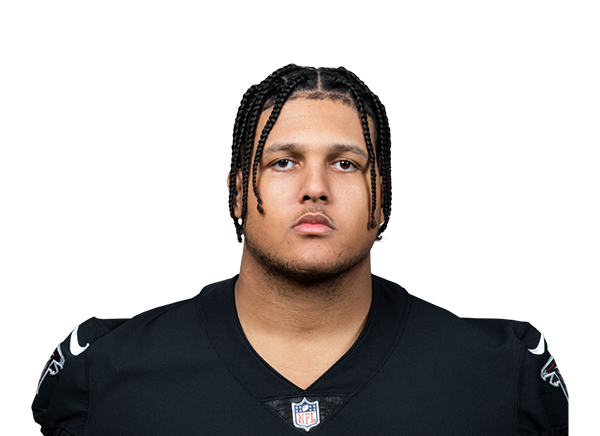 Matthew BergeronLG$5.0M$23.5M · 4 yrs left+9100% snaps
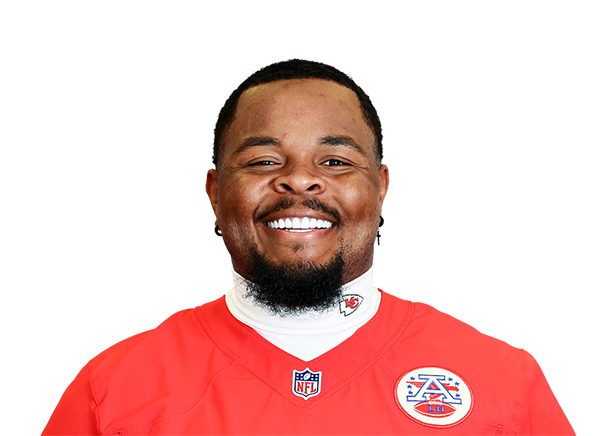 Jawaan TaylorRT$4.6M$5.0M · 1 yr left095% snaps
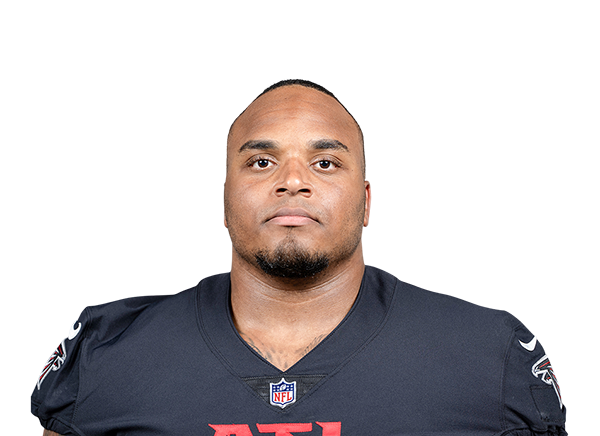 Kyle HintonRG$3.3M$2.9M · 1 yr left−244% snaps
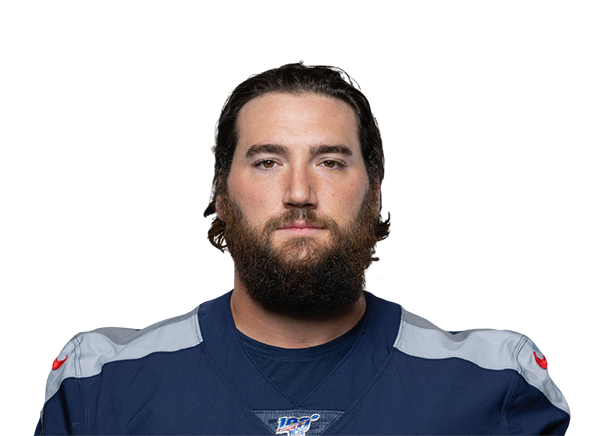 Corey LevinC$1.3M$1.5M · 1 yr left−53% snaps
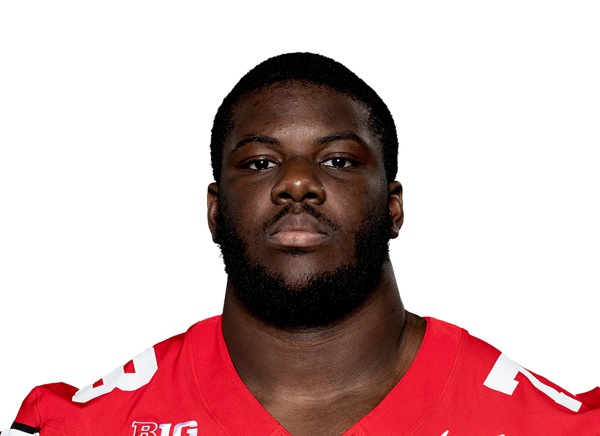 Ethan OnianwaLG$1.1M$1.1M · 4 yrs left−360% snaps
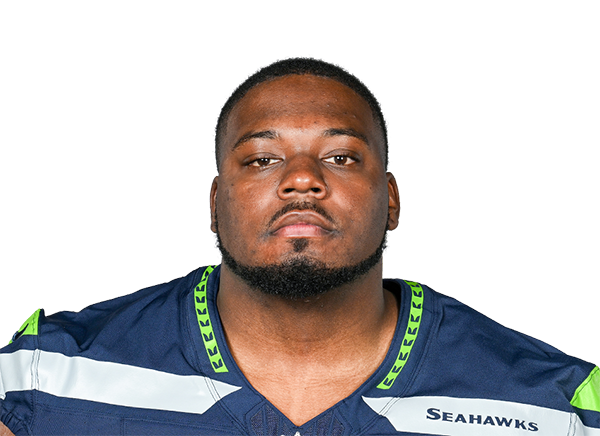 Michael JerrellRT · injured$1.1M$1.0M · 2 yrs left+1714% snaps
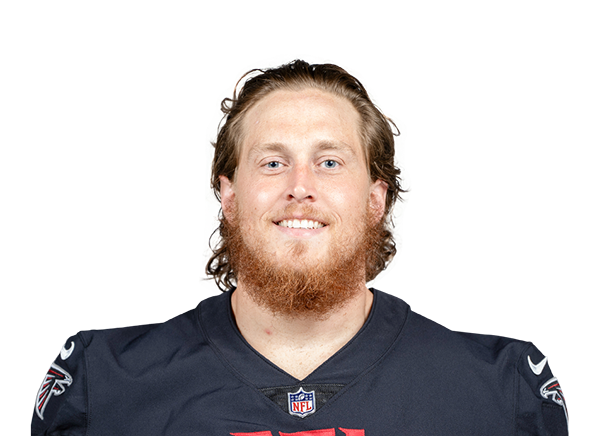 Storm NortonRT · injured$715K$1.5M · 1 yr left−200% snaps
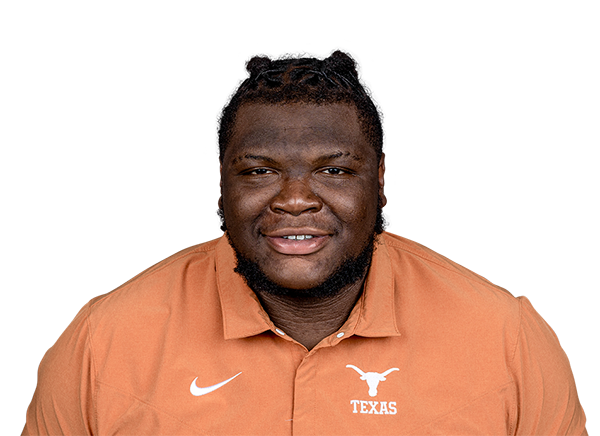 Cameron WilliamsRT · injured$515K$1.1M · 3 yrs left−170% snaps
 Riley MahlmanLT$248K$248K · 1 yr left−40% snaps
 Josh ThompsonLG$248K$248K · 1 yr left−40% snaps
 Kam DewberryLG$248K$248K · 1 yr left−40% snaps
14 contracts
Defensive line $33.9M
Player2026 capPer yearPaid / playedGapSnaps
 Za'Darius SmithED$5.3M$6.0M · 1 yr left−3321% snaps
 Jalon WalkerED$4.7M$5.1M · 3 yrs left−750% snaps
 Gervon Dexter Sr.IDL$3.6M$19.5M · 4 yrs left+1557% snaps
 James Pearce Jr.ED$3.4M$4.2M · 3 yrs left−372% snaps
 Cameron ThomasED$3.1M$3.1M · 1 yr left+2363% snaps
 Da'Shawn HandED · injured$3.0M$3.0M · 1 yr left−361% snaps
 LaCale LondonIDL$2.7M$2.8M · 1 yr left+544% snaps
 Samson EbukamED · injured$2.6M$2.8M · 1 yr left038% snaps
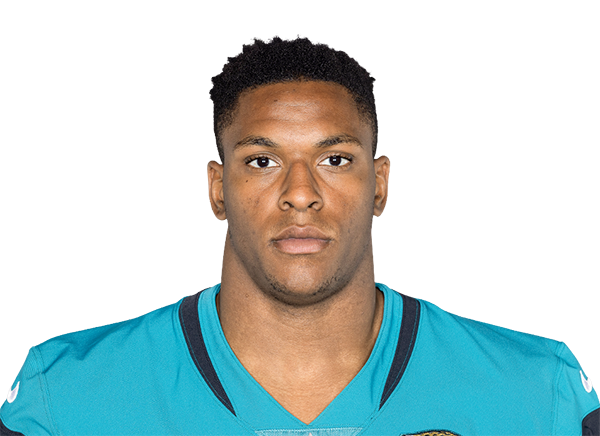 Maason SmithIDL$1.5M$2.0M · 2 yrs left+2955% snaps
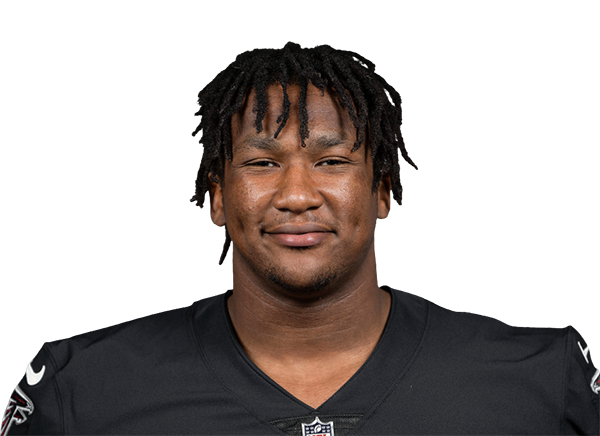 Brandon DorlusIDL$1.3M$1.2M · 2 yrs left+3455% snaps
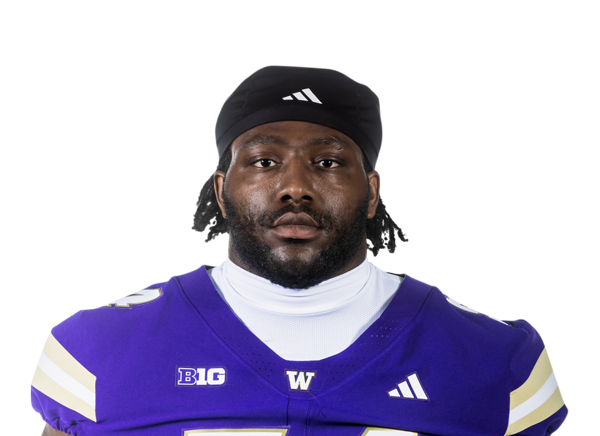 Anterio ThompsonIDL · injured$1.2M$1.2M · 4 yrs left−380% snaps
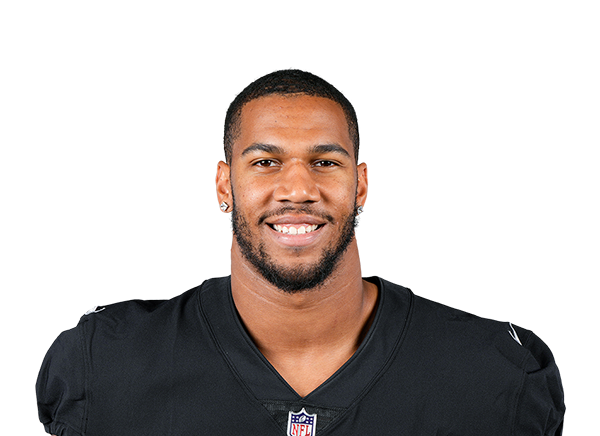 Charles SnowdenED$717K$1.1M · 1 yr left+149% snaps
 DeAngelo MaloneED · injured$615K$1.5M · 1 yr left−190% snaps
 Zacch PickensIDL$248K$248K · 1 yr left−60% snaps
7 contracts
Linebackers $16.6M
Player2026 capPer yearPaid / playedGapSnaps
 Divine DeabloLB$8.9M$7.0M · 1 yr left−2262% snaps
 Christian HarrisLB$2.7M$2.8M · 1 yr left−351% snaps
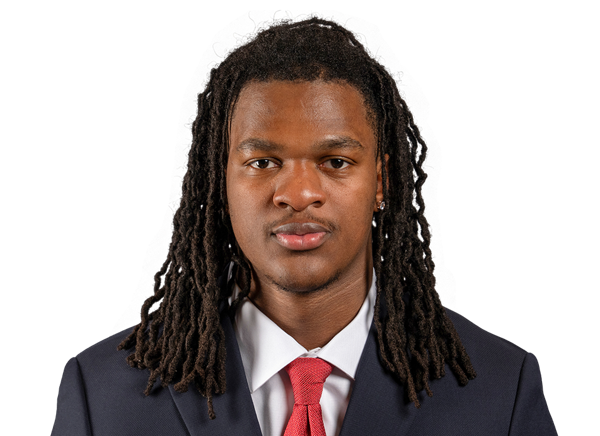 Kendal DanielsLB$1.3M$1.3M · 4 yrs left+2468% snaps
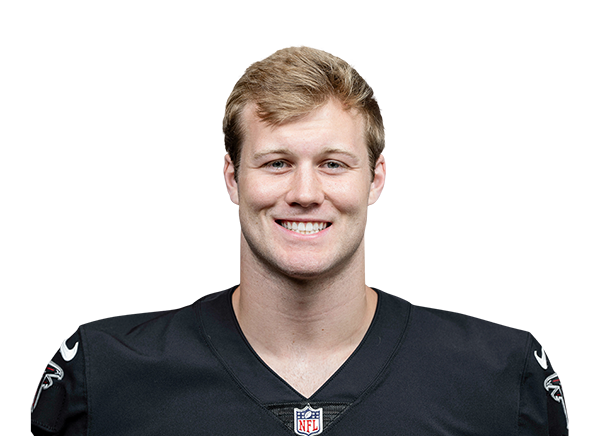 JD BertrandLB · injured$1.2M$1.1M · 2 yrs left−410% snaps
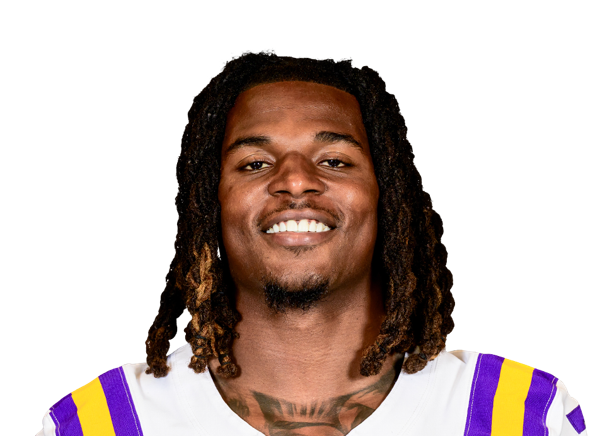 Harold Perkins Jr.LB$1.1M$1.1M · 4 yrs left+3256% snaps
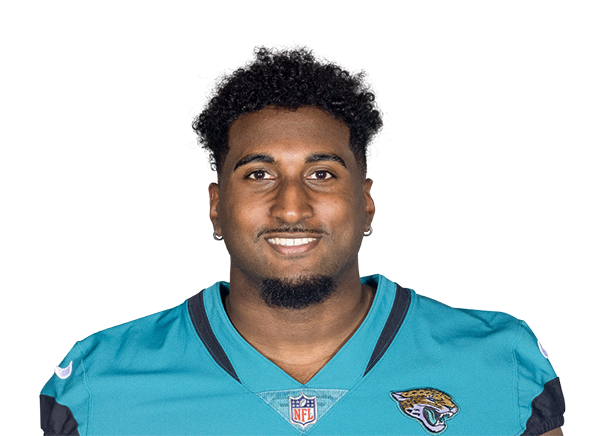 Yasir AbdullahLB$1.1M$1.1M · 1 yr left+1415% snaps
 TJ QuinnLB$248K$248K · 1 yr left−10% snaps
10 contracts
Secondary $30.3M
Player2026 capPer yearPaid / playedGapSnaps
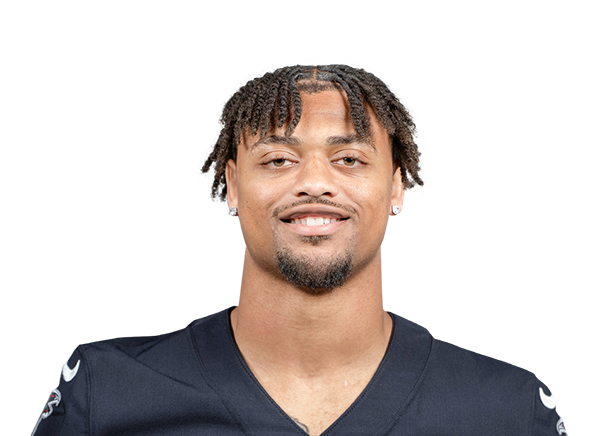 A.J. Terrell Jr.CB$13.5M$20.3M · 2 yrs left−3541% snaps
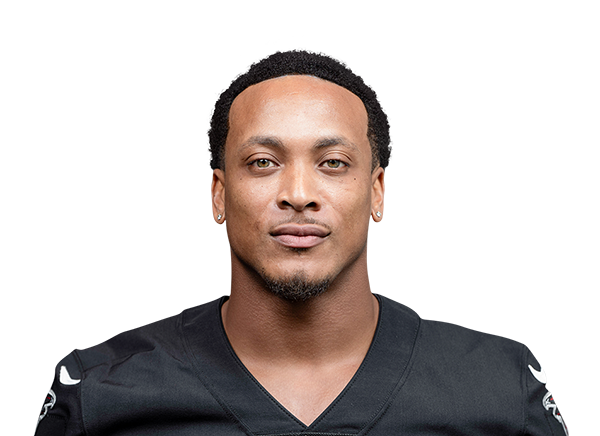 Mike HughesCB$5.5M$6.0M · 2 yrs left−771% snaps
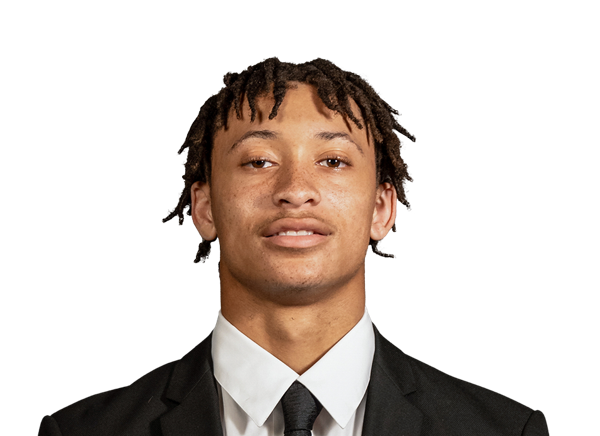 Avieon TerrellCB$2.6M$2.6M · 4 yrs left−1037% snaps
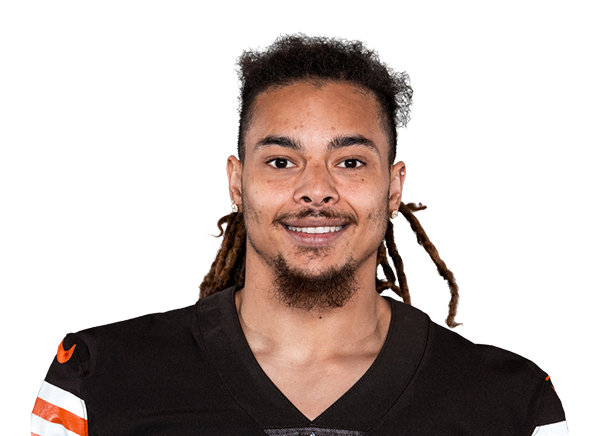 Mike Ford Jr.CB$2.2M$4.0M · final year−390% snaps
 Sydney BrownS$1.5M$1.4M · 1 yr left036% snaps
 Xavier WattsS$1.4M$1.5M · 3 yrs left+4599% snaps
 Billy Bowman Jr.S$1.3M$1.3M · 3 yrs left+422% snaps
 DeMarcco HellamsS$1.2M$987K · 1 yr left−34% snaps
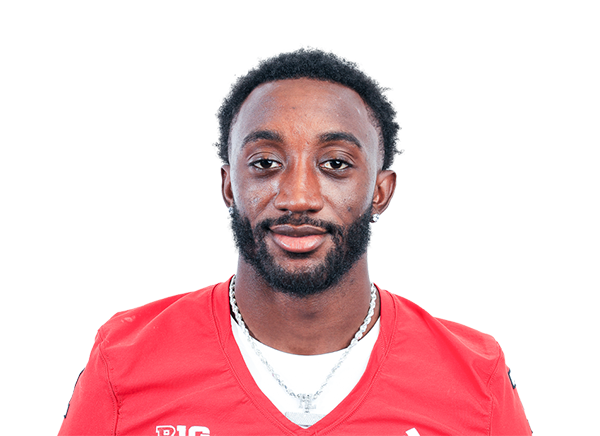 Robert LongerbeamCB$787K$1.0M · 3 yrs left−180% snaps
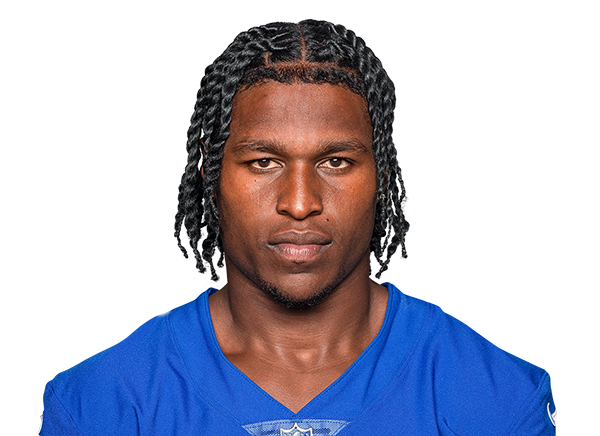 Darnay HolmesCB$411K$411K · 1 yr left−140% snaps
3 contracts
Specialists $6.9M
Player2026 capPer yearPaid / playedGapSnaps
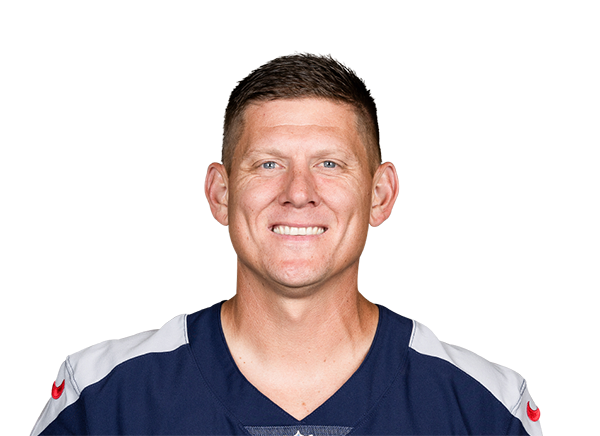 Nick FolkK$3.3M$4.5M · 2 yrs left−2614% snaps
 Jake BaileyP$2.2M$3.0M · 3 yrs left−2913% snaps
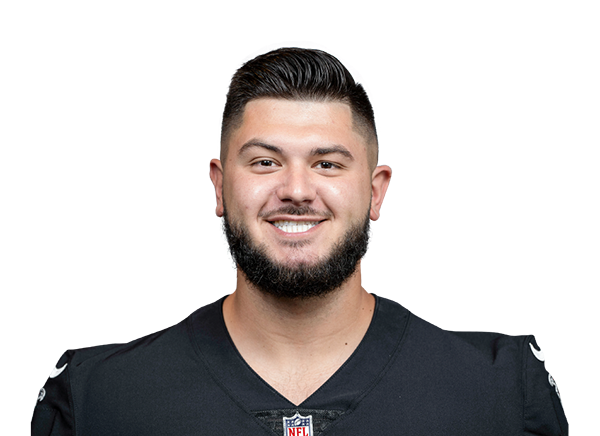 Liam McCulloughLS$1.4M$1.4M · 3 yrs left−1812% snaps
Gold bar: where the player's pay ranks among his position group league-wide. Green bar: where his play ranks (EPA for skill players, share of snaps for everyone else). Gap = played minus paid, in percentile points.