 Pittsburgh SteelersAsked and Answered: Nov. 10
 New York GiantsGiants Now: Michael Strahan offers high praise of Arvell Reese
 Buffalo Bills'There's no panic' | The Bills stay strong through early struggles and injuries in MNF win over the Minnesota Vikings
 ESPNVikings left at QB crossroads after Carson Wentz's poor MNF showing vs. Bills
 Broncos DeskBroncos are 7-2, but the snaps say 4.1 wins and the 11th seed in the conference5 h ago
 Pro Football RumorsSeahawks Interested In Adding WR Depth
 InjuryCarl Granderson: Active → Cleared7 h ago
 ESPNCarson Beck next man up for Cardinals
The LabEvery contract against the field
 Philadelphia EaglesThe cap file
62 contracts count $215M against the 2026 cap. 84% of it belongs to players on the field, 9th of 32. $3.4M is injured and $31.0M is healthy but not playing. The biggest building: offensive line, $57.3M, 8th in the league.
↳Bottom line84% of the Eagles cap is on the field (9th of 32). The most money goes to offensive line: $57.3M, 8th in the league.
?How to read this chart
- The skyline above:
- one building per position group, as tall as the cap hit (this season's salary-cap charge) Eagles spend on it, on the same scale as every other team. Lit windows are the share of that money on players who are actually on the field; dark windows are injured or idle money.
- The cards below:
- the same money in numbers. The bar fills with the share on the field, and "in spend" ranks the team among all 32 for that group.
Quarterbacks$35.1M94% on the field · 12th in spend
Running backs$12.6M78% on the field · 13th in spend
Wide receivers$23.6M82% on the field · 19th in spend
Tight ends$15.2M76% on the field · 8th in spend
Offensive line$57.3M93% on the field · 8th in spend
Defensive line$30.4M68% on the field · 31st in spend
Linebackers$13.3M92% on the field · 23rd in spend
Secondary$20.0M65% on the field · 30th in spend
Specialists$7.4M100% on the field · 6th in spend
Best value on the roster
Earning more than they cost
↳Bottom lineBest value on the roster: Andrew Mukuba, played 97th and paid 57th among DBs.
?How to read the contract tables
- One row = one contract.
- 2026 cap hit, average per year and years left.
- Paid / played bars:
- the gold bar is where his pay ranks among players at his position across the league, the green bar where his play ranks (EPA, expected points added, for QB, RB, WR, TE; share of snaps for everyone else). Full bar = top of the league.
- Gap:
- played rank minus paid rank, in percentile points. Positive (green) means he gives more than he costs; negative (red) means the opposite.
4 contracts
Quarterbacks $35.1M
3 contracts
Running backs $12.6M
Player2026 capPer yearPaid / playedGapEPA
 Saquon BarkleyRB$9.9M$20.6M · 1 yr left−41-5.3 EPA
 Tank BigsbyRB$1.5M$1.3M · 1 yr left−18-10.4 EPA
 Will ShipleyRB · injured$1.3M$1.2M · 2 yrs left−4-8.9 EPA
9 contracts
Wide receivers $23.6M
Player2026 capPer yearPaid / playedGapEPA
 DeVonta SmithWR$10.7M$25.0M · 1 yr left−36+0.8 EPA
 Makai LemonWR$5.2M$5.2M · 4 yrs left−13+4.5 EPA
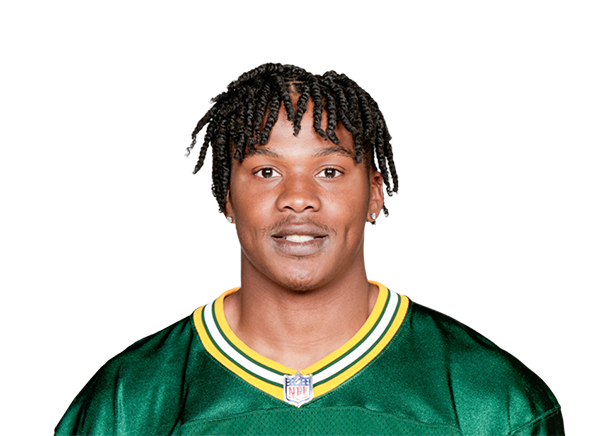 Dontayvion WicksWR$2.3M$10.3M · 1 yr left+23+16.1 EPA
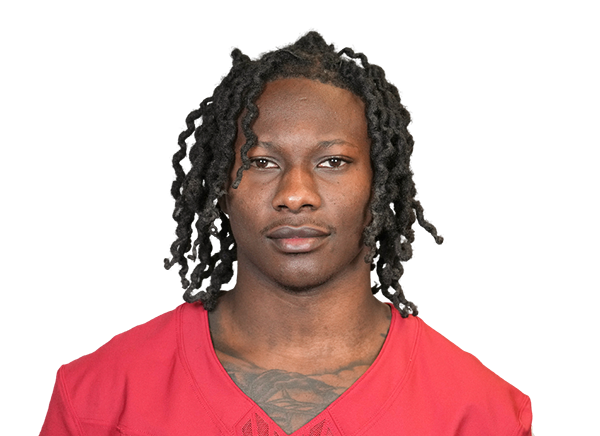 Hollywood BrownWR$2.0M$5.0M · 1 yr left−8+0.6 EPA
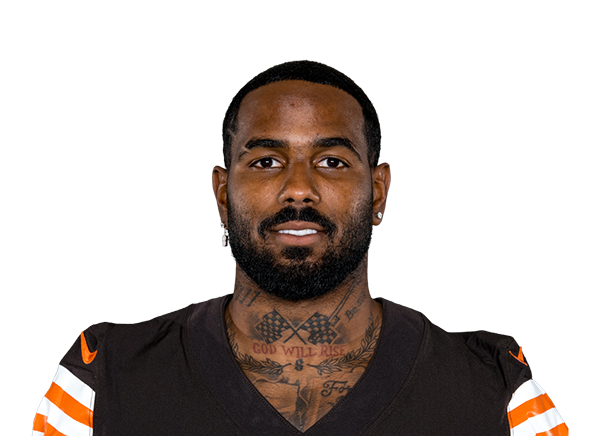 Elijah MooreWR$1.2M$1.3M · 1 yr left−3-2.7 EPA
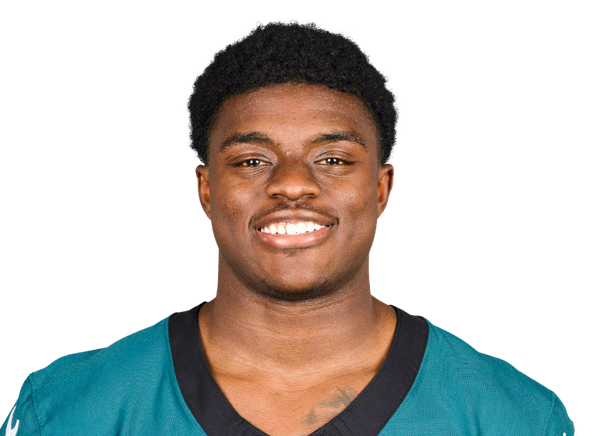 Darius CooperWR$1.0M$993K · 2 yrs left+28+1.1 EPA
 Johnny WilsonWR · injured$589K$1.1M · 2 yrs left−28+0.0 EPA
 Xavier GipsonWR$330K$330K · 1 yr left−24+0.0 EPA
 Erik EzukanmaWR$193K$248K · 1 yr left−2+0.0 EPA
4 contracts
Tight ends $15.2M
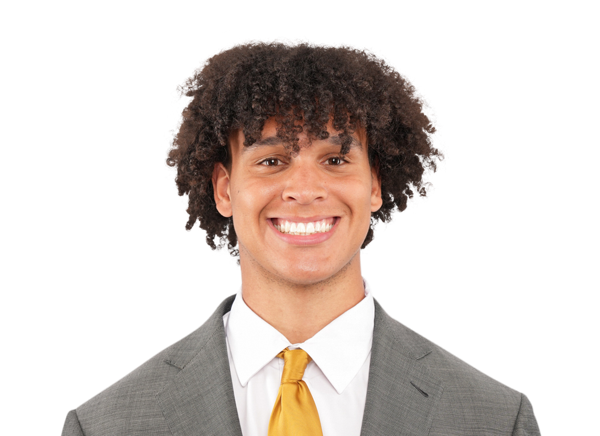
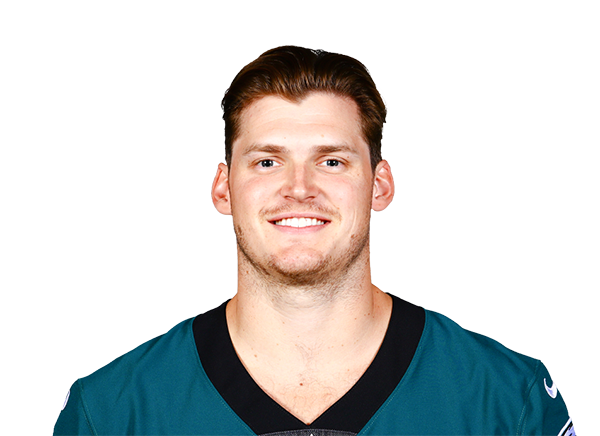
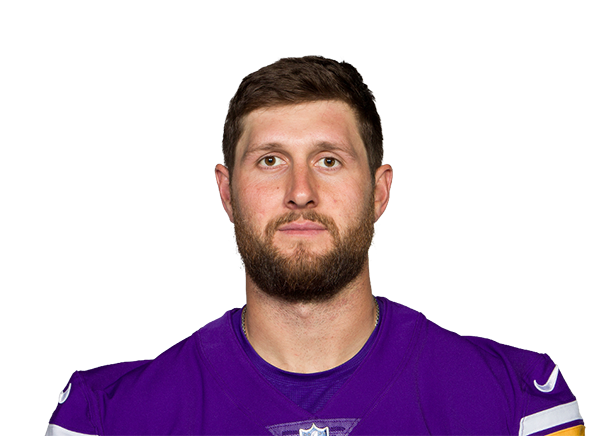
11 contracts
Offensive line $57.3M
Player2026 capPer yearPaid / playedGapSnaps
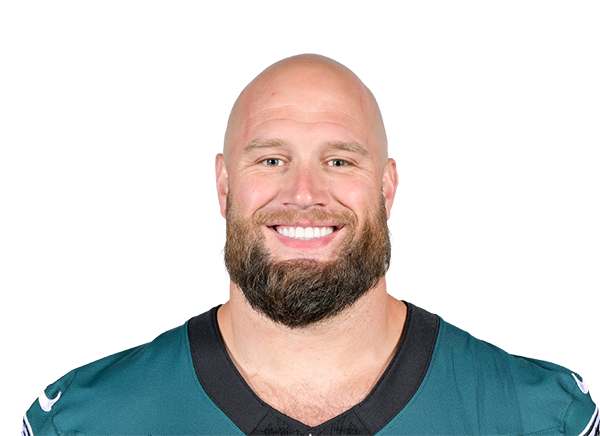 Lane JohnsonRT$20.3M$25.0M · final year−4132% snaps
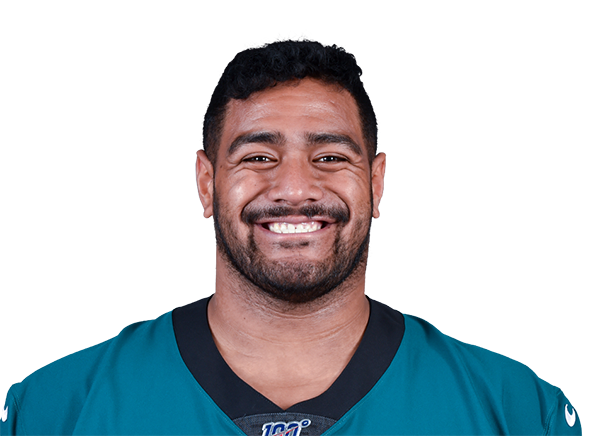 Jordan MailataLT$15.9M$22.0M · 1 yr left−8100% snaps
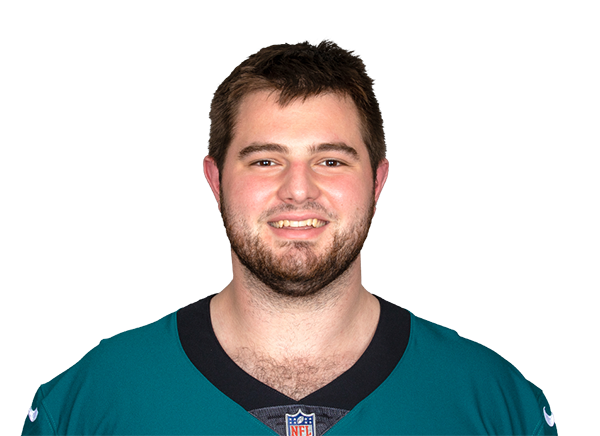 Landon DickersonLG$10.3M$21.0M · 2 yrs left−2745% snaps
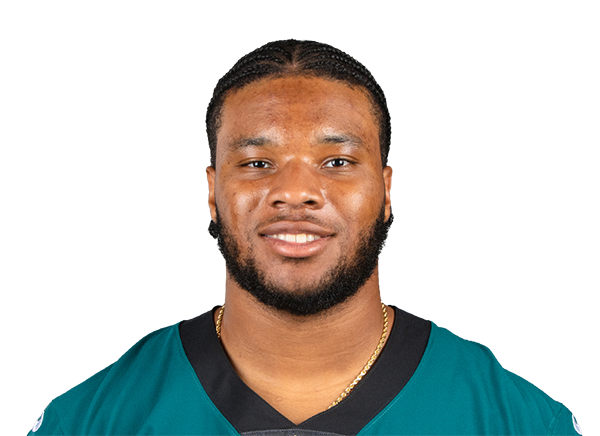 Tyler SteenRT$4.0M$1.4M · 1 yr left+798% snaps
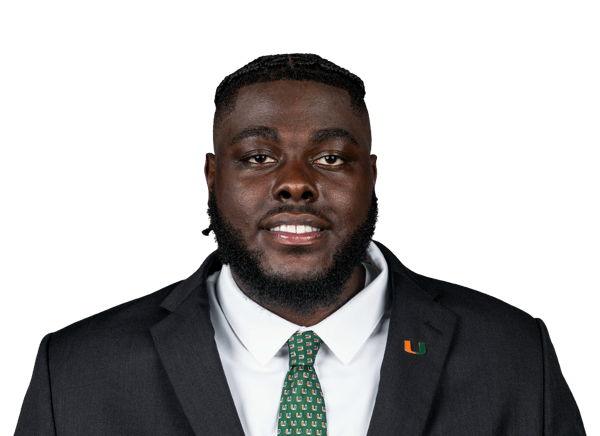 Markel BellLT$1.8M$1.8M · 4 yrs left+869% snaps
 Fred JohnsonRG$1.5M$2.1M · 1 yr left−104% snaps
 Micah MorrisLG$1.2M$1.2M · 4 yrs left−50% snaps
 Drew KendallC$1.1M$1.1M · 3 yrs left+3468% snaps
 Willie LampkinRG$885K$998K · 2 yrs left+3223% snaps
 Kiran AmegadjieLT$248K$248K · 1 yr left−40% snaps
 Evan NealRT$220K$330K · 1 yr left−30% snaps
13 contracts
Defensive line $30.4M
Player2026 capPer yearPaid / playedGapSnaps
 Jalen CarterIDL$9.2M$38.0M · 4 yrs left+1284% snaps
 Jonathan GreenardED$6.3M$30.0M · 2 yrs left−3225% snaps
 Moro OjomoIDL$3.7M$979K · 1 yr left+1760% snaps
 Nolan Smith Jr.ED$2.8M$3.0M · 1 yr left+1957% snaps
 Arnold EbiketieED$1.9M$4.3M · 1 yr left+1848% snaps
 Jalyx HuntED$1.5M$1.4M · 2 yrs left+2551% snaps
 Byron YoungIDL$1.5M$1.4M · 1 yr left027% snaps
 Ty RobinsonIDL$1.3M$1.3M · 3 yrs left−810% snaps
 AJ EpenesaED$1.3M$1.4M · 1 yr left−611% snaps
 Zion WilsonIDL$248K$248K · 1 yr left−60% snaps
 Joshua WeruED$248K$248K · 1 yr left−60% snaps
 Uar BernardIDL$248K$248K · 1 yr left−60% snaps
 Gabe HallIDL$206K$248K · 1 yr left−30% snaps
4 contracts
Linebackers $13.3M
11 contracts
Secondary $20.0M
Player2026 capPer yearPaid / playedGapSnaps
 Quinyon MitchellCB$4.0M$3.7M · 2 yrs left+992% snaps
 Riq WoolenCB$3.4M$12.0M · 1 yr left+1287% snaps
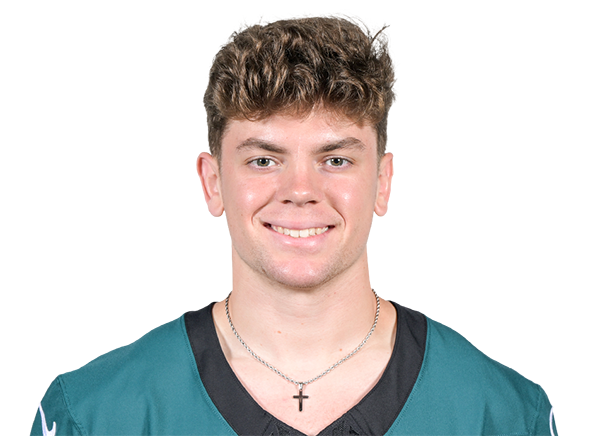 Cooper DeJeanCB$2.5M$2.3M · 2 yrs left+3099% snaps
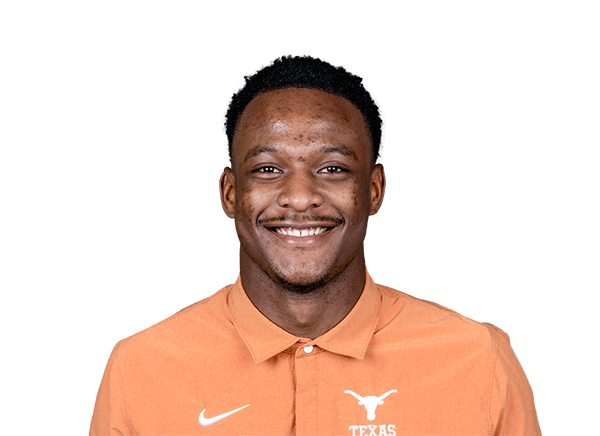 Andrew MukubaS$1.6M$1.8M · 3 yrs left+40100% snaps
 Marcus EppsS$1.4M$1.6M · 1 yr left−228% snaps
 Jonathan JonesCB$1.4M$2.0M · 1 yr left−149% snaps
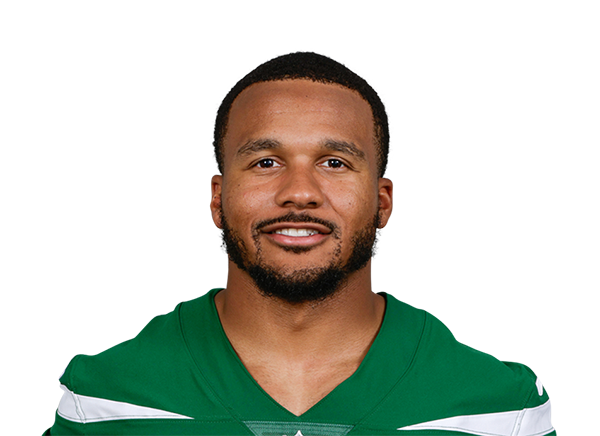 Michael Carter IICB$1.4M$2.8M · 1 yr left−521% snaps
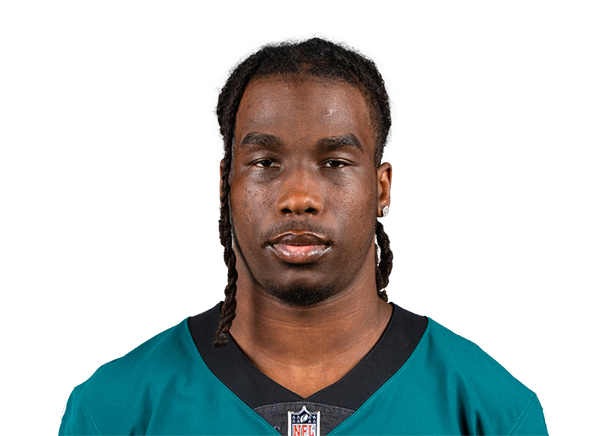 Kelee RingoCB$1.4M$1.2M · 1 yr left−220% snaps
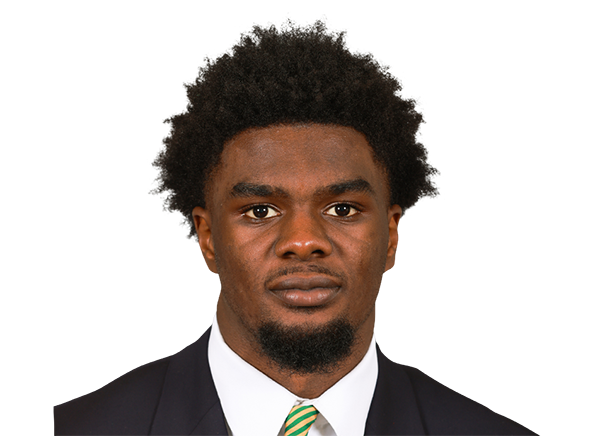 Mac McWilliamsCB$1.1M$1.2M · 3 yrs left−50% snaps
 Tucker LargeS · injured$1.0M$1.0M · 3 yrs left−230% snaps
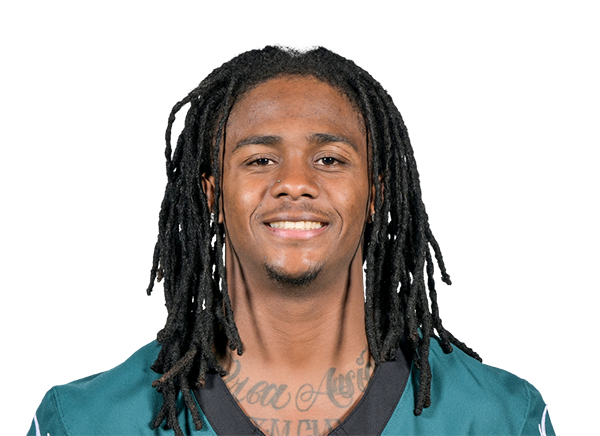 Andre' SamS · injured$540K$1.1M · 2 yrs left−150% snaps
3 contracts
Specialists $7.4M
Player2026 capPer yearPaid / playedGapSnaps
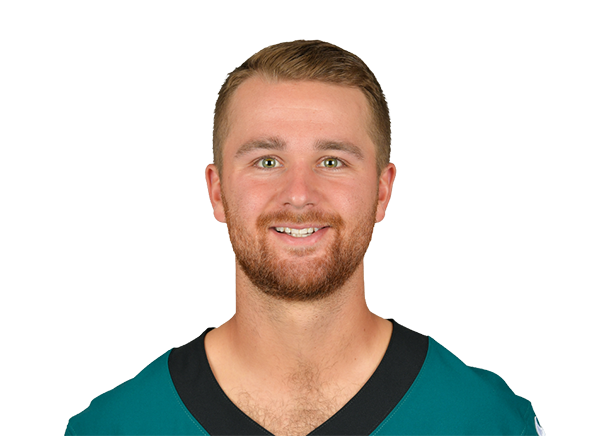 Jake ElliottK$4.7M$5.7M · 3 yrs left−8011% snaps
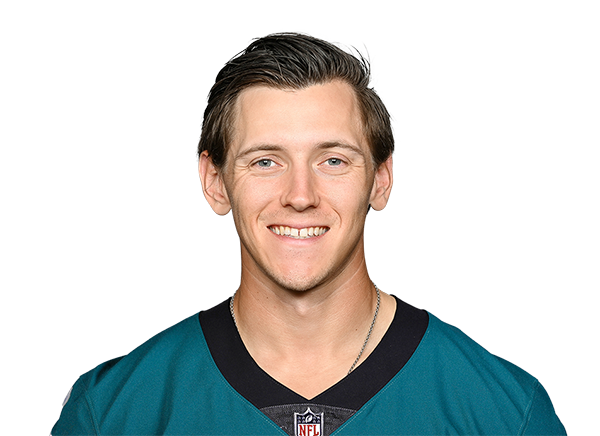 Braden MannP$1.7M$3.5M · 4 yrs left−814% snaps
 Rocco UnderwoodLS$1.0M$1.0M · 3 yrs left+3513% snaps
Gold bar: where the player's pay ranks among his position group league-wide. Green bar: where his play ranks (EPA for skill players, share of snaps for everyone else). Gap = played minus paid, in percentile points.