 Pittsburgh SteelersAsked and Answered: Nov. 10
 New York GiantsGiants Now: Michael Strahan offers high praise of Arvell Reese
 Philadelphia EaglesAAA Official Review: What did the Eagles, Joe Milton learn from the QB's first start?
 Buffalo Bills'There's no panic' | The Bills stay strong through early struggles and injuries in MNF win over the Minnesota Vikings
 ESPNVikings left at QB crossroads after Carson Wentz's poor MNF showing vs. Bills
 Broncos DeskBroncos are 7-2, but the snaps say 4.1 wins and the 11th seed in the conference5 h ago
 Pro Football RumorsSeahawks Interested In Adding WR Depth
 InjuryCarl Granderson: Active → Cleared7 h ago
 ESPNCarson Beck next man up for Cardinals
The LabEvery contract against the field
 Indianapolis ColtsThe cap file
70 contracts count $193M against the 2026 cap. 72% of it belongs to players on the field, 27th of 32. $17.4M is injured and $36.0M is healthy but not playing. The biggest building: secondary, $55.0M, 5th in the league.
↳Bottom line72% of the Colts cap is on the field (27th of 32). The most money goes to secondary: $55.0M, 5th in the league.
?How to read this chart
- The skyline above:
- one building per position group, as tall as the cap hit (this season's salary-cap charge) Colts spend on it, on the same scale as every other team. Lit windows are the share of that money on players who are actually on the field; dark windows are injured or idle money.
- The cards below:
- the same money in numbers. The bar fills with the share on the field, and "in spend" ranks the team among all 32 for that group.
Quarterbacks$11.9M0% on the field · 23rd in spend
Running backs$18.7M87% on the field · 3rd in spend
Wide receivers$24.2M36% on the field · 18th in spend
Tight ends$10.8M79% on the field · 21st in spend
Offensive line$18.2M73% on the field · 32nd in spend
Defensive line$39.4M77% on the field · 27th in spend
Linebackers$8.6M73% on the field · 29th in spend
Secondary$55.0M90% on the field · 5th in spend
Specialists$6.5M100% on the field · 10th in spend
Best value on the roster
Earning more than they cost
↳Bottom lineBest value on the roster: DJ Giddens, played 81st and paid 35th among RBs.
?How to read the contract tables
- One row = one contract.
- 2026 cap hit, average per year and years left.
- Paid / played bars:
- the gold bar is where his pay ranks among players at his position across the league, the green bar where his play ranks (EPA, expected points added, for QB, RB, WR, TE; share of snaps for everyone else). Full bar = top of the league.
- Gap:
- played rank minus paid rank, in percentile points. Positive (green) means he gives more than he costs; negative (red) means the opposite.
2 contracts
Quarterbacks $11.9M
Player2026 capPer yearPaid / playedGapEPA
 Anthony Richardson Sr.QB$10.8M$8.5M · 1 yr left−20-4.9 EPA
 Riley LeonardQB$1.1M$1.1M · 3 yrs left−25+0.0 EPA
4 contracts
Running backs $18.7M
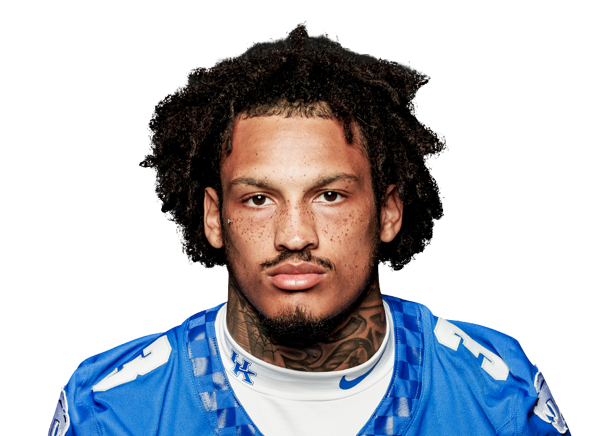

10 contracts
Wide receivers $24.2M
Player2026 capPer yearPaid / playedGapEPA
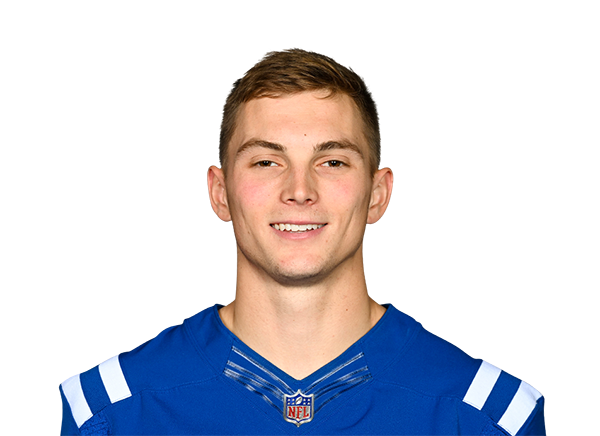 Alec PierceWR · injured$9.2M$28.5M · 4 yrs left−26+2.6 EPA
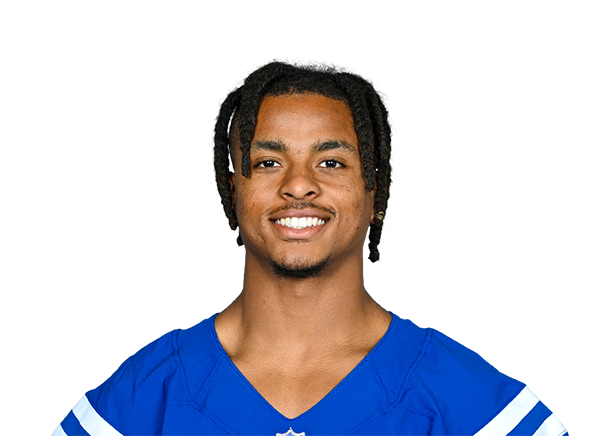 Josh DownsWR$4.2M$1.4M · 1 yr left+11+15.9 EPA
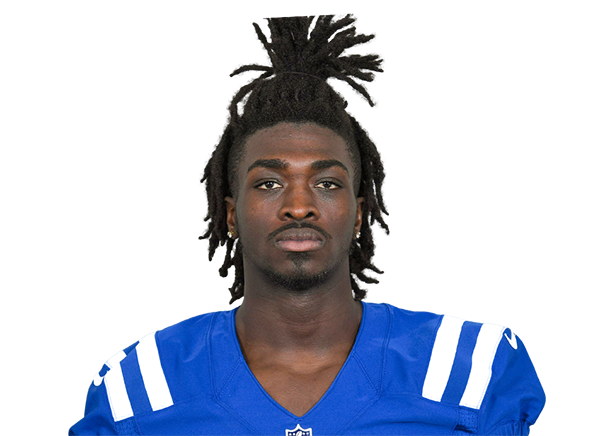 Ashton DulinWR$3.6M$3.3M · 1 yr left−30-2.3 EPA
 Keenan AllenWR$3.3M$3.3M · 1 yr left+5+7.0 EPA
 Laquon TreadwellWR$1.3M$1.5M · 1 yr left+12+1.0 EPA
 Deion BurksWR$1.1M$1.1M · 4 yrs left+23+2.4 EPA
 D.J. MontgomeryWR · injured$565K$1.1M · 1 yr left−27+0.0 EPA
 Nick Westbrook-IkhineWR$522K$411K · 1 yr left+24-0.5 EPA
 Quez WatkinsWR$257K$330K · 1 yr left−21+0.0 EPA
 Mecole Hardman Jr.WR$220K$330K · 1 yr left−5+0.0 EPA
5 contracts
Tight ends $10.8M

12 contracts
Offensive line $18.2M
Player2026 capPer yearPaid / playedGapSnaps
 Bernhard RaimannLT$9.3M$25.0M · 3 yrs left−1097% snaps
 Matt GoncalvesLT$1.6M$1.5M · 2 yrs left+2699% snaps
 Jalen FarmerRG$1.4M$1.4M · 4 yrs left+221% snaps
 Tanor BortoliniC$1.3M$1.2M · 2 yrs left+3499% snaps
 Jalen TravisLT$1.2M$1.3M · 3 yrs left+3393% snaps
 Dalton TuckerRG$1.1M$957K · 1 yr left+31% snaps
 Sedrick Van Pran-GrangerC$1.1M$1.1M · 2 yrs left+61% snaps
 Charlie HeckRT$657K$1.2M · 1 yr left−190% snaps
 Reid HolskeyRT$248K$248K · 1 yr left−40% snaps
 Nolan RucciLT$248K$248K · 1 yr left−40% snaps
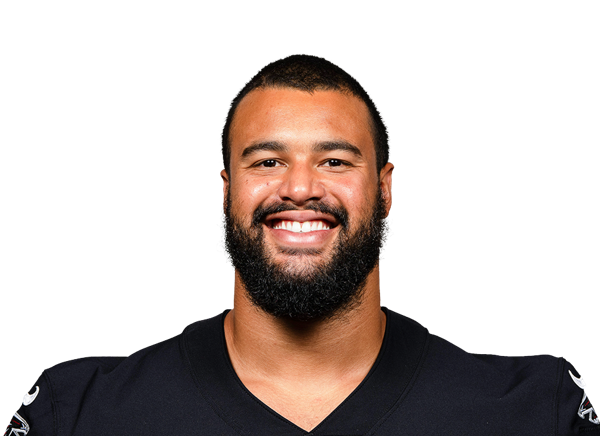 Joshua GrayLG$151K$248K · 1 yr left−20% snaps
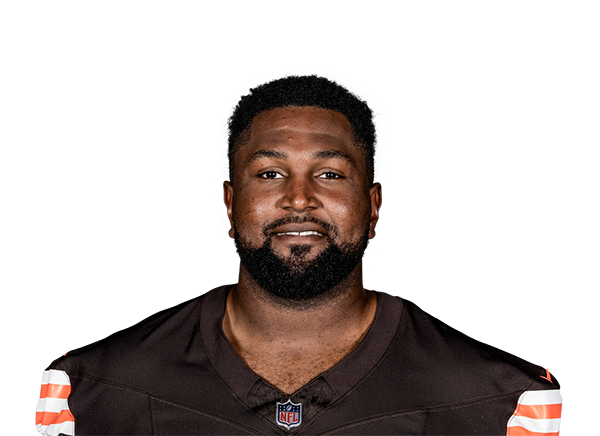 Roy MbaetekaRT$0K$248K · 1 yr left00% snaps
13 contracts
Defensive line $39.4M
Player2026 capPer yearPaid / playedGapSnaps
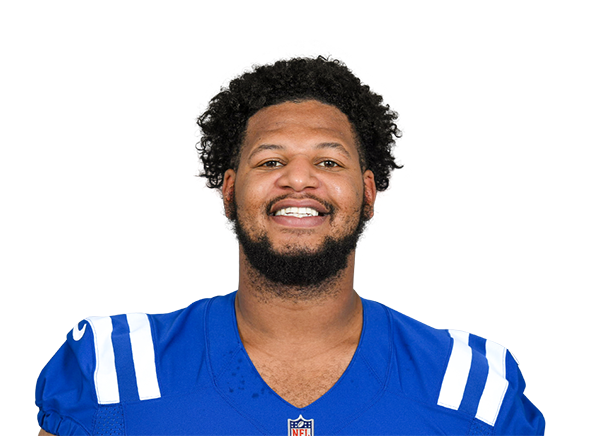 Grover StewartIDL$14.3M$13.0M · 1 yr left−1160% snaps
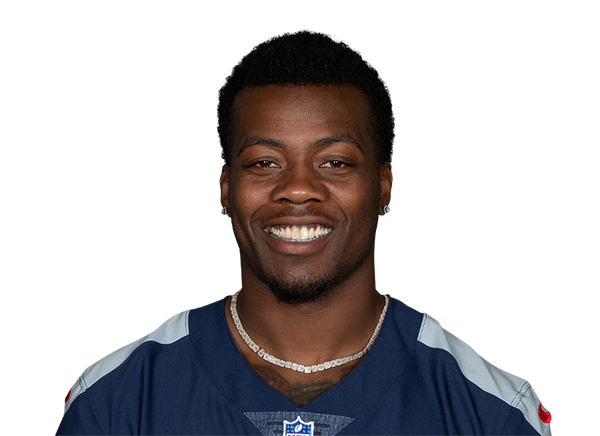 Arden KeyED · injured$6.8M$8.0M · 2 yrs left−2830% snaps
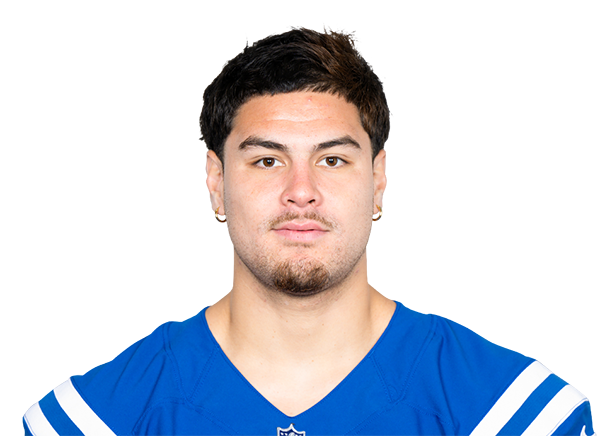 Laiatu LatuED$4.6M$4.3M · 2 yrs left+2277% snaps
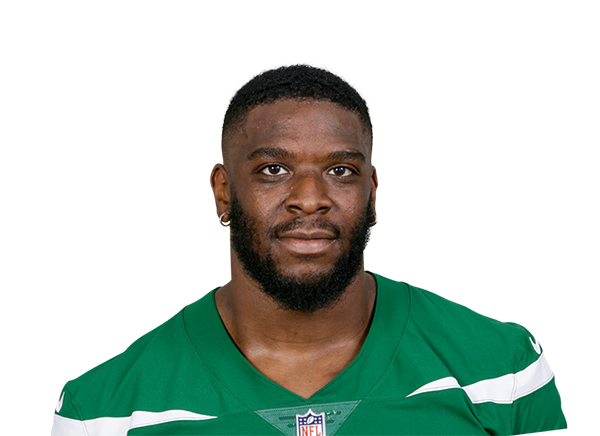 Micheal ClemonsED · injured$4.5M$5.7M · 3 yrs left−417% snaps
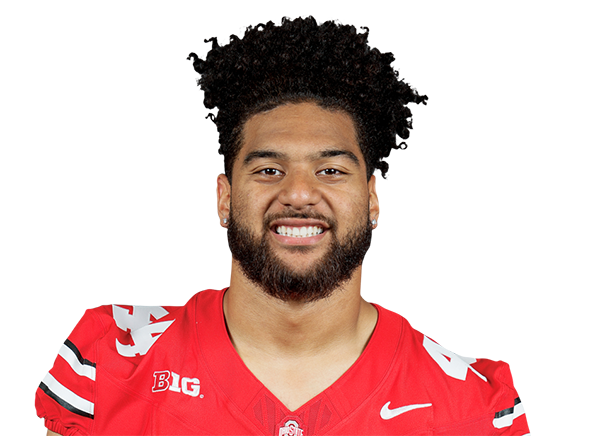 Jaylahn TuimoloauED$2.3M$2.5M · 3 yrs left+2963% snaps
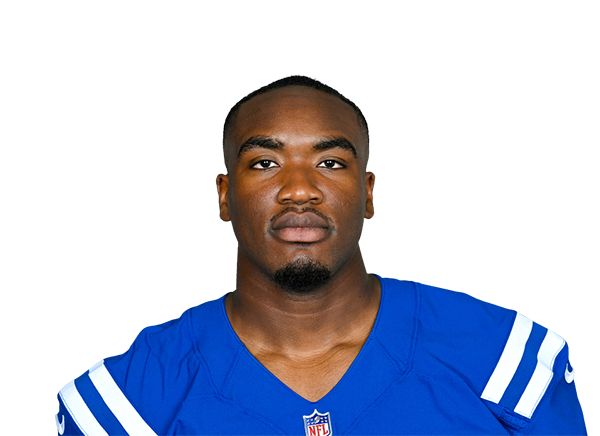 Adetomiwa AdebaworeED$1.3M$17.5M · 2 yrs left+2747% snaps
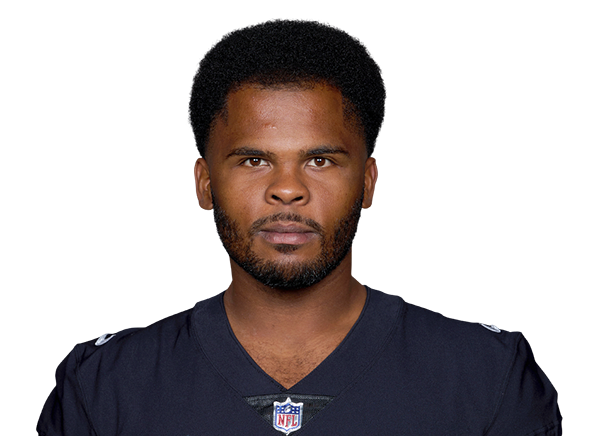 Jerry TilleryIDL$1.3M$1.5M · 1 yr left+1636% snaps
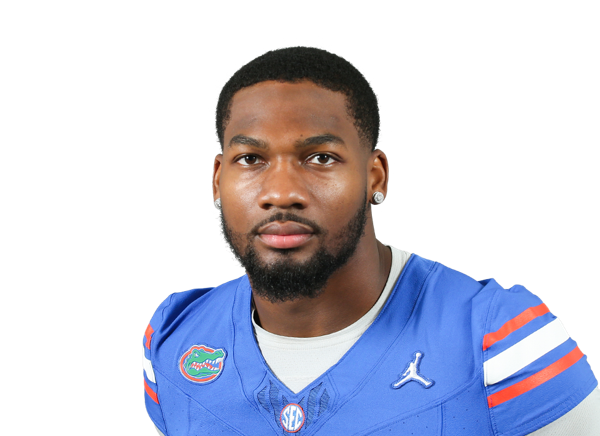 George Gumbs Jr.ED$1.2M$1.2M · 4 yrs left−69% snaps
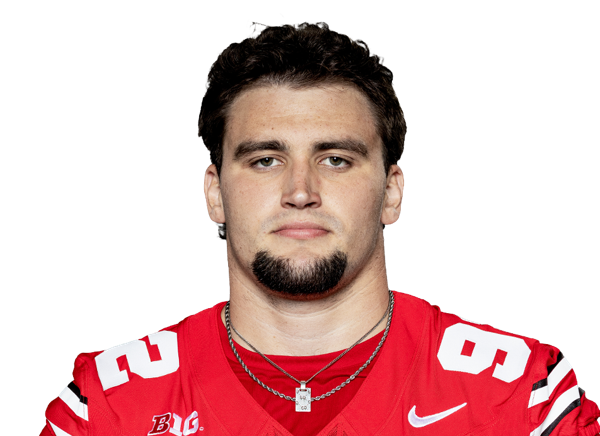 Caden CurryED$1.1M$1.1M · 4 yrs left+619% snaps
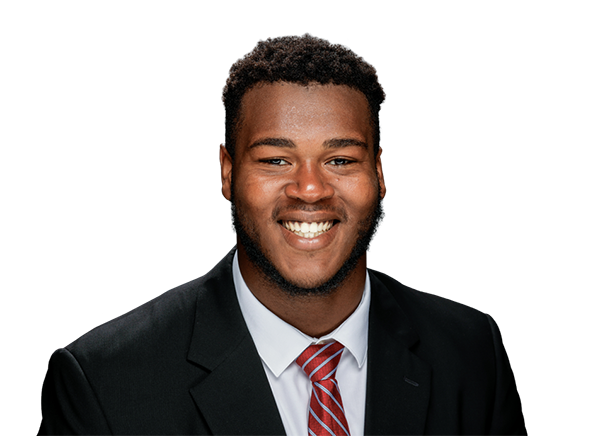 Tim SmithIDL$885K$885K · 1 yr left+2017% snaps
 Kevin GivensIDL$657K$1.2M · 1 yr left+126% snaps
 Cameron BallIDL$248K$248K · 1 yr left−60% snaps
 Mitchell MeltonED$248K$248K · 1 yr left−60% snaps
6 contracts
Linebackers $8.6M
Player2026 capPer yearPaid / playedGapSnaps
 Akeem Davis-GaitherLB$2.7M$2.7M · 1 yr left+1079% snaps
 CJ AllenLB$2.3M$2.3M · 4 yrs left−531% snaps
 Bryce BoettcherLB$1.3M$1.3M · 4 yrs left+930% snaps
 Tahj ChambersLB$1.0M$1.0M · 3 yrs left−280% snaps
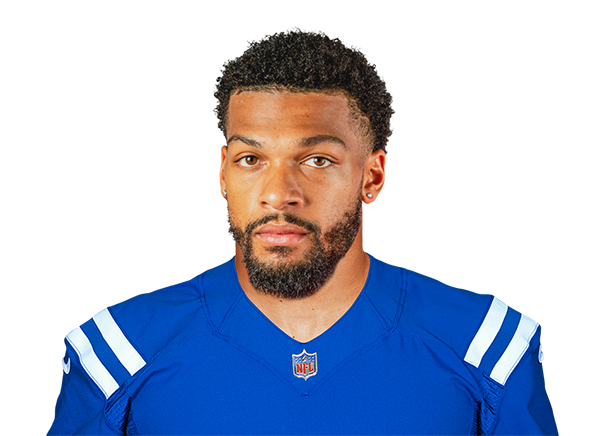 Austin AjiakeLB$1.0M$1.0M · 1 yr left+3319% snaps
 West WeeksLB$248K$248K · 1 yr left−10% snaps
15 contracts
Secondary $55.0M
Player2026 capPer yearPaid / playedGapSnaps
 Charvarius WardCB$19.9M$18.0M · 2 yrs left−1290% snaps
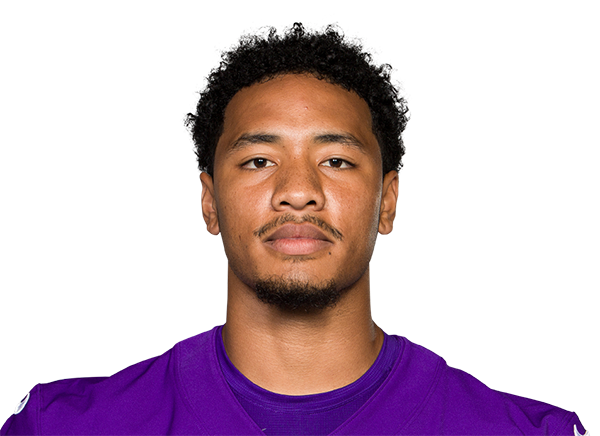 Cam BynumS$15.0M$15.0M · 3 yrs left+1100% snaps
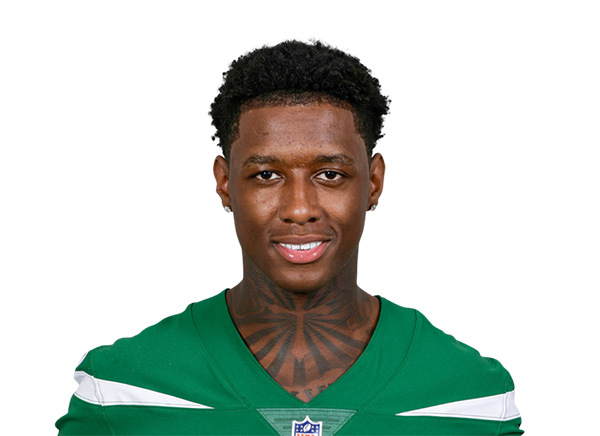 Sauce GardnerCB$9.5M$30.1M · 3 yrs left−983% snaps
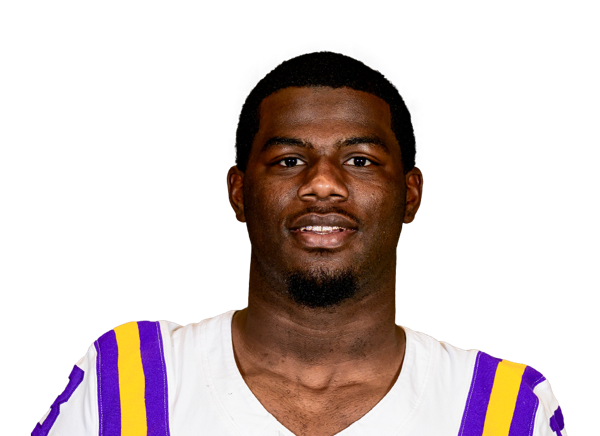 A.J. HaulcyS$1.8M$1.8M · 4 yrs left+1671% snaps
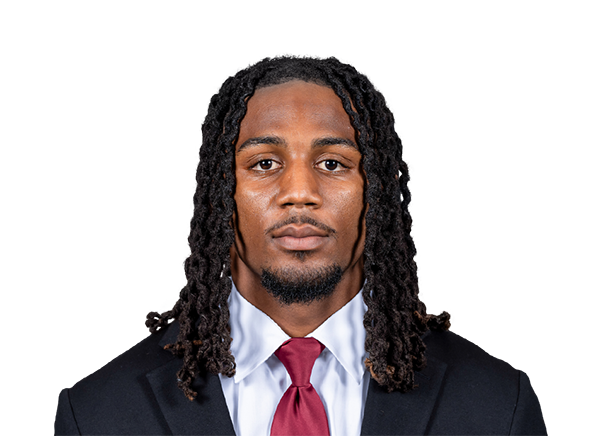 Justin WalleyCB$1.5M$1.6M · 3 yrs left+1455% snaps
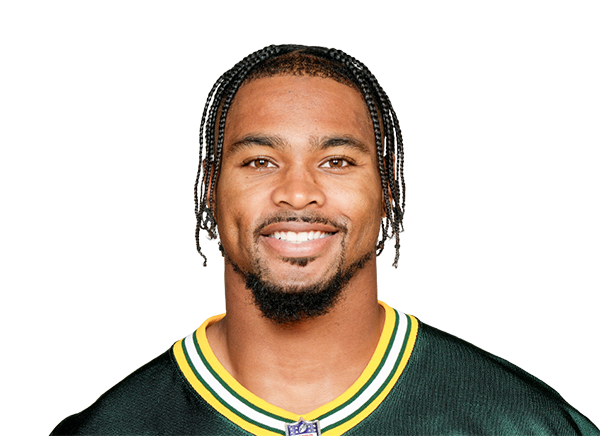 Jonathan OwensS$1.3M$1.4M · 1 yr left−142% snaps
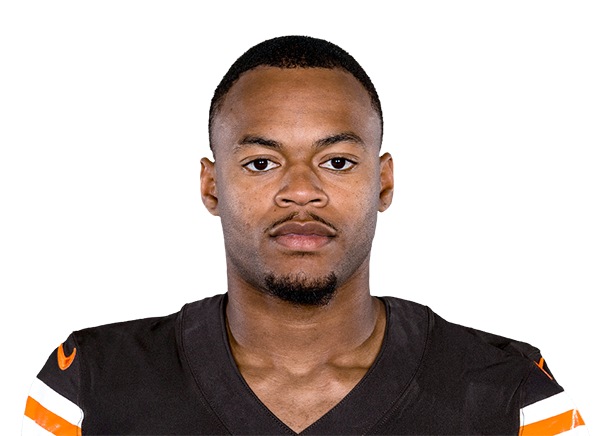 Cameron MitchellCB · injured$1.2M$1.2M · 1 yr left−410% snaps
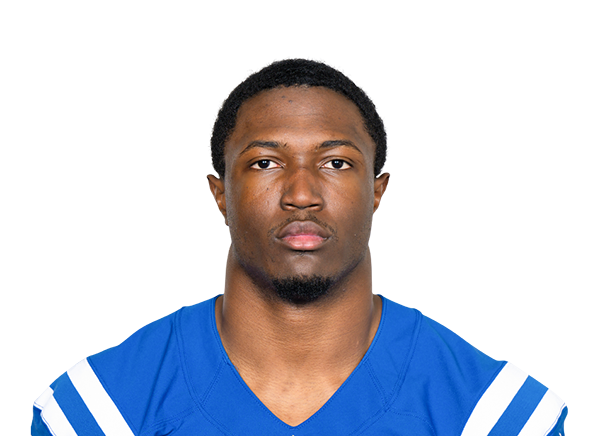 Jaylon CarliesS$1.2M$1.1M · 2 yrs left+2339% snaps
 Kapena GushikenS$1.0M$1.0M · 3 yrs left+1411% snaps
 Hunter WohlerS$918K$1.1M · 3 yrs left+3229% snaps
 Cam Taylor-BrittCB · injured$896K$1.4M · 1 yr left+2416% snaps
 Johnathan EdwardsCB$276K$248K · 1 yr left+151% snaps
 Daniel ScottS$248K$248K · 1 yr left−50% snaps
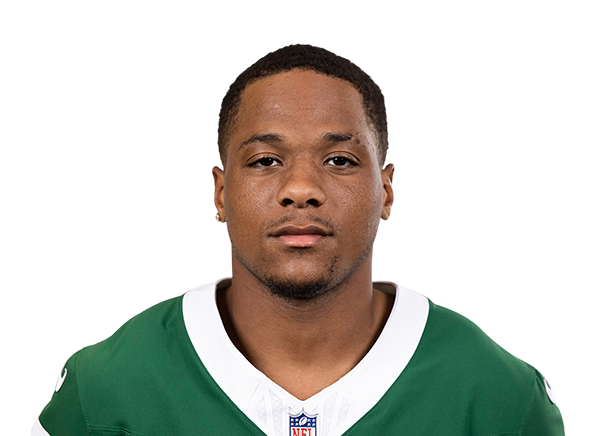 Shemar BartholomewCB$151K$248K · 1 yr left00% snaps
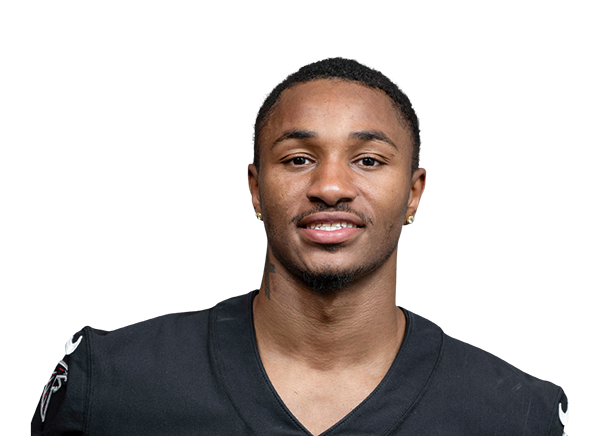 Natrone BrooksCB$151K$248K · 1 yr left00% snaps
3 contracts
Specialists $6.5M
Player2026 capPer yearPaid / playedGapSnaps
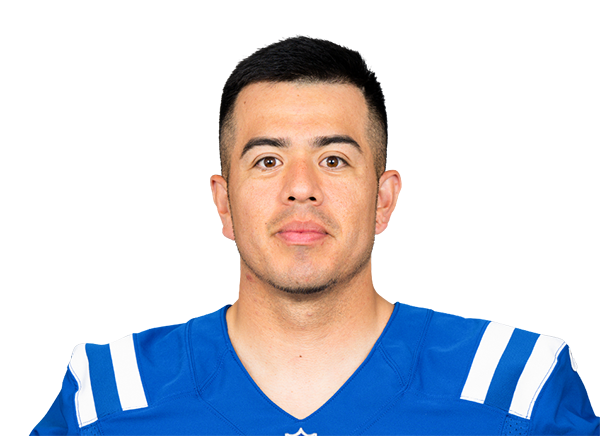 Rigoberto SanchezP$3.5M$3.5M · 2 yrs left+616% snaps
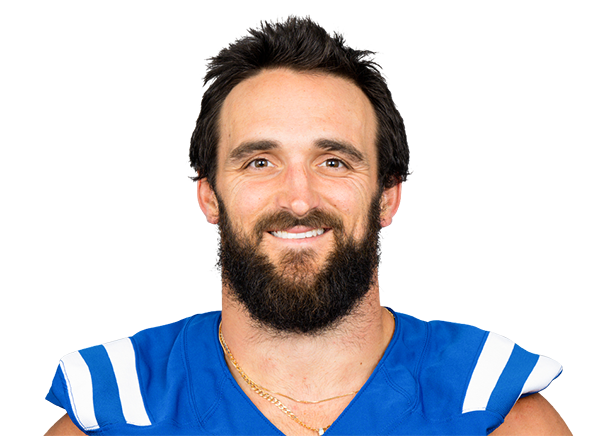 Luke RhodesLS$1.6M$1.6M · 1 yr left−2613% snaps
 Spencer ShraderK$1.4M$1.3M · 1 yr left−3511% snaps
Gold bar: where the player's pay ranks among his position group league-wide. Green bar: where his play ranks (EPA for skill players, share of snaps for everyone else). Gap = played minus paid, in percentile points.