 ESPNFantasy buzz: James Cook III helps Bills overcome tough Vikings defense
 ESPNSeven things Solak thinks for NFL Week 10: Jaguars trades, All-Pro picks, more
 Pittsburgh SteelersAsked and Answered: Nov. 10
 ESPNCommanders running low on time to 'put it all together'
 New York GiantsGiants Now: Michael Strahan offers high praise of Arvell Reese
 Philadelphia EaglesAAA Official Review: What did the Eagles, Joe Milton learn from the QB's first start?
 ESPNVikings left at QB crossroads after Carson Wentz's poor MNF showing vs. Bills
 Broncos DeskBroncos are 7-2, but the snaps say 4.1 wins and the 11th seed in the conference6 h ago
 Pro Football RumorsSeahawks Interested In Adding WR Depth
 InjuryCarl Granderson: Active → Cleared8 h ago
The LabEvery contract against the field
 Detroit LionsThe cap file
65 contracts count $236M against the 2026 cap. 82% of it belongs to players on the field, 13th of 32. $18.2M is injured and $24.6M is healthy but not playing. The biggest building: defensive line, $54.2M, 16th in the league.
↳Bottom line82% of the Lions cap is on the field (13th of 32). The most money goes to defensive line: $54.2M, 16th in the league.
?How to read this chart
- The skyline above:
- one building per position group, as tall as the cap hit (this season's salary-cap charge) Lions spend on it, on the same scale as every other team. Lit windows are the share of that money on players who are actually on the field; dark windows are injured or idle money.
- The cards below:
- the same money in numbers. The bar fills with the share on the field, and "in spend" ranks the team among all 32 for that group.
Quarterbacks$38.8M97% on the field · 9th in spend
Running backs$12.9M76% on the field · 12th in spend
Wide receivers$24.8M89% on the field · 17th in spend
Tight ends$7.2M93% on the field · 30th in spend
Offensive line$28.1M62% on the field · 29th in spend
Defensive line$54.2M94% on the field · 16th in spend
Linebackers$20.6M84% on the field · 9th in spend
Secondary$47.2M61% on the field · 12th in spend
Specialists$2.2M100% on the field · 31st in spend
Best value on the roster
Earning more than they cost
↳Bottom lineBest value on the roster: Chuck Clark, played 85th and paid 44th among DBs.
?How to read the contract tables
- One row = one contract.
- 2026 cap hit, average per year and years left.
- Paid / played bars:
- the gold bar is where his pay ranks among players at his position across the league, the green bar where his play ranks (EPA, expected points added, for QB, RB, WR, TE; share of snaps for everyone else). Full bar = top of the league.
- Gap:
- played rank minus paid rank, in percentile points. Positive (green) means he gives more than he costs; negative (red) means the opposite.
2 contracts
Quarterbacks $38.8M
Player2026 capPer yearPaid / playedGapEPA
 Jared GoffQB$37.6M$53.0M · 2 yrs left−2+46.6 EPA
 Joshua DobbsQB$1.2M$1.4M · 1 yr left−35+0.0 EPA
5 contracts
Running backs $12.9M
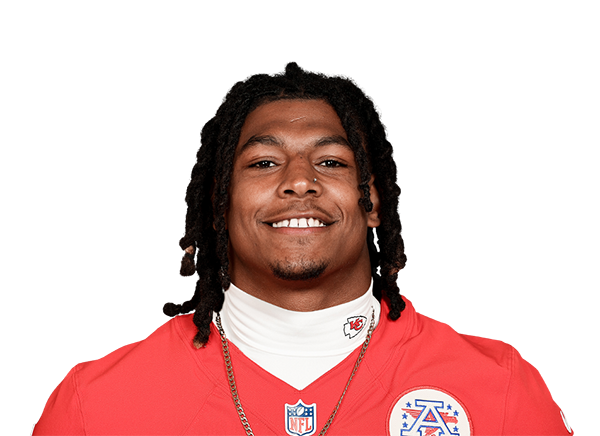
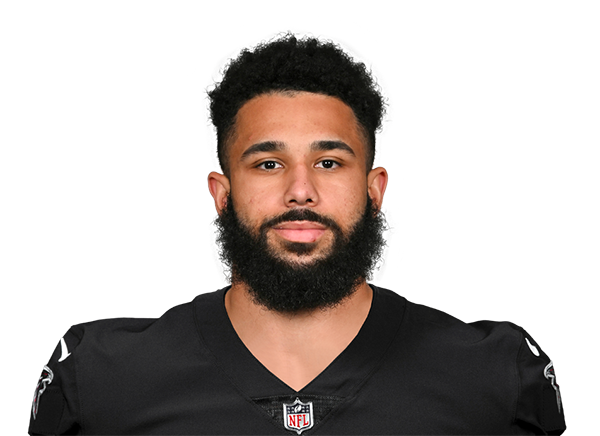
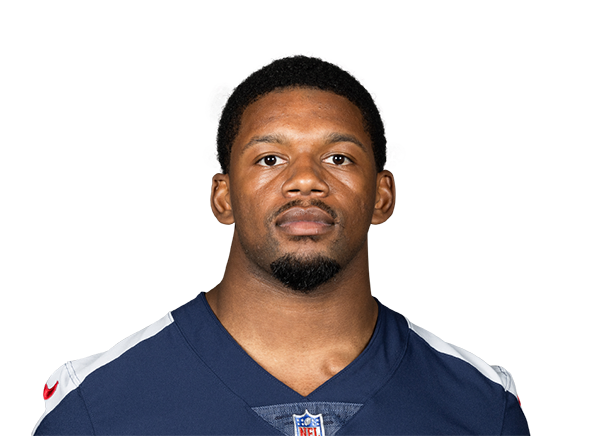
7 contracts
Wide receivers $24.8M
Player2026 capPer yearPaid / playedGapEPA
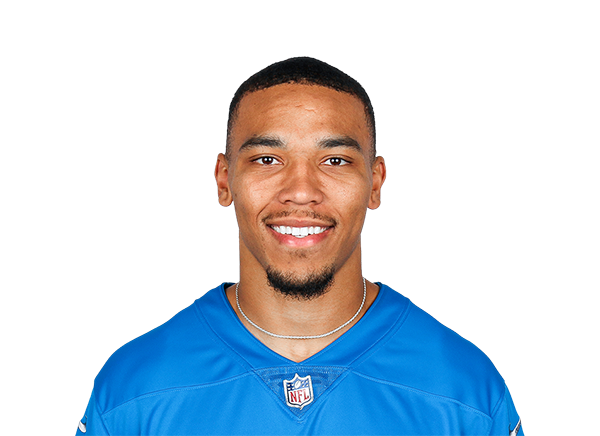 Amon-Ra St. BrownWR$12.3M$30.0M · 2 yrs left+1+25.3 EPA
 Jameson WilliamsWR$8.3M$26.7M · 2 yrs left+6+24.3 EPA
 Isaac TeSlaaWR$1.5M$1.7M · 3 yrs left+25+9.1 EPA
 Kendrick LawWR · injured$1.2M$1.2M · 4 yrs left−45+0.0 EPA
 Tay MartinWR$1.0M$1.0M · 1 yr left+35+3.1 EPA
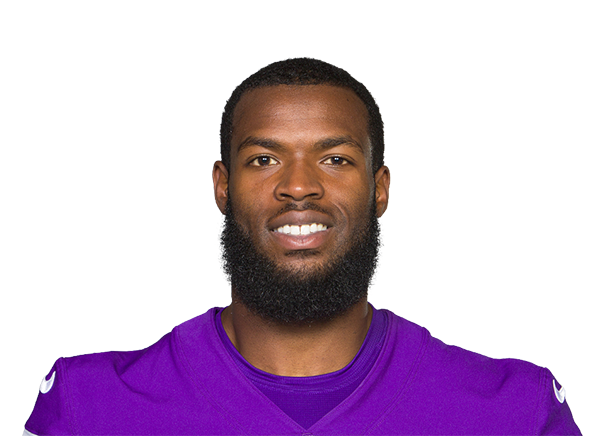 Lucky JacksonWR$248K$248K · 1 yr left−7+0.0 EPA
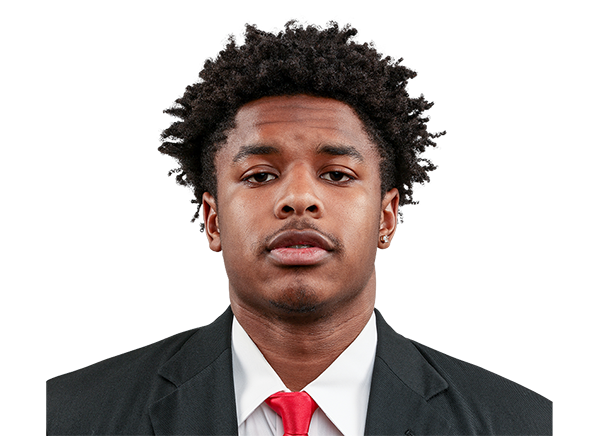 Dominic LovettWR$248K$248K · 1 yr left−7+0.0 EPA
3 contracts
Tight ends $7.2M
Player2026 capPer yearPaid / playedGapEPA
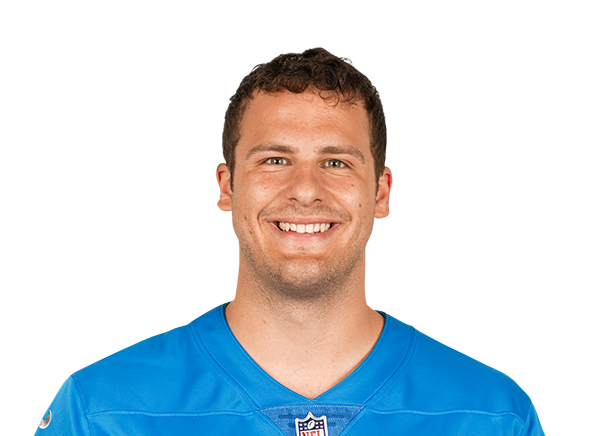 Sam LaPortaTE$6.7M$2.4M · 1 yr left+11+33.4 EPA
 Thomas GordonTE$248K$248K · 1 yr left−4+0.0 EPA
 Miles KitselmanTE$248K$248K · 1 yr left−4+0.0 EPA
11 contracts
Offensive line $28.1M
Player2026 capPer yearPaid / playedGapSnaps
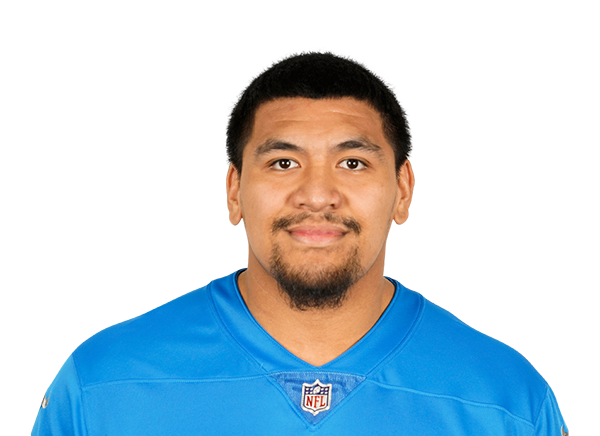 Penei SewellRT$13.1M$28.0M · 2 yrs left−799% snaps
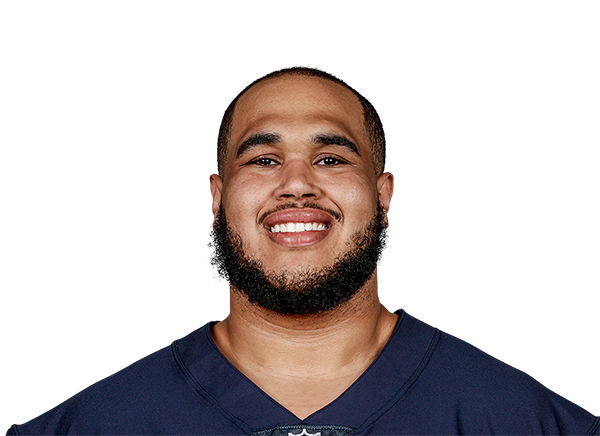 Larry BoromRT$5.0M$5.0M · 1 yr left−2621% snaps
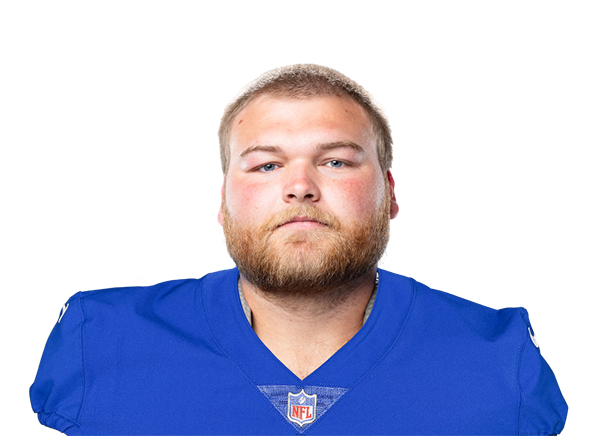 Cade MaysC · injured$2.8M$8.3M · 3 yrs left−1517% snaps
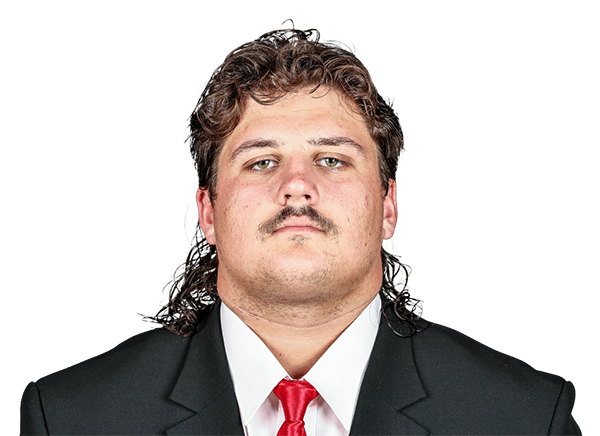 Tate RatledgeRG$1.7M$1.9M · 3 yrs left+2899% snaps
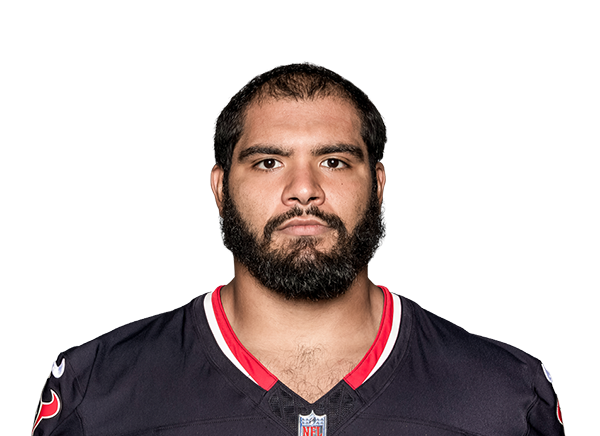 Juice ScruggsC$1.6M$1.5M · 1 yr left+1783% snaps
 Christian MahoganyRG$1.1M$1.0M · 2 yrs left+3165% snaps
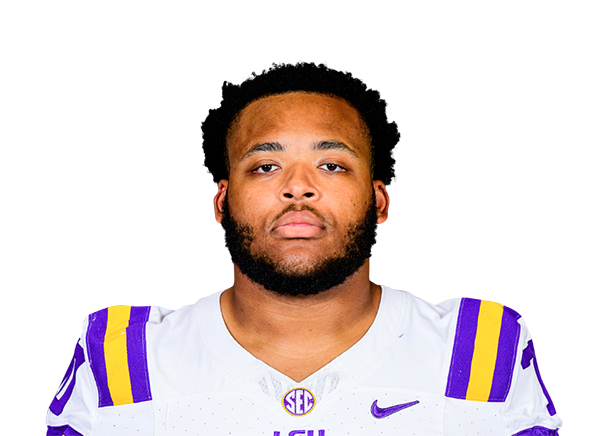 Miles FrazierRG$1.1M$1.1M · 3 yrs left+1311% snaps
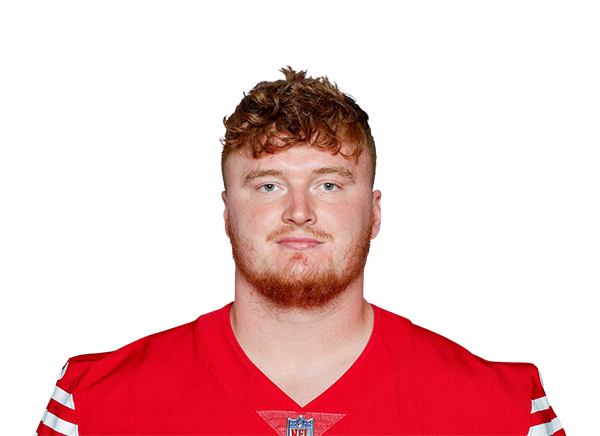 Ben BartchLT · injured$707K$1.2M · 1 yr left+3324% snaps
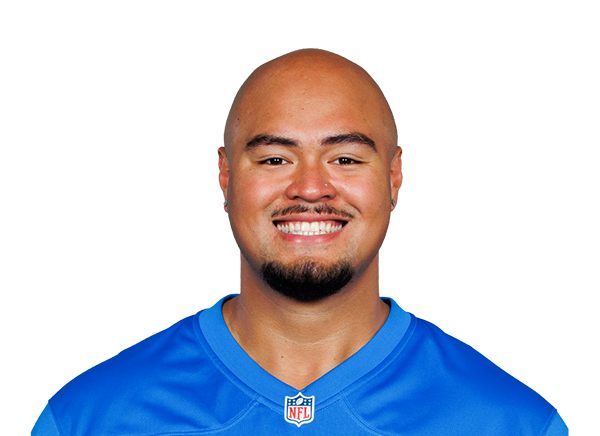 Giovanni ManuLT · injured$429K$1.2M · 2 yrs left−170% snaps
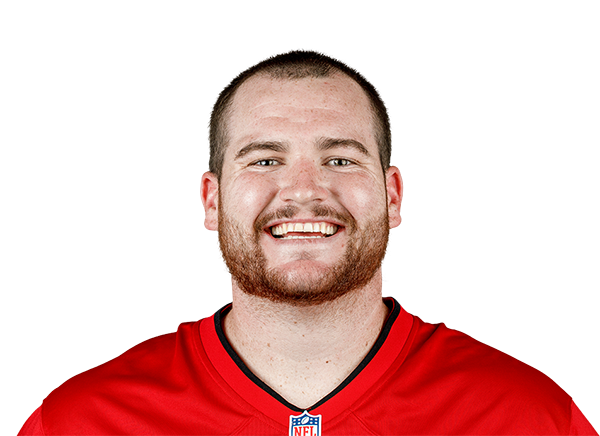 Elijah KleinLG$330K$330K · 1 yr left−150% snaps
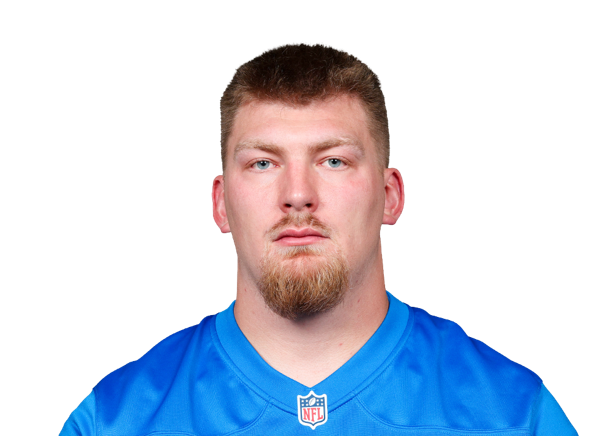 Mason MillerRT$248K$248K · 1 yr left−40% snaps
12 contracts
Defensive line $54.2M
Player2026 capPer yearPaid / playedGapSnaps
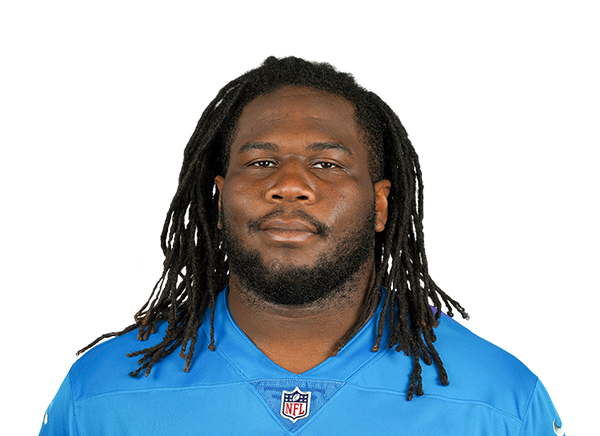 Alim McNeillIDL$29.0M$24.3M · 2 yrs left−281% snaps
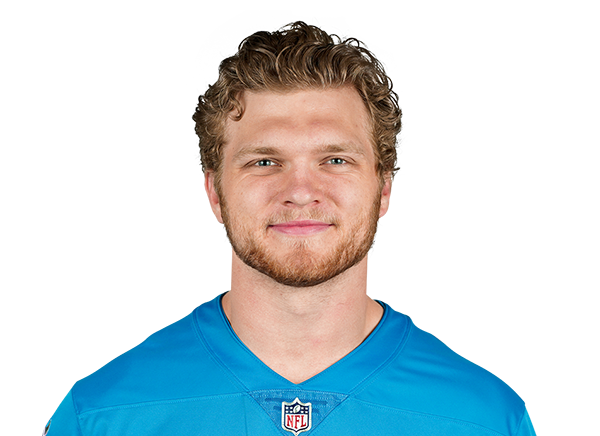 Aidan HutchinsonED$10.1M$45.0M · 3 yrs left+1190% snaps
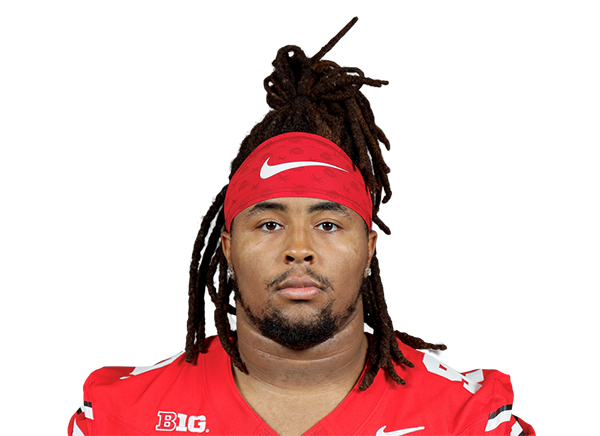 Tyleik WilliamsIDL$3.7M$4.1M · 3 yrs left+851% snaps
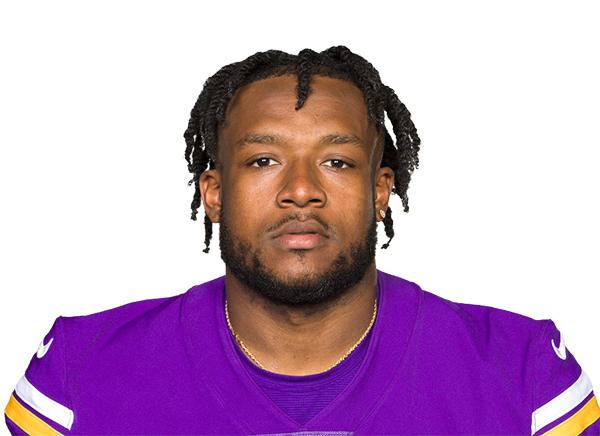 DJ WonnumED$3.0M$3.0M · 1 yr left+1250% snaps
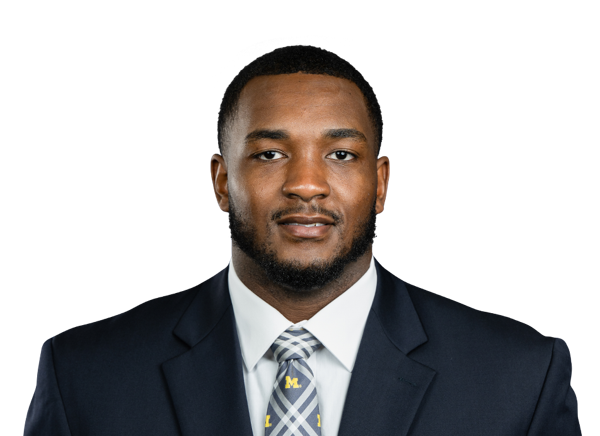 Derrick MooreED$2.9M$2.9M · 4 yrs left−1226% snaps
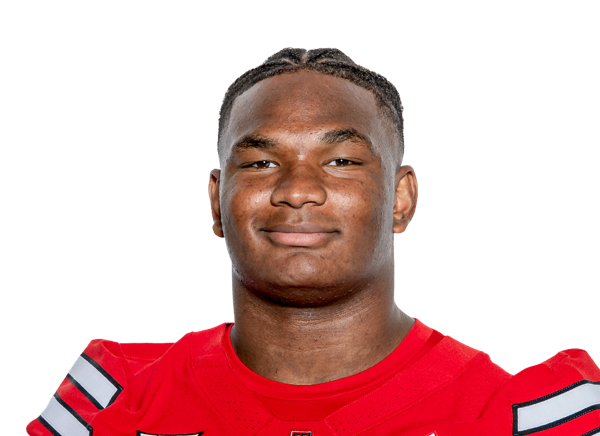 Skyler Gill-HowardIDL$1.2M$1.2M · 4 yrs left+3346% snaps
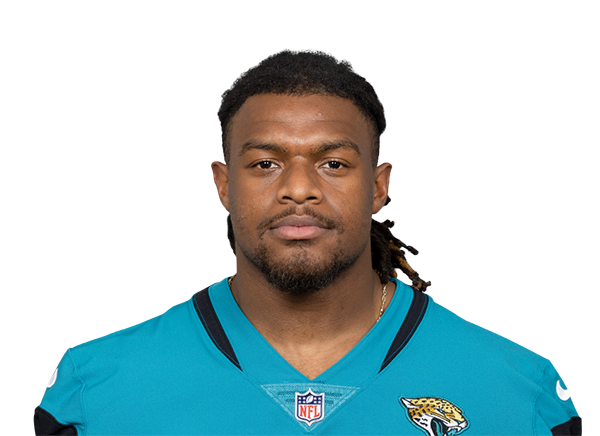 Tyler LacyIDL$1.1M$1.1M · 1 yr left+2235% snaps
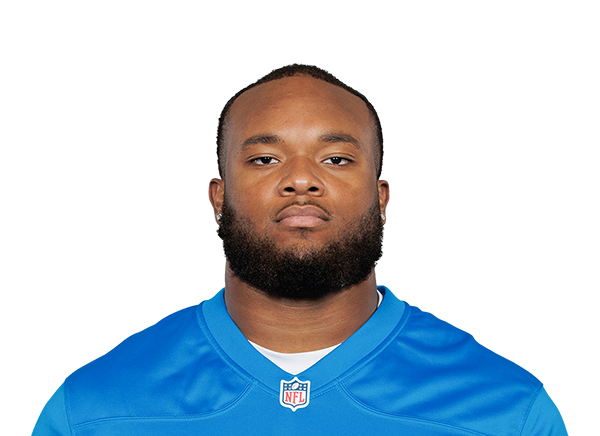 Mekhi WingoIDL$1.1M$1.1M · 2 yrs left−340% snaps
 Eric O'NeillED$1.0M$1.0M · 3 yrs left+33% snaps
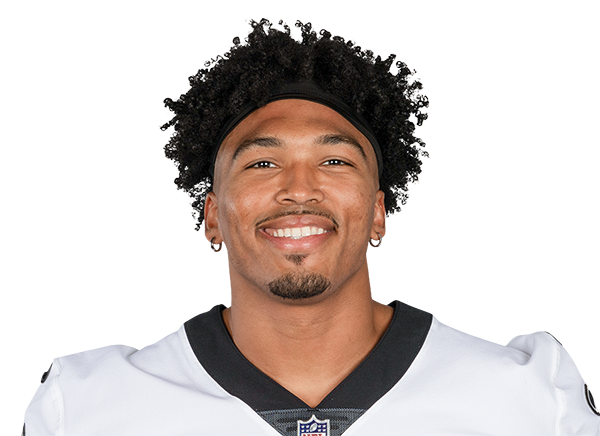 Payton TurnerED · injured$590K$1.1M · 1 yr left−180% snaps
 Aidan KeanaainaIDL$248K$248K · 1 yr left−60% snaps
 Jeffrey M'baIDL$248K$248K · 1 yr left−60% snaps
8 contracts
Linebackers $20.6M
Player2026 capPer yearPaid / playedGapSnaps
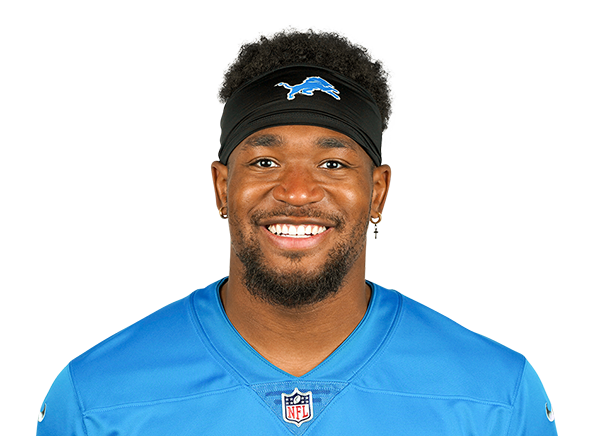 Derrick BarnesLB$9.8M$8.0M · 2 yrs left−1384% snaps
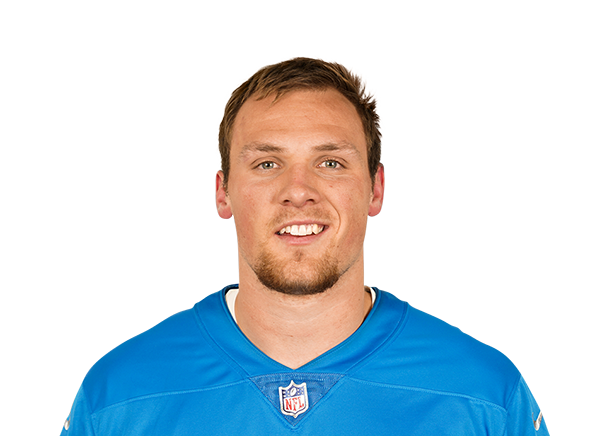 Jack CampbellLB · injured$4.8M$20.3M · 4 yrs left+288% snaps
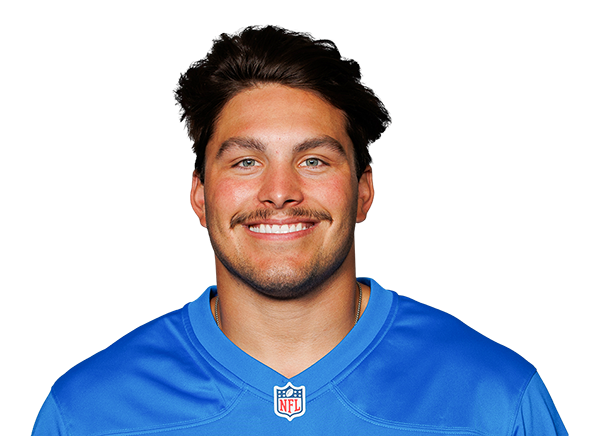 Malcolm RodriguezLB$1.4M$2.8M · 1 yr left+632% snaps
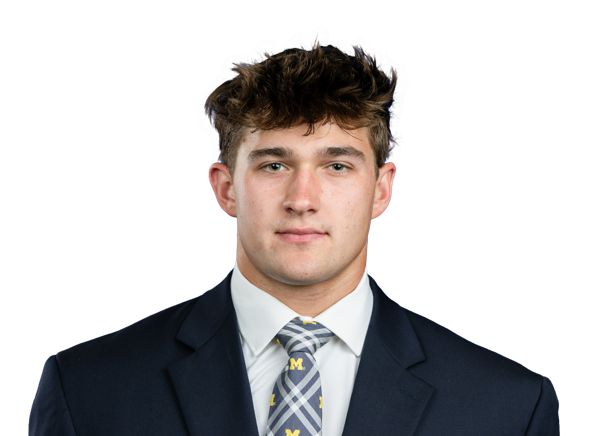 Jimmy RolderLB · injured$1.4M$1.4M · 4 yrs left−164% snaps
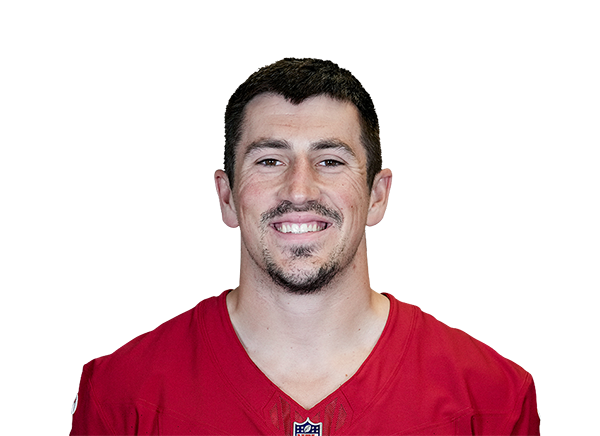 Trevor NowaskeLB$1.4M$1.4M · 1 yr left+629% snaps
 Damone ClarkLB · injured$753K$1.4M · 1 yr left−190% snaps
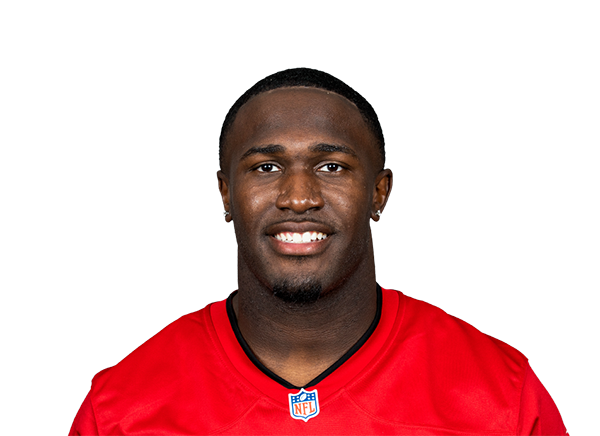 Devin WhiteLB · injured$707K$1.3M · 1 yr left+3412% snaps
 K.J. BrittLB$448K$1.2M · 1 yr left−130% snaps
15 contracts
Secondary $47.2M
Player2026 capPer yearPaid / playedGapSnaps
 D.J. ReedCB$17.9M$16.0M · 2 yrs left−1485% snaps
 Brian BranchS$6.5M$2.0M · 1 yr left−3823% snaps
 Kerby JosephS · injured$5.5M$21.3M · 3 yrs left−830% snaps
 Rock Ya-SinCB$3.2M$3.2M · 1 yr left−945% snaps
 Andre CiscoS$2.2M$2.5M · 1 yr left−1232% snaps
 Christian IzienS$2.0M$2.0M · 1 yr left−931% snaps
 Ennis Rakestraw Jr.CB$1.8M$1.6M · 2 yrs left−1224% snaps
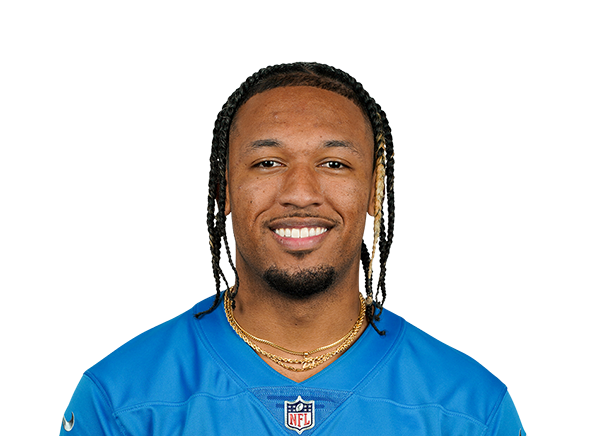 Khalil DorseyCB$1.7M$1.6M · 1 yr left−1910% snaps
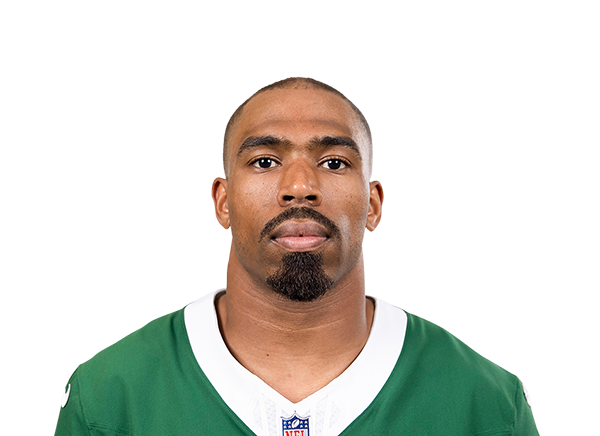 Chuck ClarkS$1.3M$1.5M · 1 yr left+4187% snaps
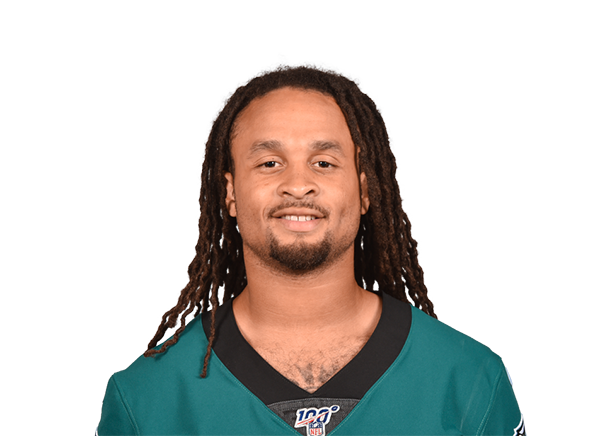 Avonte MaddoxCB · injured$1.3M$1.5M · 1 yr left+220% snaps
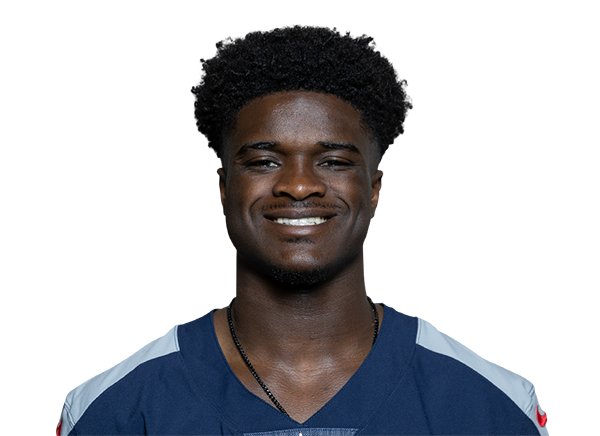 Roger McCrearyCB$1.3M$1.4M · 1 yr left+3578% snaps
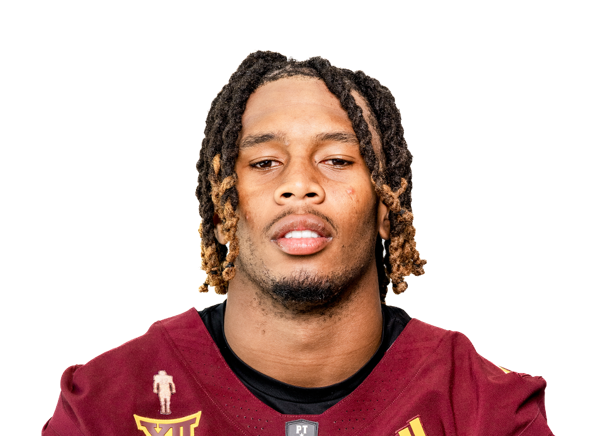 Keith Abney IICB$1.2M$1.2M · 4 yrs left+1027% snaps
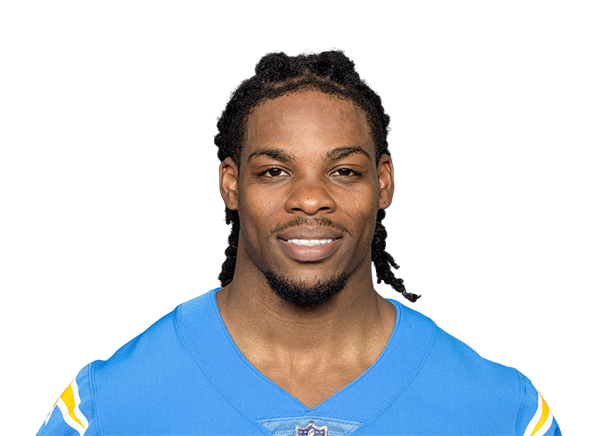 Thomas HarperCB · injured$1.1M$947K · 1 yr left+1616% snaps
 Aamaris BrownCB$248K$248K · 1 yr left−50% snaps
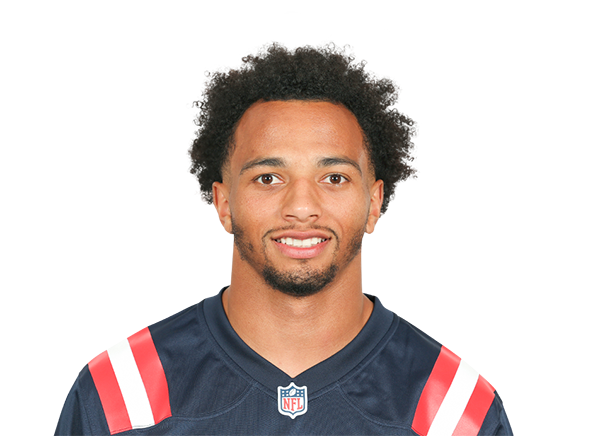 Myles BryantCB$220K$330K · 1 yr left−40% snaps
2 contracts
Specialists $2.2M
Player2026 capPer yearPaid / playedGapSnaps
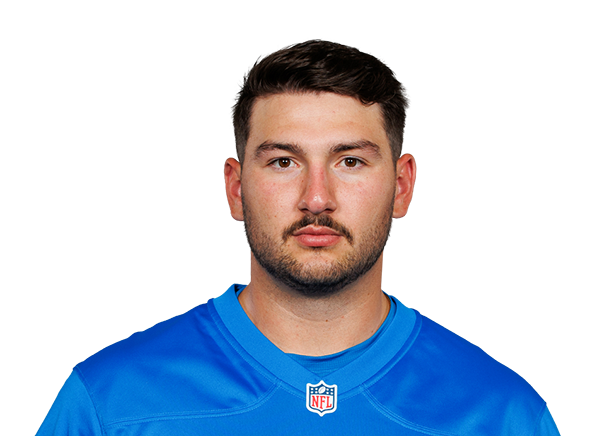 Hogan HattenLS$1.1M$944K · 1 yr left+413% snaps
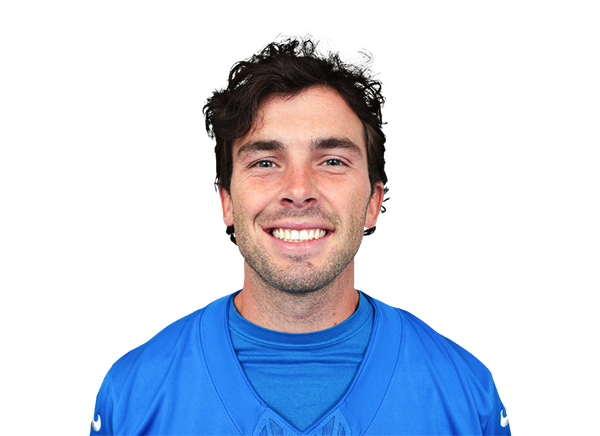 Jake BatesK$1.1M$1.1M · 1 yr left+6516% snaps
Gold bar: where the player's pay ranks among his position group league-wide. Green bar: where his play ranks (EPA for skill players, share of snaps for everyone else). Gap = played minus paid, in percentile points.