Green Bay PackersMike's Mid-Week Chat | Nov. 11, 2026
 Titans DeskTitans offense ranks 27th in EPA per play and the defense gives it back17 min ago
 New York Jets5 Jets Earn Honors in The Athletic's Midseason All-Rookie Team
 Pro Football RumorsColts Turned Down Pair Of Day 3 Picks For DT Grover Stewart
 Ravens DeskDerrick Henry's carries have gone negative as the Ravens' offense stalls27 min ago
 Jaguars DeskJaguars defense covers for an offense that slipped to 0.05 EPA a play37 min ago
 49ers Desk49ers lean on McCaffrey's short targets as the early-down pass rate drops to 41%47 min ago
 InjuryLucas Patrick: Doubtful → Out51 min ago
 Minnesota VikingsHow to Watch, Listen to & Stream Vikings at Packers in 2026 Week 10 Game
 ESPNBrowns' Monken: Watson over Sanders QB decision based on 'full body of work'
 New Orleans SaintsGame Preview: Panthers vs. Saints | 2026 NFL Week 10
 Texans DeskTexans offense posts its best EPA per play of the year in Week 91 h ago
 Rams DeskRams pass on 58% of early downs again after a 41% week, and Puka Nacua feeds on it1 h ago
 Panthers DeskCarolina's offense rebounds in Week 9 after two negative-EPA games1 h ago
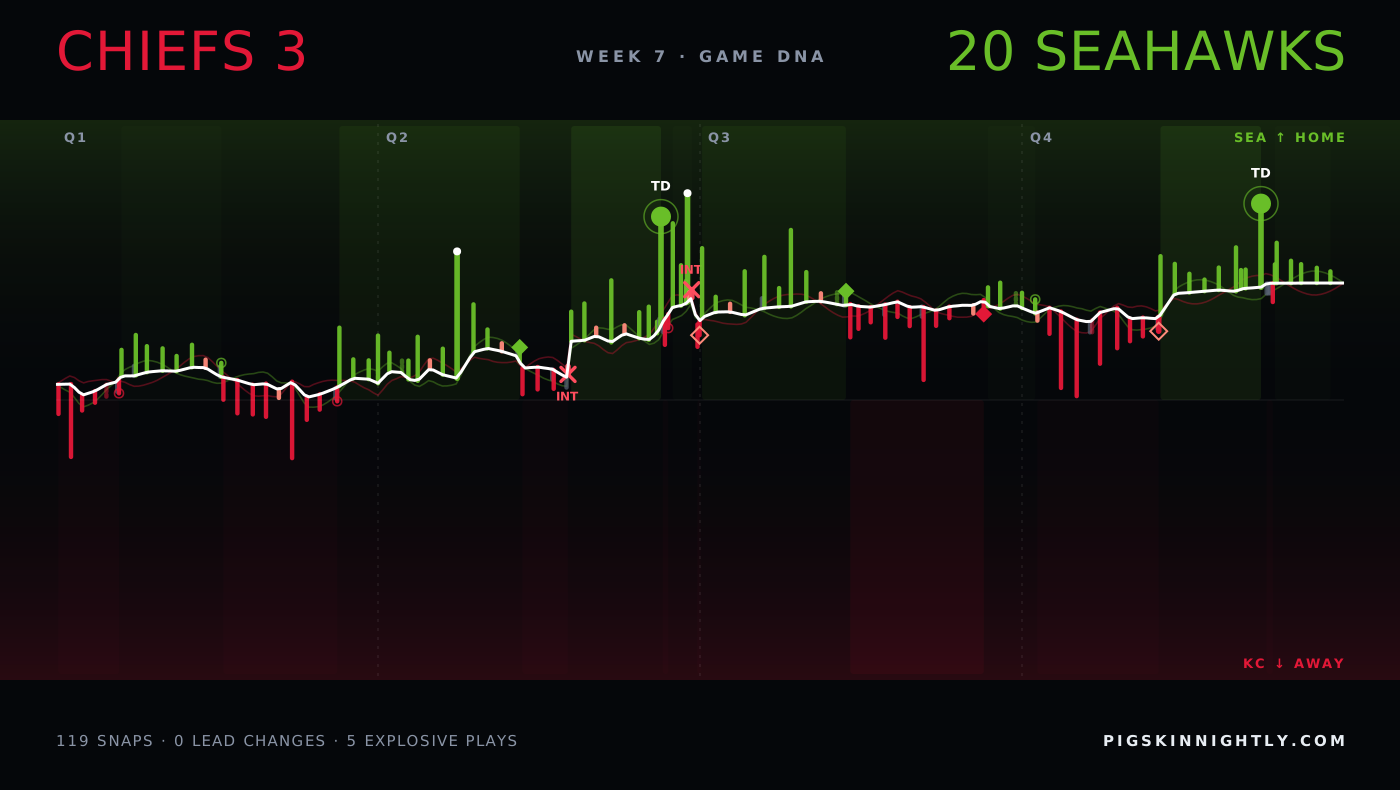
Week 7 · 2026Chiefs 3 · 20 Seahawks
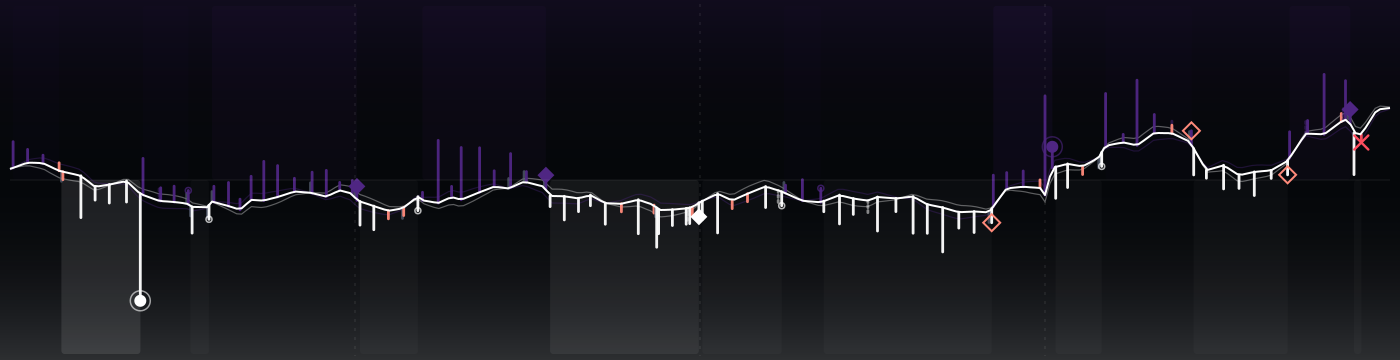
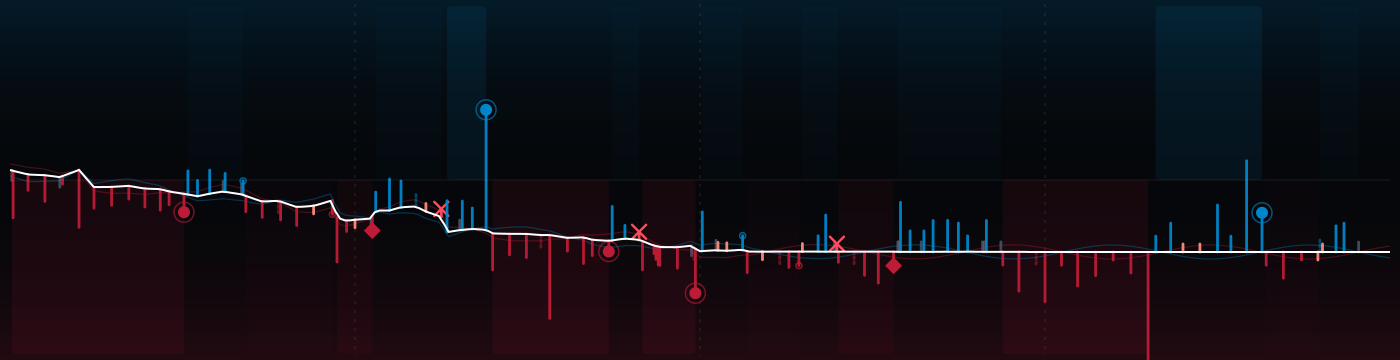
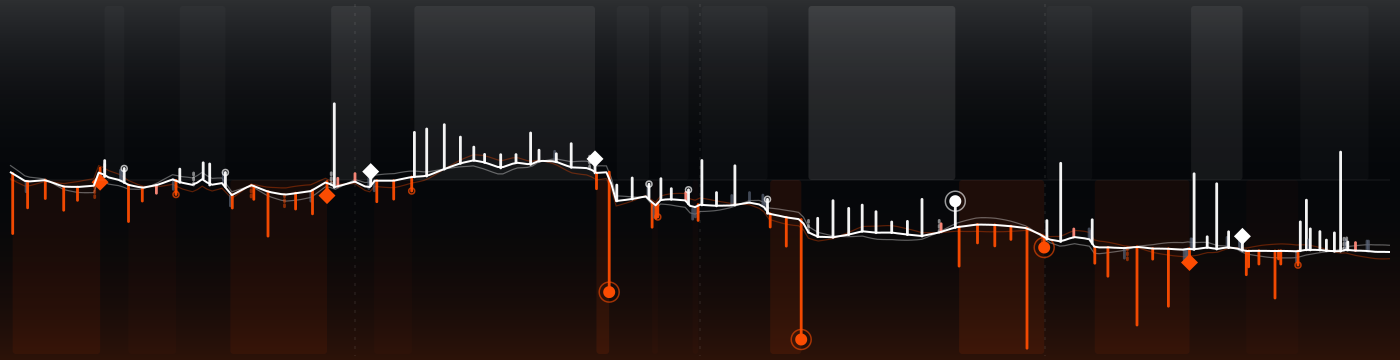
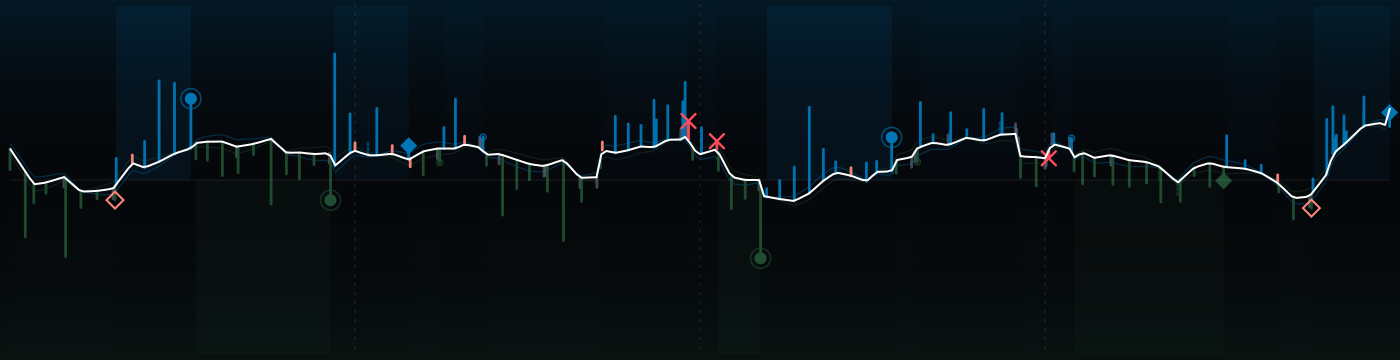
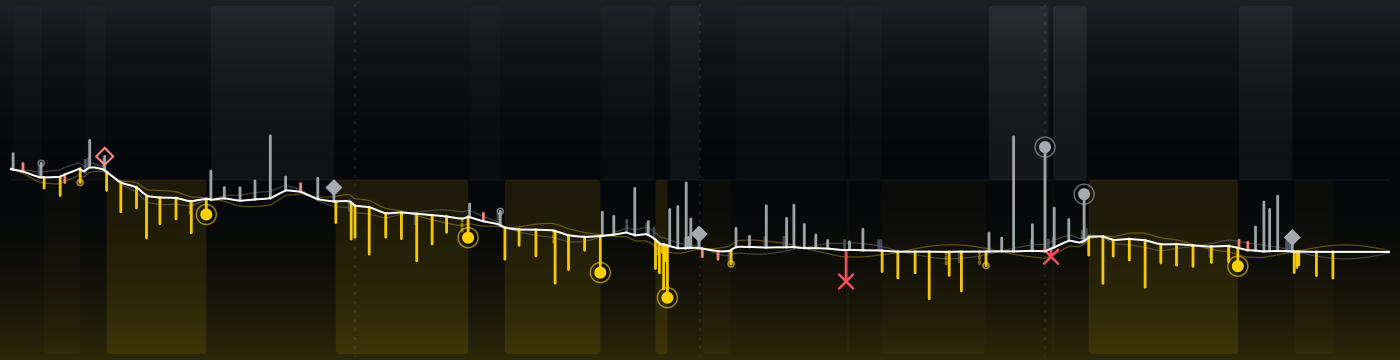
135 plays, one strand. Seahawks won without the lead ever changing hands; Chiefs peaked at 49% to win, Seahawks at 100%. The white spine is the win probability, every rung a snap: up for SEA, down for KC, as long as the yards it gained.
↳Bottom lineThe lead never changed hands; Chiefs peaked at 49% to win, Seahawks at 100%.
?How to read this chart
- Read it left to right:
- kickoff on the left, final whistle on the right.
- The white line
- is the chance that Seahawks win, play by play. High = SEA in control, low = KC in control, the middle is a coin flip. Each crossing of the middle is a change in who was more likely to win.
- Each little bar is one play:
- up for SEA on offense, down for KC; the longer the bar, the more yards. The key under the picture explains the marks (touchdown, turnover, field goal, punt).
 Seahawks ↑
 Chiefs ↓
The strands compared
?How to read this chart
- Each row compares the two teams
- on one stat: KC on the left, SEA on the right. The longer bar is the bigger number.
- Explosive plays
- are long gains (big runs and passes). Peak win prob. is the highest chance to win each team reached at any moment.
Every possession
?How to read this chart
- Each tile is one possession,
- in game order, colored by the team that had the ball.
- Inside:
- the team, how it ended (TD = touchdown, FG = field goal, INT = interception, FUM = fumble, otherwise punt or downs) and the yards gained. Brighter tiles are drives that scored.
The plays that moved it most
↳Bottom lineThe biggest swing: play 1, 3.3 expected points for Seahawks.
?How to read this chart
- The strip is the game clock;
- each numbered dot is one of the plays below, placed when it happened and colored by the team on offense.
- EP (expected points)
- is how many points the play added to (+) or took away from (−) the offense's expected score. +3.5 EP is worth more than a field goal; big minus numbers are usually turnovers.
- 1Q2 11:19 · SEA · Completion+3.3 EP
14-S.Darnold pass short middle to 11-J.Smith-Njigba to KC 20 for 33 yards (20-N.Williams; 17-A.Gilman).
- 2Q2 6:09 · KC · Interception−3.8 EP
15-P.Mahomes pass short left intended for 11-J.Royals INTERCEPTED by 39-T.Okada [3-N.Emmanwori] at SEA 34. 39-T.Okada to SEA 34 for no gain
- 3Q2 1:49 · SEA · Touchdown+4.6 EP
14-S.Darnold pass deep left to 11-J.Smith-Njigba pushed ob at KC 1 for 27 yards (5-M.Delane). The Replay Official reviewed the runner was ou
- 4Q2 0:35 · SEA · Completion+2.9 EP
14-S.Darnold pass deep left to 11-J.Smith-Njigba ran ob at KC 2 for 28 yards.
- 5Q2 0:23 · SEA · Interception−5.6 EP
14-S.Darnold pass short middle intended for 22-R.Shaheed INTERCEPTED by 20-N.Williams [56-G.Karlaftis] at KC -9. 20-N.Williams to SEA 44 for
- 6Q4 13:11 · KC · Completion+2.4 EP
15-P.Mahomes pass short middle to 87-T.Kelce to KC 36 for 19 yards (13-E.Jones).
- 7Q4 8:38 · KC · Missed field goal−3.3 EP
7-H.Butker 45 yard field goal is No Good, Wide Right, Center-41-J.Winchester, Holder-14-M.Araiza.
- 8Q4 3:52 · SEA · Touchdown+3.7 EP
23-E.Wilson left tackle for 21 yards, TOUCHDOWN.
The one play that could have changed it
?How to read this chart
- The line is win probability
- over the game (top = home team ahead). The dot marks the one play that could have gone either way; the big % is the losing team's chance right after it.
- Press Flip it
- to see where that chance would have gone if the play had gone the other way. Only that instant is priced: the rest of the game never happened.
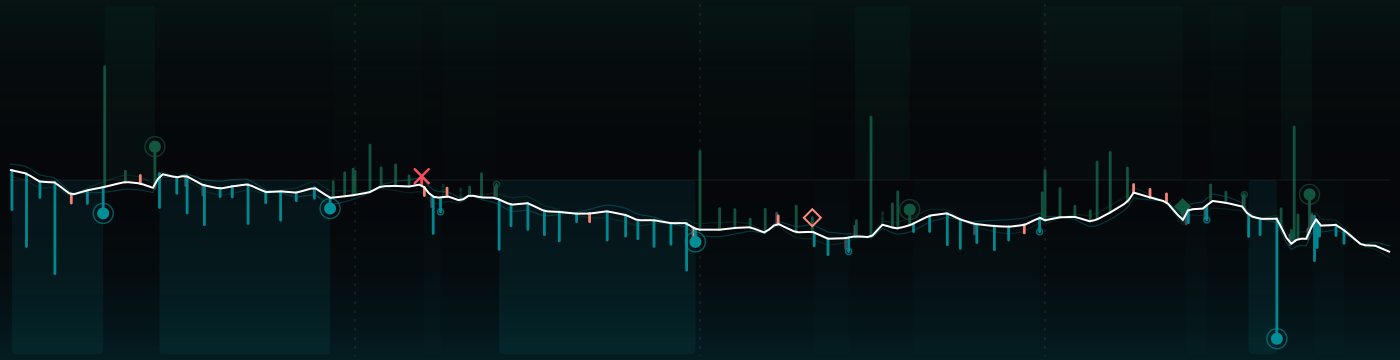
3@20Week 7Changes the winnerIf the 25-yard kick had missed
Q2 8:24 5-J.Myers 25 yard field goal is GOOD, Center-41-C.Stoll, Holder-4-M.Dickson.
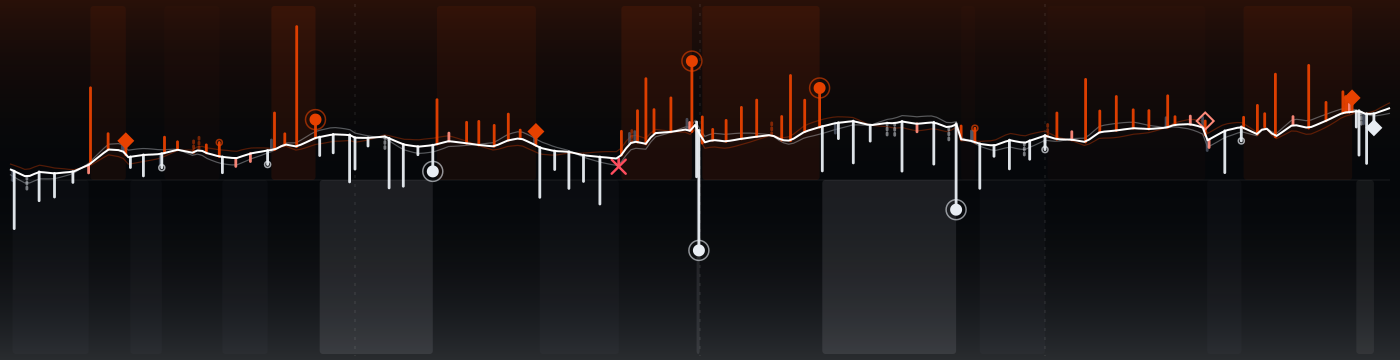
 24@30

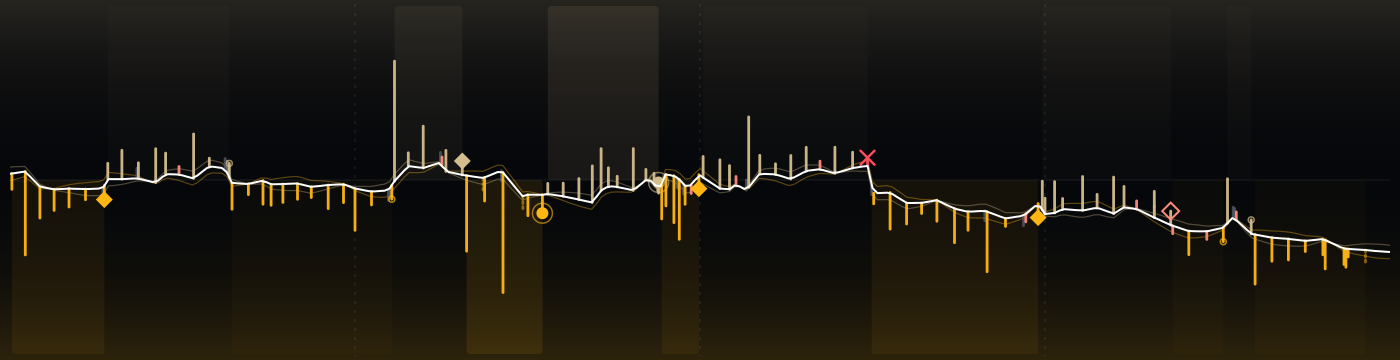
 16@10

 35@13
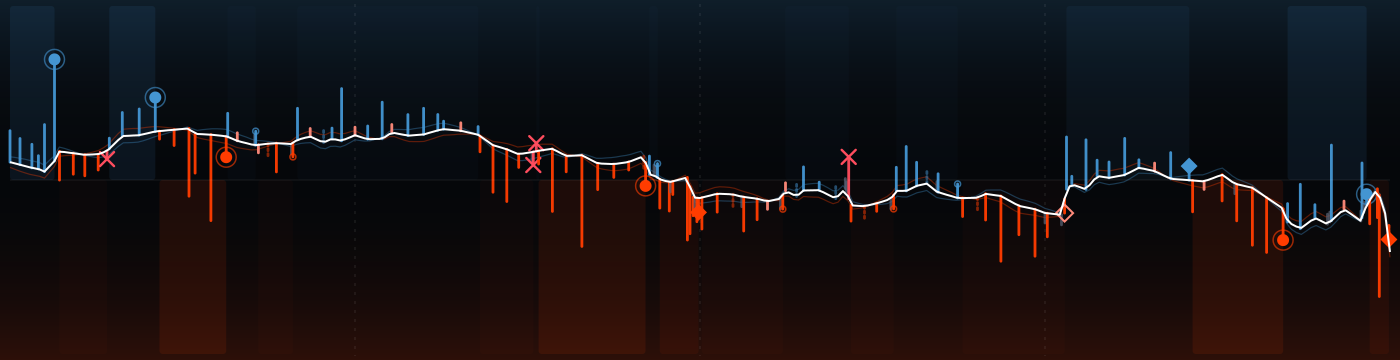
 28@25
 27@21

 43@13
 30@16




 38@21