ESPNWhy Giants' trade attempts 'just didn't happen'
 ESPNChiefs add WR Josh Downs at NFL trade deadline
 ESPNHow the Amani Hooker trade helps the Titans rebuild
 InjuryEric Wilson: Active → Cleared4 h ago
 Pro Football RumorsJets Work Out QBs Bailey Zappe, Austin Reed
 Pro Football RumorsCowboys Add RB Kendre Miller To Practice Squad
 InjuryNathan Shepherd: Active → Cleared6 h ago
 Cincinnati BengalsInside The Drive | How Ja'Marr Chase Took Over Madrid
 Pro Football RumorsNFL Practice Squad Updates: 11/10/26
 ESPNRaiders name Fernando Mendoza starting QB after trading Kirk Cousins
 InjuryQuentin Lake: Active → Cleared7 h ago
 InjuryDre'Mont Jones: Active → Cleared7 h ago
 San Francisco 49ersPower Rankings: Where the 49ers Stand Entering Week 10
 ESPNGet ready for Chargers vs. Ravens on Monday Night Football
 Pro Football RumorsMinor NFL Transactions: 11/10/26
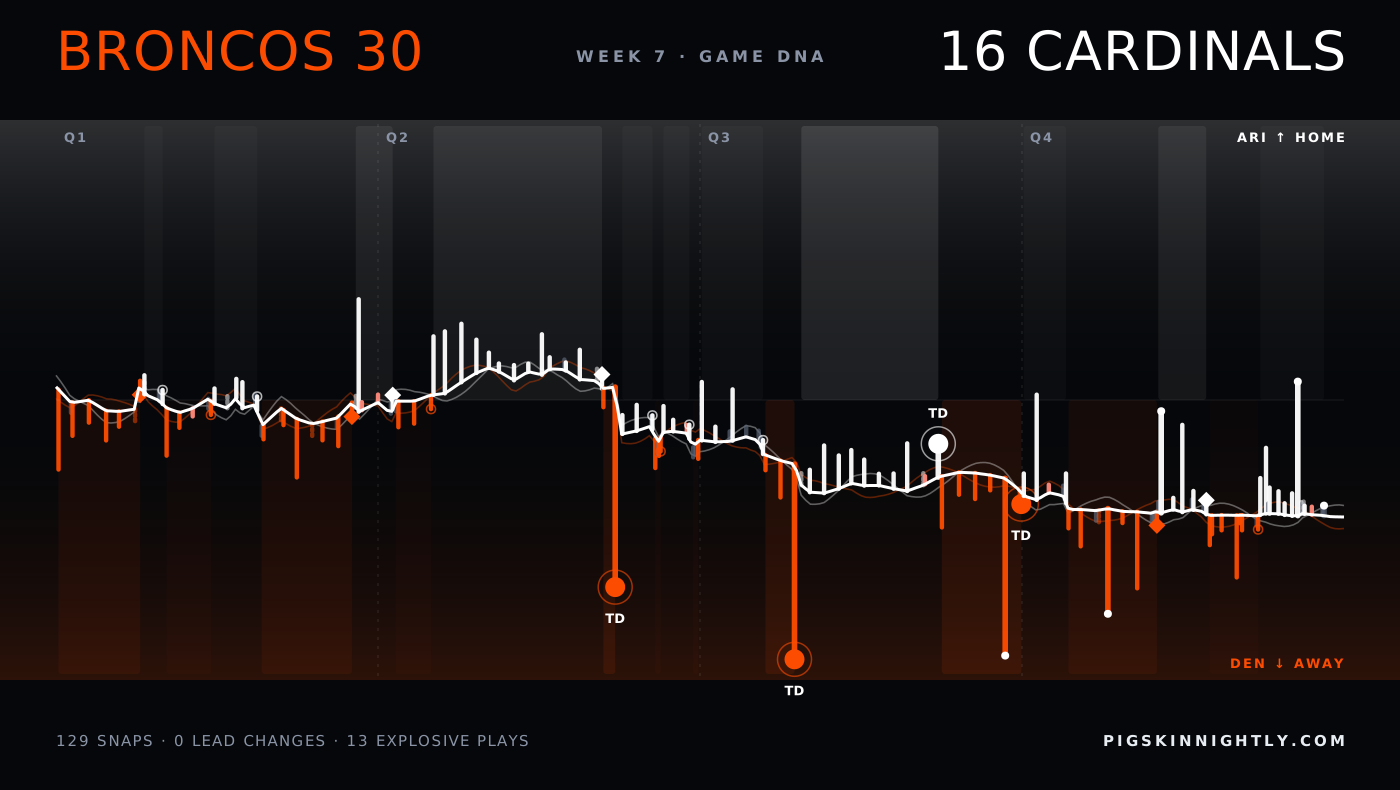
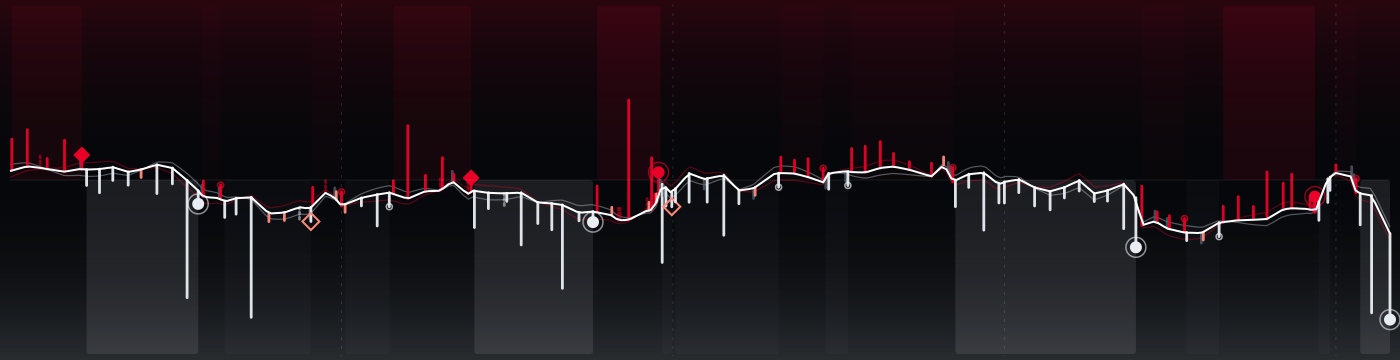
Week 7 · 2026Broncos 30 · 16 Cardinals
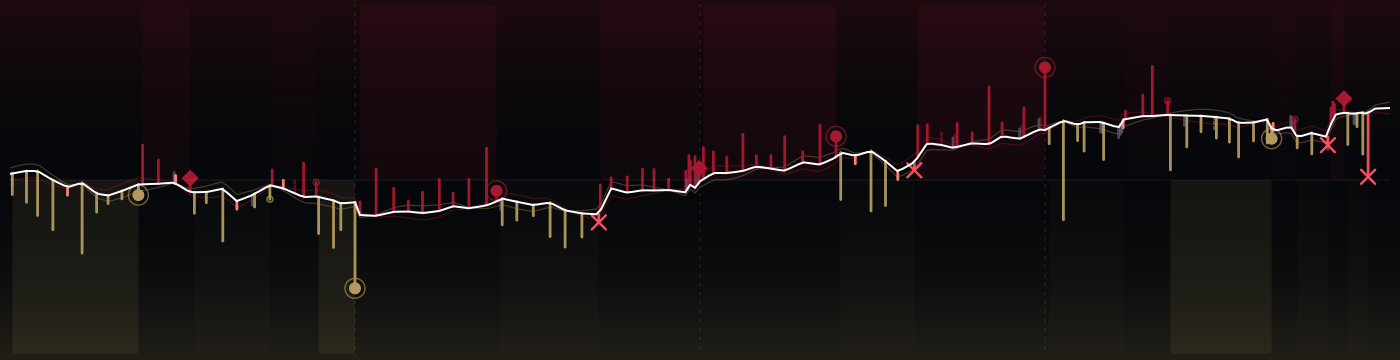
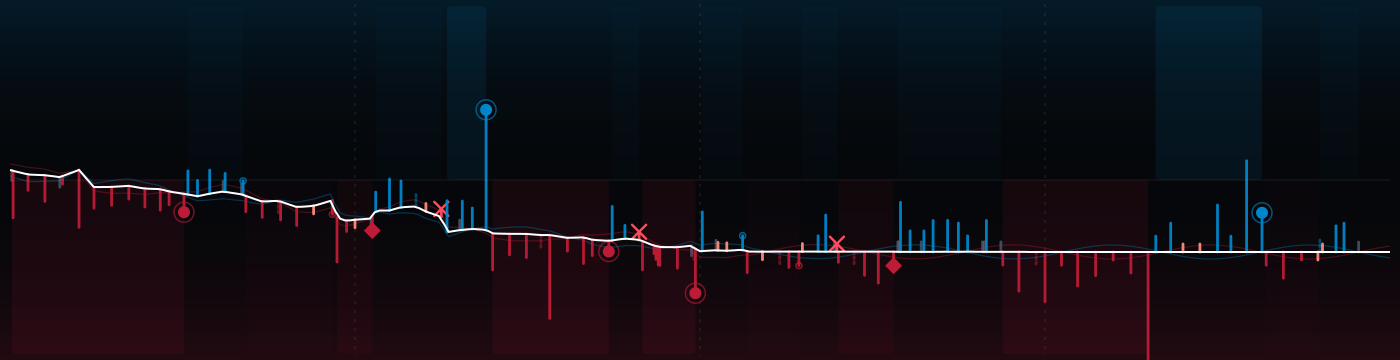
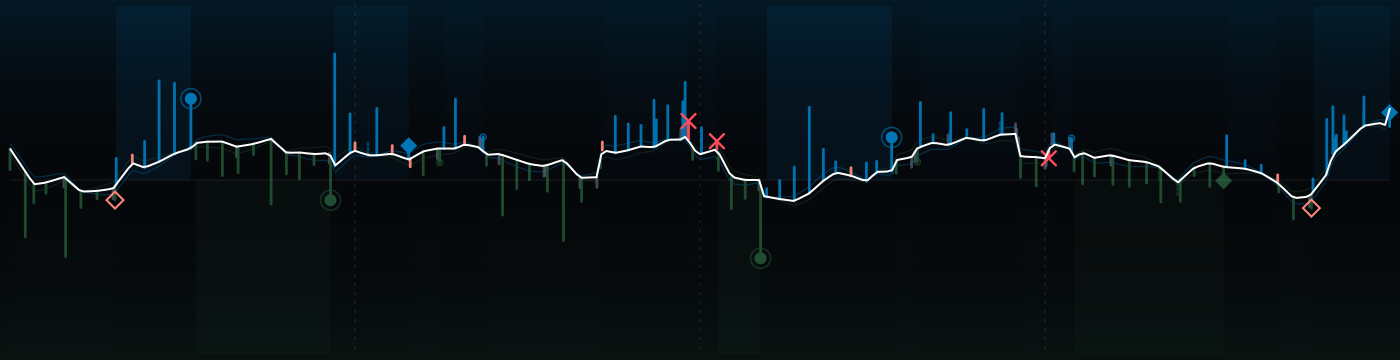
158 plays, one strand. Broncos won without the lead ever changing hands; Broncos peaked at 100% to win, Cardinals at 64%. The white spine is the win probability, every rung a snap: up for ARI, down for DEN, as long as the yards it gained.
↳Bottom lineThe lead never changed hands; Broncos peaked at 100% to win, Cardinals at 64%.
?How to read this chart
- Read it left to right:
- kickoff on the left, final whistle on the right.
- The white line
- is the chance that Cardinals win, play by play. High = ARI in control, low = DEN in control, the middle is a coin flip. Each crossing of the middle is a change in who was more likely to win.
- Each little bar is one play:
- up for ARI on offense, down for DEN; the longer the bar, the more yards. The key under the picture explains the marks (touchdown, turnover, field goal, punt).
 Cardinals ↑
 Broncos ↓
The strands compared
?How to read this chart
- Each row compares the two teams
- on one stat: DEN on the left, ARI on the right. The longer bar is the bigger number.
- Explosive plays
- are long gains (big runs and passes). Peak win prob. is the highest chance to win each team reached at any moment.
Every possession
?How to read this chart
- Each tile is one possession,
- in game order, colored by the team that had the ball.
- Inside:
- the team, how it ended (TD = touchdown, FG = field goal, INT = interception, FUM = fumble, otherwise punt or downs) and the yards gained. Brighter tiles are drives that scored.
The plays that moved it most
↳Bottom lineThe biggest swing: play 1, 5.5 expected points for Broncos.
?How to read this chart
- The strip is the game clock;
- each numbered dot is one of the plays below, placed when it happened and colored by the team on offense.
- EP (expected points)
- is how many points the play added to (+) or took away from (−) the offense's expected score. +3.5 EP is worth more than a field goal; big minus numbers are usually turnovers.
- 1Q2 3:57 · DEN · Touchdown+5.5 EP
10-B.Nix scrambles up the middle for 62 yards, TOUCHDOWN.
- 2Q3 10:36 · DEN · Touchdown+4.5 EP
10-B.Nix pass short left to 12-R.Harvey for 52 yards, TOUCHDOWN.
- 3Q3 0:47 · DEN · Completion+3.2 EP
10-B.Nix pass deep right to 19-M.Mims pushed ob at ARI 6 for 47 yards (35-K.King).
- 4Q4 11:00 · DEN · Completion+2.6 EP
10-B.Nix pass deep right to 17-J.Waddle to ARI 33 for 27 yards (21-G.Williams).
- 5Q4 8:31 · ARI · Completion+2.9 EP
7-J.Brissett pass deep left to 85-T.McBride to DEN 39 for 26 yards (30-T.Rapp; 22-B.Jones).
- 6Q4 4:51 · DEN · Run−2.2 EP
63-A.Palczewski reported in as eligible. 10-B.Nix FUMBLES (Aborted) at DEN 48, recovered by DEN-17-J.Waddle at DEN 44. DEN-17-J.Waddle was i
- 7Q4 2:09 · ARI · Completion+3.6 EP
7-J.Brissett pass short middle to 86-J.Brooks to DEN 1 for 35 yards (30-T.Rapp) [96-E.Uwazurike].
- 8Q4 0:56 · ARI · Incomplete−2.6 EP
7-J.Brissett pass incomplete short middle to 14-Mi.Wilson (97-M.Roach).
The one play that could have changed it
?How to read this chart
- The line is win probability
- over the game (top = home team ahead). The dot marks the one play that could have gone either way; the big % is the losing team's chance right after it.
- Press Flip it
- to see where that chance would have gone if the play had gone the other way. Only that instant is priced: the rest of the game never happened.
30@16Week 7Changes the winnerIf the 43-yard kick had missed
Q1 1:13 3-W.Lutz 43 yard field goal is GOOD, Center-48-M.Fraboni, Holder-16-J.Crawshaw.

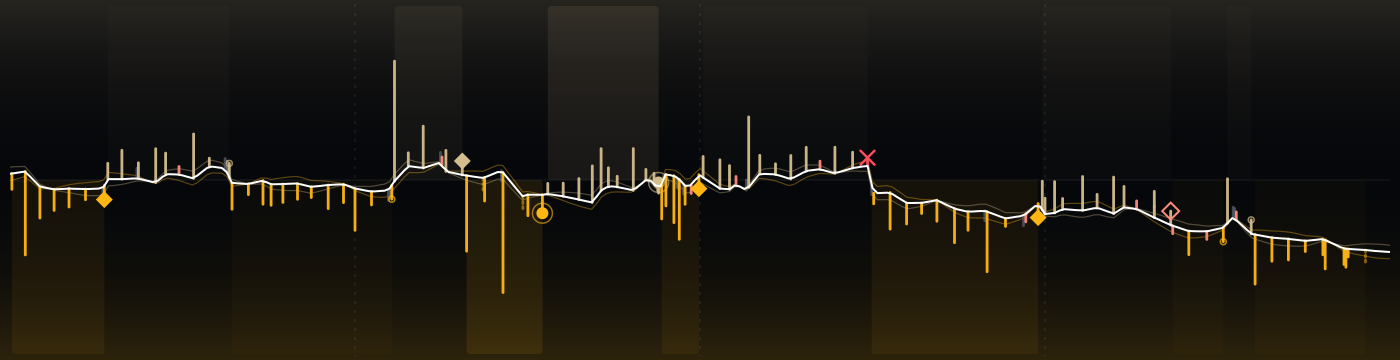
 16@10


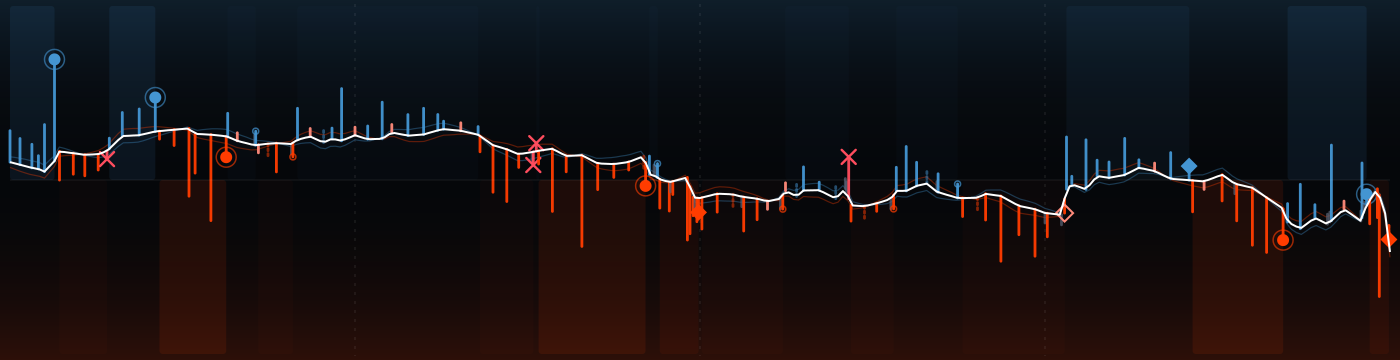
 27@24
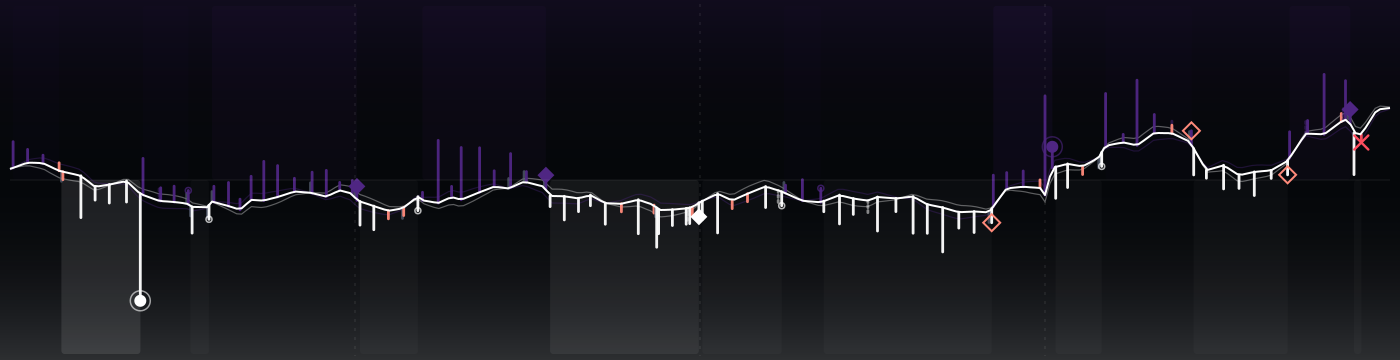
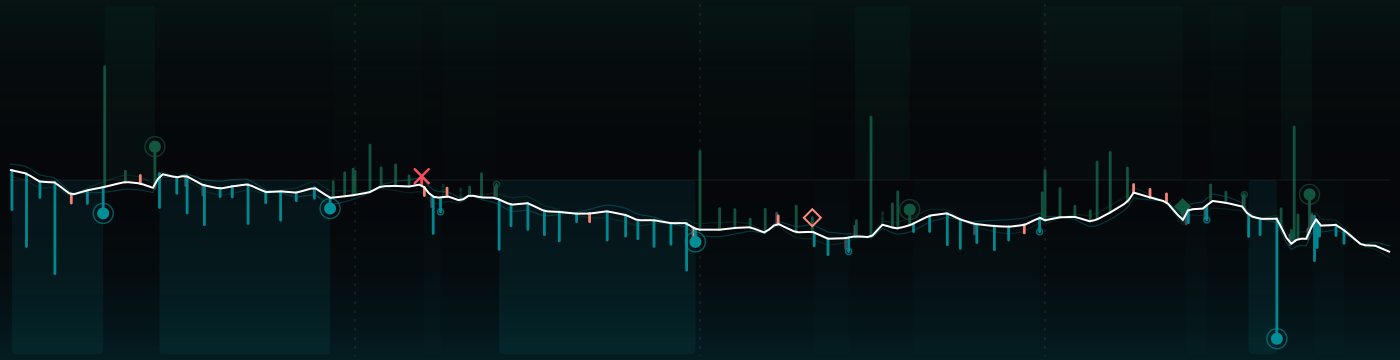



 43@13

 17@20