Lions DeskLions offense has slid from 0.326 EPA a play in Week 5 to 0.009 in Week 9just now
 Colts DeskColts rank 32nd against the run while the offense rushes at a top-five level11 min ago
 InjuryJacob Rodriguez: Active → Cleared11 min ago
 InjuryPatrick Mahomes: Active → Questionable11 min ago
 InjuryDalton Kincaid: Active → Questionable11 min ago
 InjuryTrey Smack: Active → Questionable11 min ago
 Minnesota VikingsInitial Vikings at Packers Injury Report for Week 10 of 2026
 Saints DeskSaints offense sits 22nd in EPA per play heading into Panthers game41 min ago
 Broncos DeskBroncos defense is giving back ground just as the offense finds its footing51 min ago
 Tennessee TitansQuick Hits on the Titans From Wednesday of Jaguars Week
 Arizona CardinalsMichael Wilson Prognosis Good For 2027 Return
 Dallas CowboysQuinnen Williams is all business in eyeing the 49ers
 Pro Football RumorsLongtime Steelers RB, Coach Dick Hoak Dies At 86
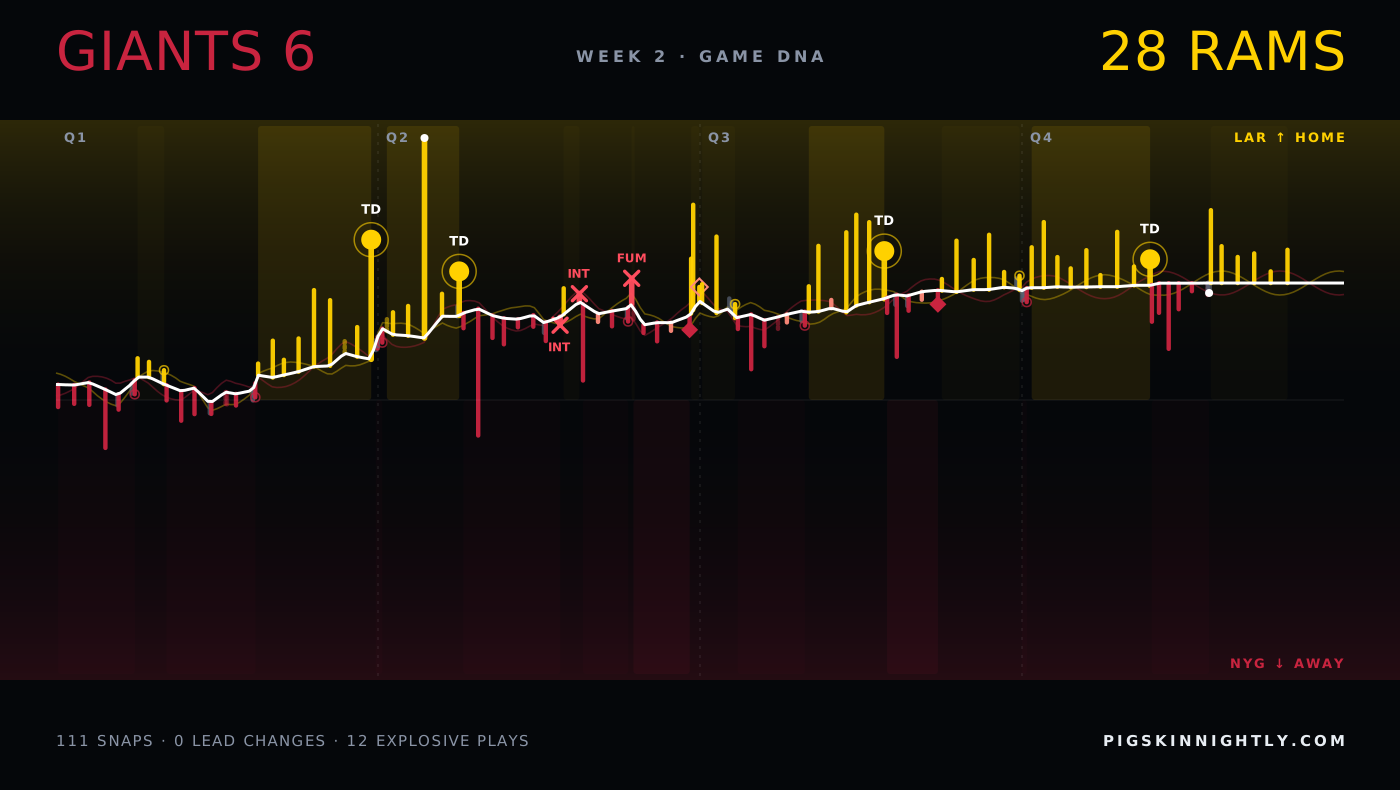
Week 2 · 2026Giants 6 · 28 Rams
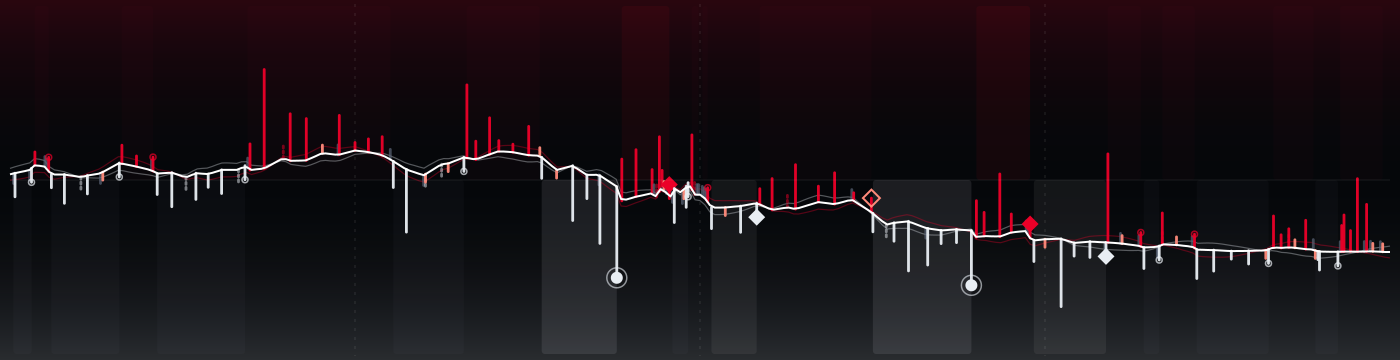
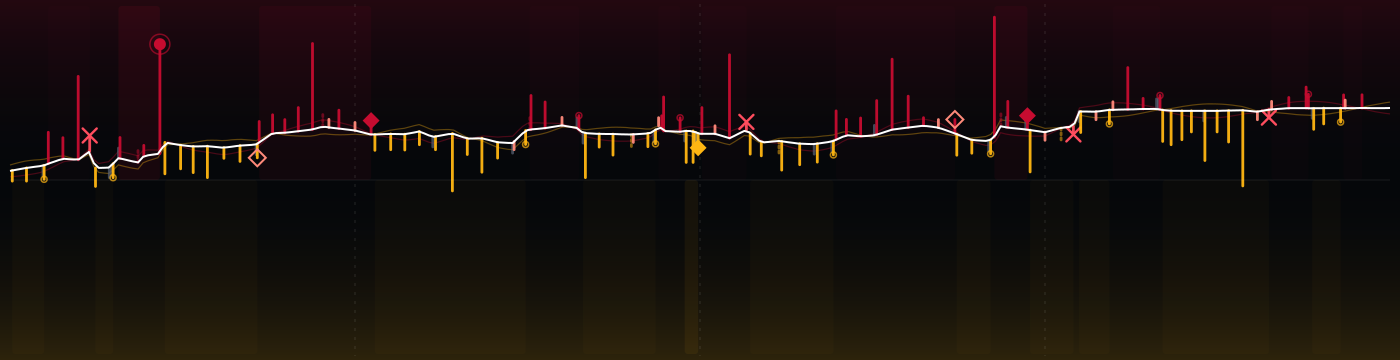
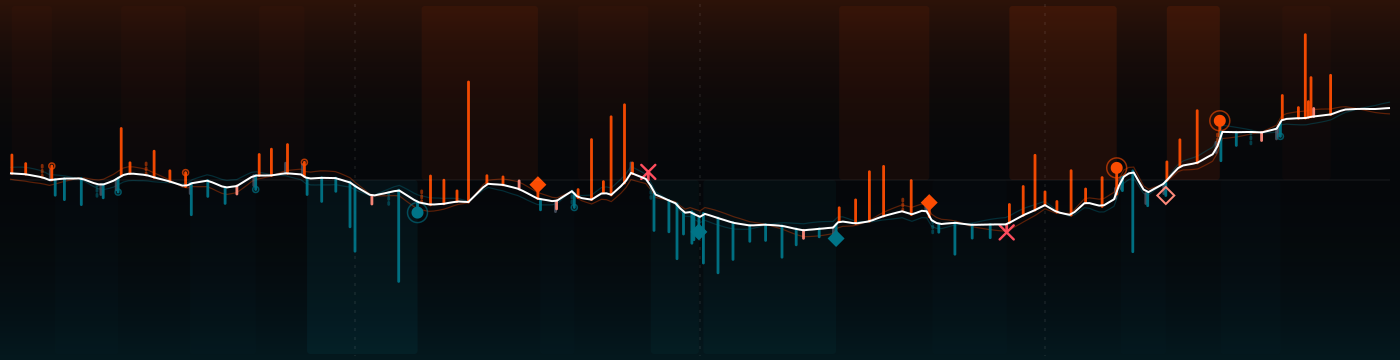
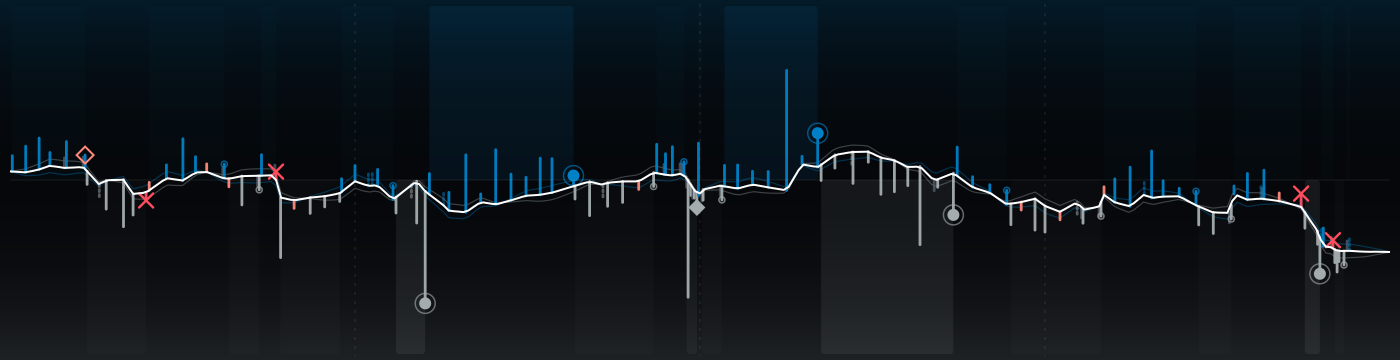
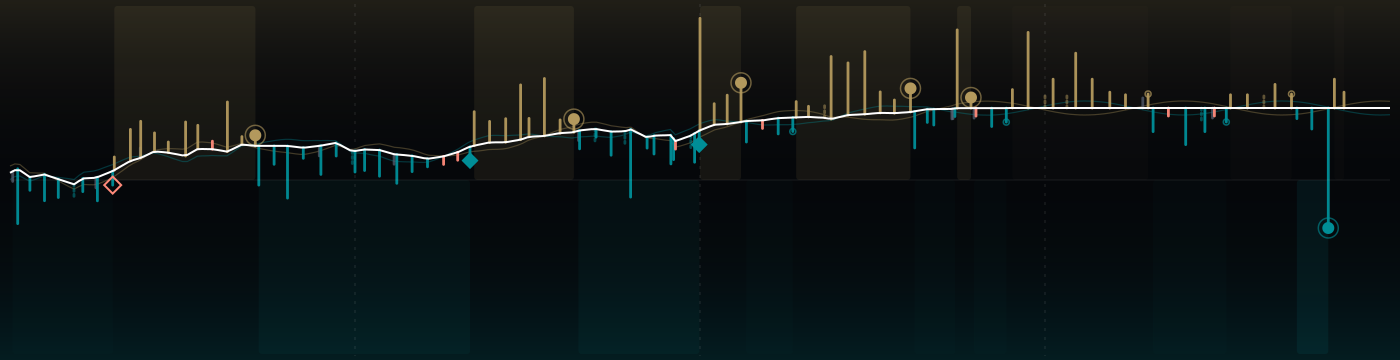
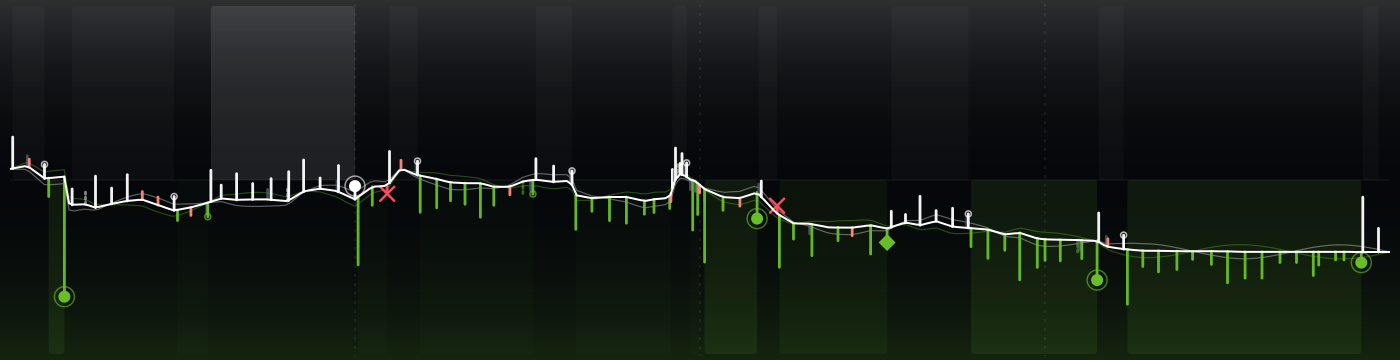
131 plays, one strand. Rams won without the lead ever changing hands; Giants peaked at 51% to win, Rams at 100%. The white spine is the win probability, every rung a snap: up for LAR, down for NYG, as long as the yards it gained.
↳Bottom lineThe lead never changed hands; Giants peaked at 51% to win, Rams at 100%.
?How to read this chart
- Read it left to right:
- kickoff on the left, final whistle on the right.
- The white line
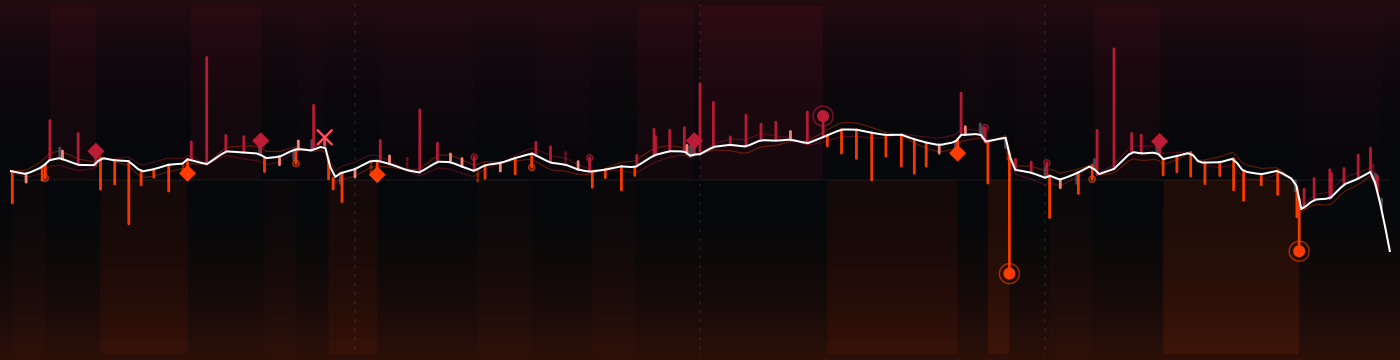
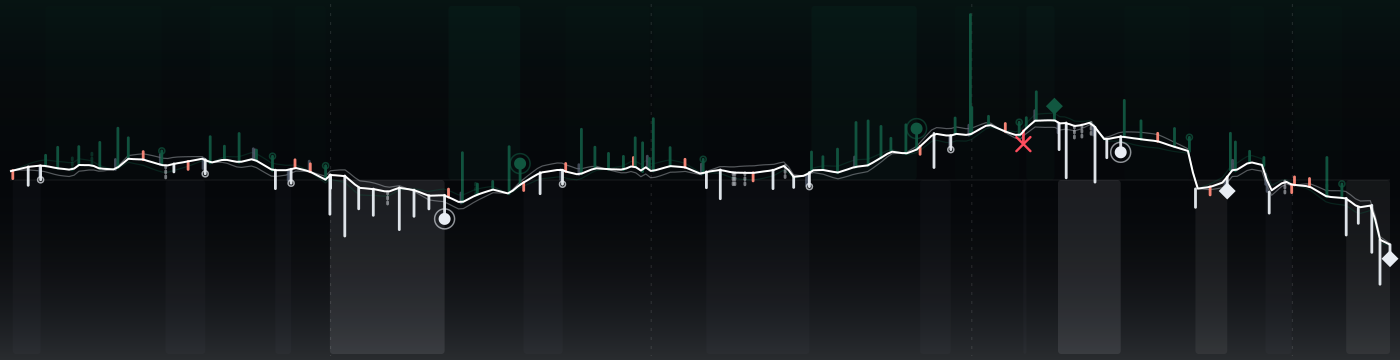
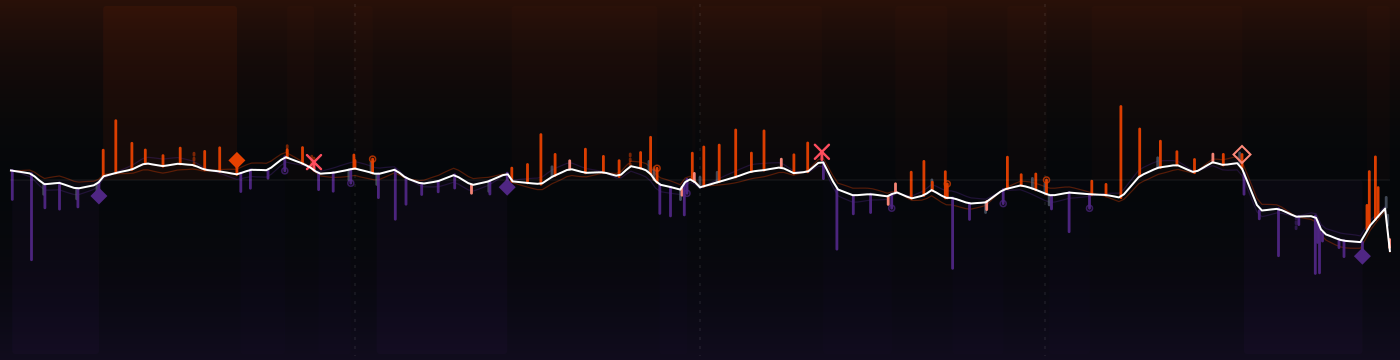
- is the chance that Rams win, play by play. High = LAR in control, low = NYG in control, the middle is a coin flip. Each crossing of the middle is a change in who was more likely to win.
- Each little bar is one play:
- up for LAR on offense, down for NYG; the longer the bar, the more yards. The key under the picture explains the marks (touchdown, turnover, field goal, punt).
 Rams ↑
 Giants ↓
The strands compared
?How to read this chart
- Each row compares the two teams
- on one stat: NYG on the left, LAR on the right. The longer bar is the bigger number.
- Explosive plays
- are long gains (big runs and passes). Peak win prob. is the highest chance to win each team reached at any moment.
Every possession
?How to read this chart
- Each tile is one possession,
- in game order, colored by the team that had the ball.
- Inside:
- the team, how it ended (TD = touchdown, FG = field goal, INT = interception, FUM = fumble, otherwise punt or downs) and the yards gained. Brighter tiles are drives that scored.
The plays that moved it most
↳Bottom lineThe biggest swing: play 1, 3.8 expected points for Rams.
?How to read this chart
- The strip is the game clock;
- each numbered dot is one of the plays below, placed when it happened and colored by the team on offense.
- EP (expected points)
- is how many points the play added to (+) or took away from (−) the offense's expected score. +3.5 EP is worth more than a field goal; big minus numbers are usually turnovers.
- 1Q1 0:19 · LAR · Touchdown+3.8 EP
9-M.Stafford pass short middle to 17-D.Adams for 31 yards, TOUCHDOWN.
- 2Q2 12:50 · LAR · Completion+5.4 EP
9-M.Stafford pass deep right to 17-D.Adams to NYG 14 for 64 yards (8-J.Holland).
- 3Q2 11:13 · LAR · Touchdown+2.9 EP
9-M.Stafford pass short left to 23-K.Williams for 10 yards, TOUCHDOWN.
- 4Q2 10:20 · NYG · Completion+2.5 EP
19-J.Winston pass deep left to 17-D.Mooney pushed ob at LA 31 for 33 yards (3-K.Curl) [94-D.Johnson].
- 5Q2 6:31 · NYG · Interception−4.6 EP
19-J.Winston pass deep middle intended for 1-M.Nabers INTERCEPTED by 22-T.McDuffie [0-B.Young] at LA -1. 22-T.McDuffie to LA 21 for 22 yards
- 6Q2 3:11 · LAR · Fumble lost−5.3 EP
23-K.Williams up the middle to LA 11 for 5 yards (8-J.Holland; 52-A.Reese). FUMBLES (8-J.Holland), RECOVERED by NYG-8-J.Holland at LA 11.
- 7Q3 5:50 · NYG · Completion+2.4 EP
19-J.Winston pass short middle to 17-D.Mooney to LA 34 for 15 yards (30-J.Wallace).
- 8Q4 6:17 · NYG · Incomplete−3.1 EP
19-J.Winston pass incomplete deep right to 88-M.Fields (1-E.Forbes). Penalty on NYG-88-M.Fields, Offensive Pass Interference, declined.
The one play that could have changed it
?How to read this chart
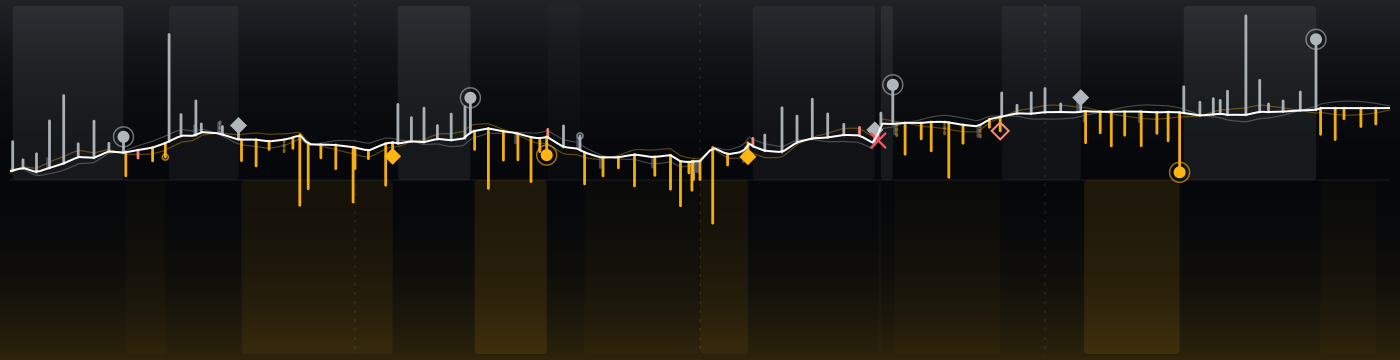
- The line is win probability
- over the game (top = home team ahead). The dot marks the one play that could have gone either way; the big % is the losing team's chance right after it.
- Press Flip it
- to see where that chance would have gone if the play had gone the other way. Only that instant is priced: the rest of the game never happened.
If the Giants had recovered that fumble
Q4 11:21 24-B.Corum left guard to NYG 18 for 4 yards (8-J.Holland). FUMBLES (8-J.Holland), and recovers at NYG 21.
 34@3

 20@6

 23@19






 24@20

 13@20
 26@14


 31@7
 20@37