 ESPNHow the Amani Hooker trade helps the Titans rebuild
 InjuryEric Wilson: Active → Cleared1 h ago
 Pro Football RumorsJets Work Out QBs Bailey Zappe, Austin Reed
 InjuryZach Allen: Active → Cleared2 h ago
 Pro Football RumorsCowboys Add RB Kendre Miller To Practice Squad
 ESPNHow Josh Downs fits with Patrick Mahomes and the Chiefs offense
 InjuryNathan Shepherd: Active → Cleared3 h ago
 Cincinnati BengalsInside The Drive | How Ja'Marr Chase Took Over Madrid
 Pro Football RumorsNFL Practice Squad Updates: 11/10/26
 ESPNRaiders name Fernando Mendoza starting QB after trading Kirk Cousins
 InjuryQuentin Lake: Active → Cleared4 h ago
 InjuryDre'Mont Jones: Active → Cleared4 h ago
 ESPNGet ready for Chargers vs. Ravens on Monday Night Football
 ESPNJets 'stand pat' at NFL trade deadline

The San Francisco 49ers (7-1) visit the New York Giants (5-2-1) on Sun, Dec 6, 1 PM ET at MetLife Stadium in East Rutherford, NJ (Week 13, 2026 season), on Fox.
When and where is 49ers vs Giants?
Sun, Dec 6, 1 PM ET at MetLife Stadium in East Rutherford, NJ. TV: Fox.
Who is injured for 49ers vs Giants?
49ers: Brandon Aiyuk (WR, out, personal), Deebo Samuel Sr. (WR, questionable, hamstring), Deommodore Lenoir (CB, questionable, foot), Mike Evans (WR, questionable, achilles) and Renardo Green (CB, questionable, back). Giants: Cam Skattebo (RB, out), Abdul Carter (LB, questionable, knee), Colton Hood (CB, questionable, finger), J.J. McCarthy (QB, questionable) and Malik Harrison (LB, questionable, groin).
Cite this page
Pigskin Nightly, “49ers at Giants: Week 13 preview”, https://pigskinnightly.com/games/2026-12-06-sf-at-nyg (updated 2026-11-11).
Where this game will be decided
- 1
 49ers red-zone offense vs Giants red-zone defense
The 49ers' red-zone offense ranks 1st in red-zone touchdown rate (85%, 27 trips) against a Giants red-zone defense ranked 29th (75% allowed, 20 trips faced).
1stSF offense28 spots apart29thNYG defense - 249ers defense against big plays vs Giants big-play offense
The 49ers' defense against big plays ranks 1st in explosive-play rate (4.8% allowed, 481 plays faced) and faces a Giants big-play offense ranked 20th (8.7%, 519 plays).
20thNYG offense19 spots apart1stSF defense - 349ers pass protection vs Giants pass rush
The 49ers' pass protection ranks 1st in sack rate (3.1% sacked, 262 dropbacks) against a Giants pass rush ranked 19th (5.5% of dropbacks, 290 dropbacks faced).
1stSF offense18 spots apart19thNYG defense
When the 49ers have the ballEdge SF · +12 ranks
Dropbacks include sacks and scrambles; rushes are designed runs. What EPA measures.
When the Giants have the ballEdge SF · +18 ranks
Third downEdge SF · +10 ranks
Conversions are third-down snaps that gained a first down or scored.
Red zoneEdge SF · +28 ranks
A trip is a drive with at least one snap inside the opponent's 20; the rate is trips that ended in an offensive touchdown. Small samples swing fast here.
Explosive playsEdge SF · +19 ranks
Completions of 20+ yards and runs of 10+, per snap. Definition.
Pressure & sacksEdge SF · +18 ranks
Sacks per dropback. The public play-by-play has no pressure charting, so this is the sack side of it only.
TurnoversEdge SF · +9 ranks
Interceptions and lost fumbles on offensive snaps, per game. Turnover rates are among the least stable numbers in football.
AbsencesSF 0 · NYG 0 regulars out or doubtful
49ers5 listed0 of them are regulars ruled out or doubtful (60%+ of their unit's snaps across 3+ weeks on the field).
- QRenardo GreenCB97% defense · 8 wk
- QDeommodore LenoirCB95% defense · 8 wk
- QDeebo Samuel Sr.WR58% offense · 5 wk
- QMike EvansWR54% offense · 6 wk
- OUTBrandon AiyukWRno snaps
 Giants5 listed
0 of them are regulars ruled out or doubtful (60%+ of their unit's snaps across 3+ weeks on the field).
- QAbdul CarterLB87% defense · 8 wk
- QColton HoodCB68% defense · 6 wk
- OUTCam SkatteboRB55% offense · 7 wk
- QJ.J. McCarthyQB54% offense · 4 wk
- QMalik HarrisonLB4% defense · 6 wk
Snap share is the average of the weeks each player was on the field this season. Full injury report ↓
Rest & travelSame rest · SF travels 2,547 mi
Away49ersLast: Sun wk 12 vs SEA · 21,378 mi flown this season
HomeGiantsLast: Sun wk 12 at IND · Indianapolis · 8,311 mi flown this season
Sample: SF 8 games, 467 offensive and 481 defensive plays · NYG 8 games, 519 offensive and 476 defensive plays. Rank 1 is the best offense or the best defense in each stat. Keys are the largest rank gaps (12+ spots) between an offense and the defense it faces, one per stat. Ranks are not schedule-adjusted.
Tale of the tape
SFNYGForm
Last six results ARIWk 3
 SEAWk 5
 WSHWk 6
 ATLWk 7
 HOUWk 7
 PHIWk 9
Injury report
League report49ers5 listed- OUTBrandon AiyukWR · Personal
- QDeebo Samuel Sr.WR · Hamstring
- QDeommodore LenoirCB · Foot
- QMike EvansWR · Achilles
- QRenardo GreenCB · Back
Giants5 listed- OUTCam SkatteboRB
- QAbdul CarterLB · Knee
- QColton HoodCB · Finger
- QJ.J. McCarthyQB
- QMalik HarrisonLB · Groin
Expected starters
ExpectedEvery game →Depth chart rank 1, adjusted for the injury report. Kickoff Sun, Dec 6, 1 PM ET.
Away49ers4 questionableOffense
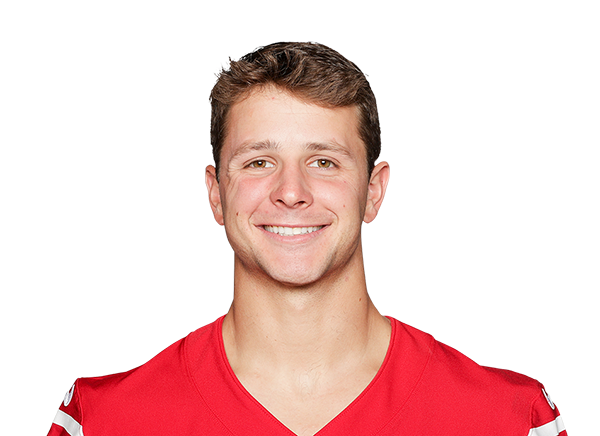
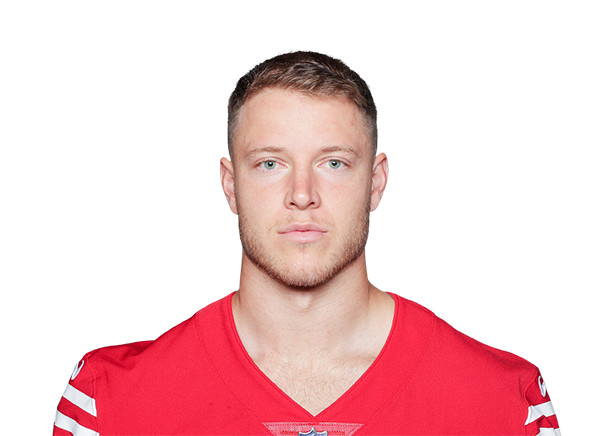
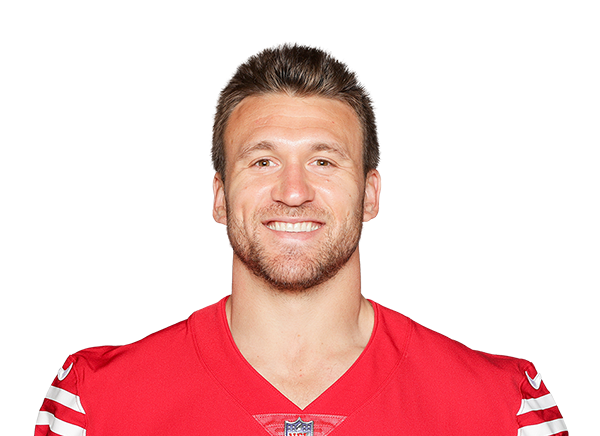
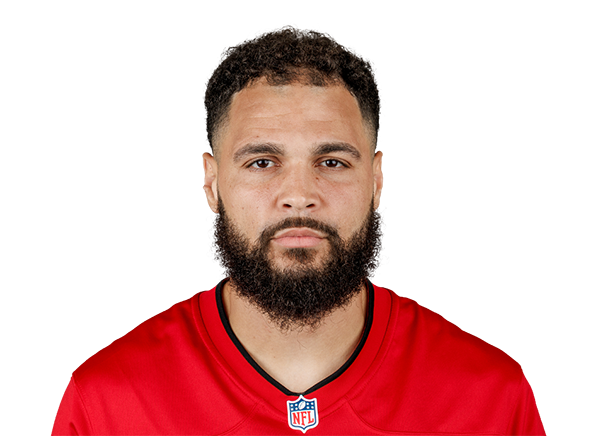
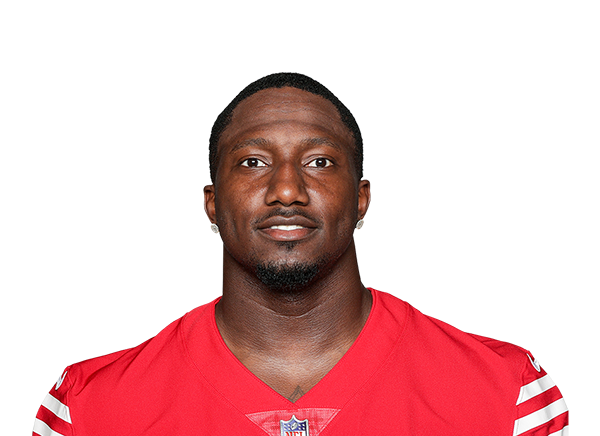
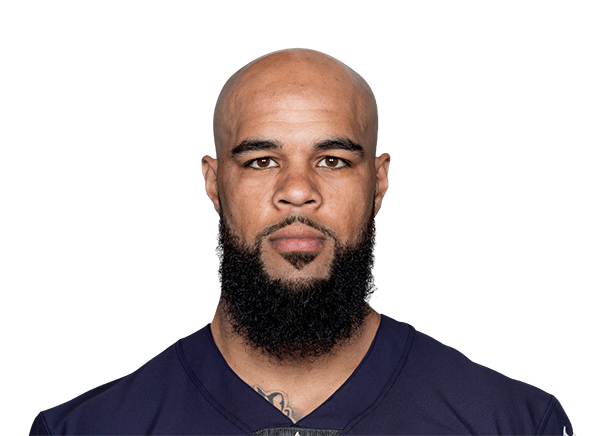
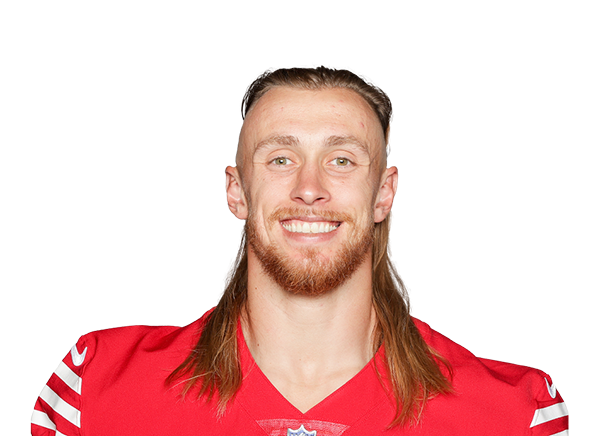
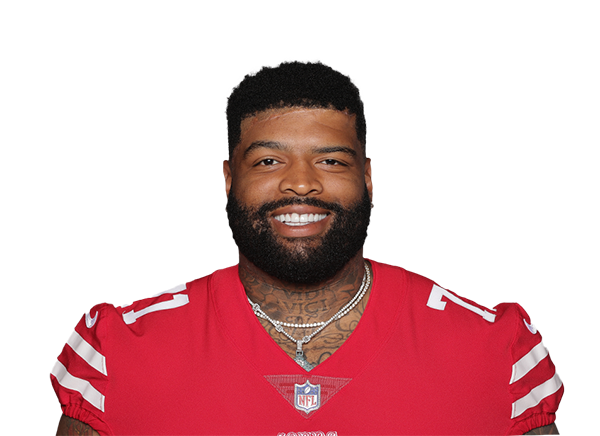
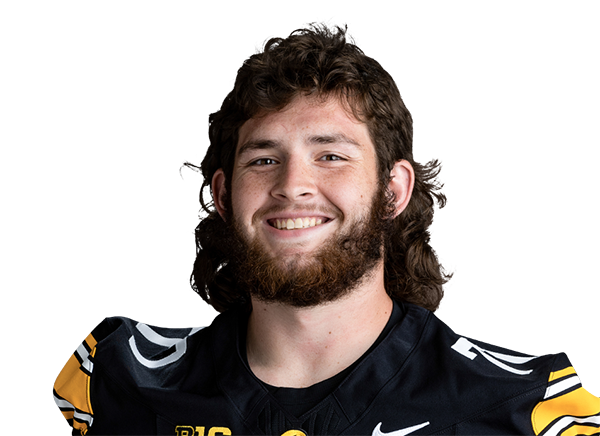

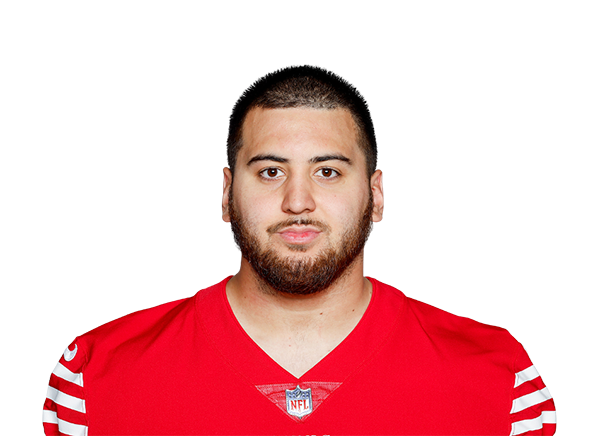
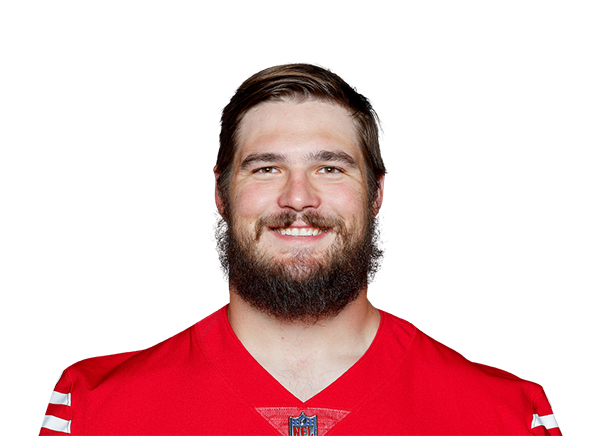

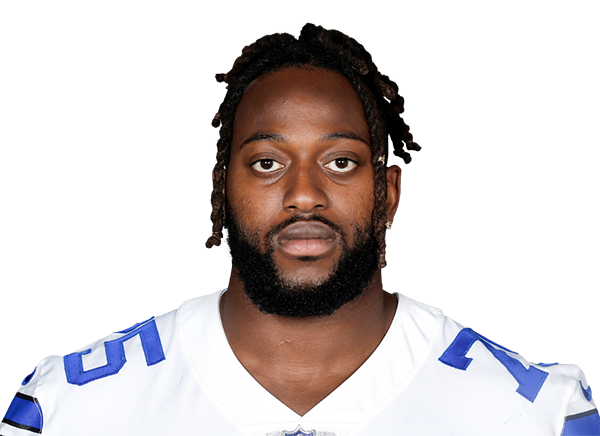
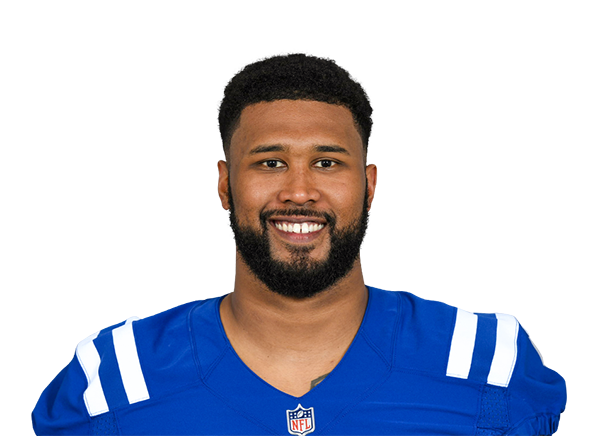
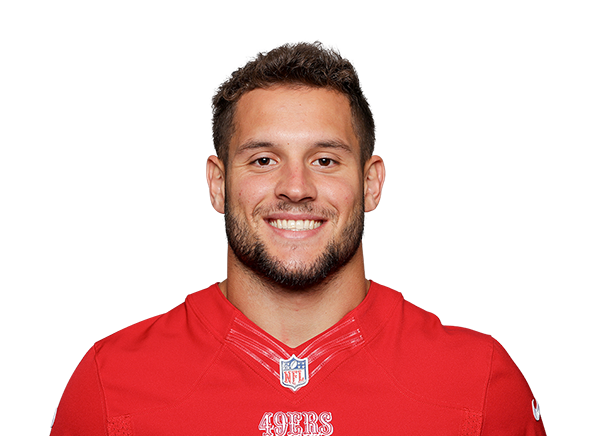
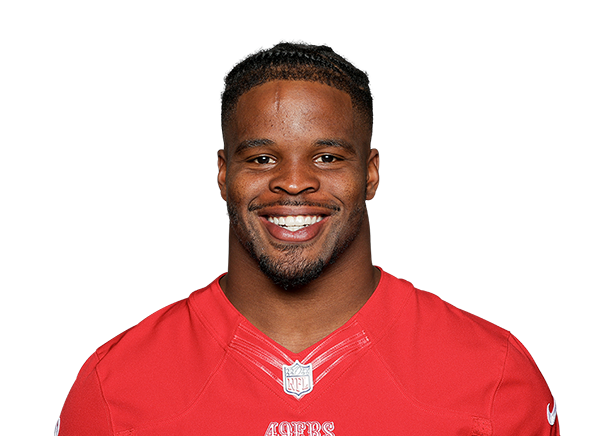
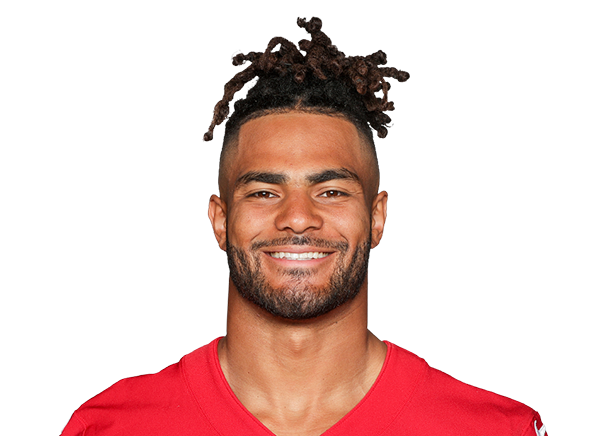
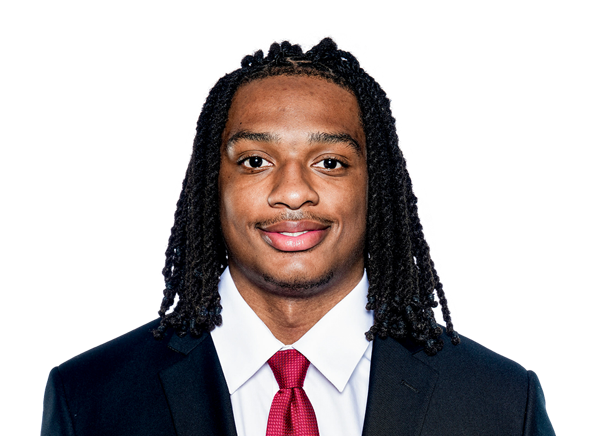
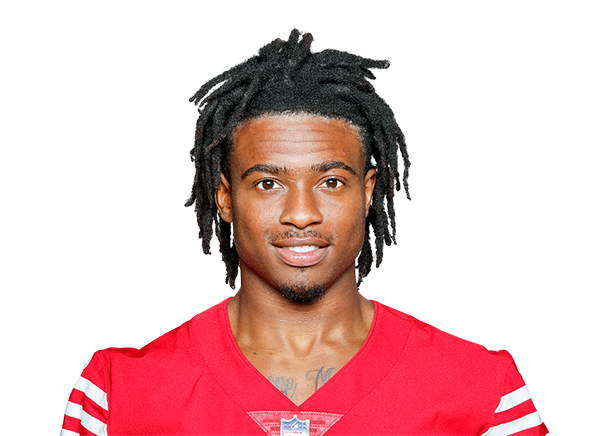
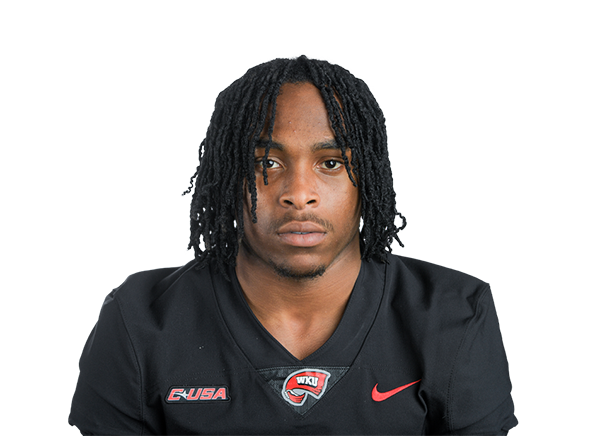
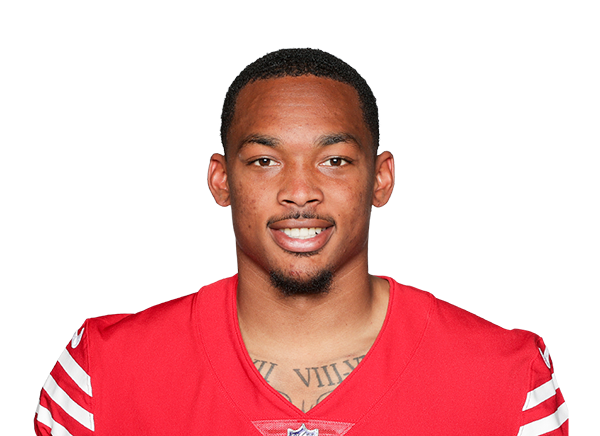
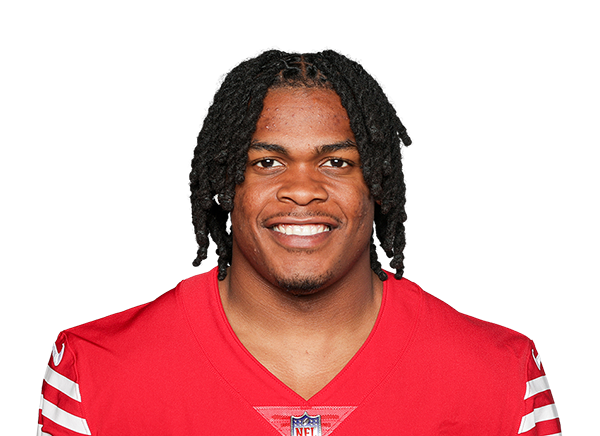
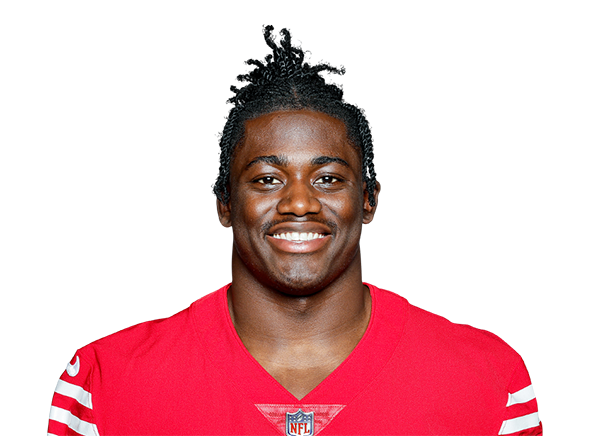 HomeGiants2 next man up · 2 questionable
Offense
- QB
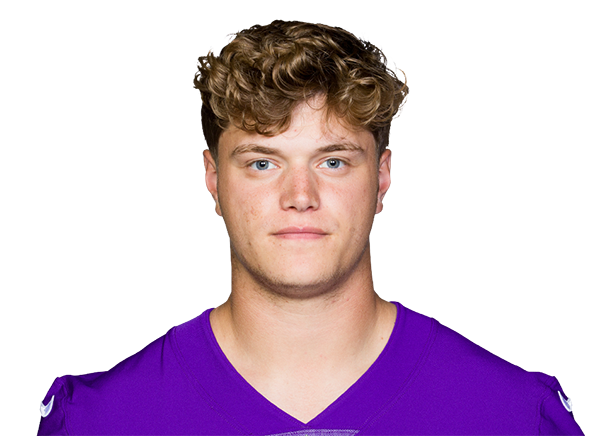 #18J.J. McCarthyQQ
- RB
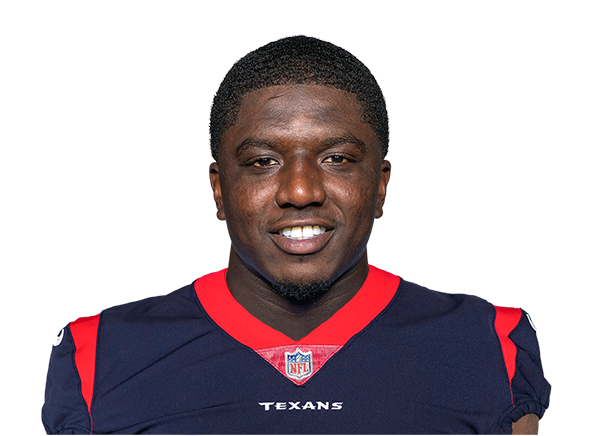 #26Devin Singletaryfor Cam Skattebo (Out)Next up
- FB
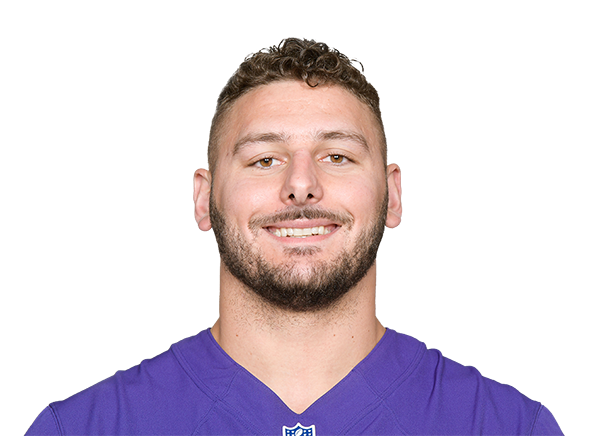 #45Patrick Ricard
- WR
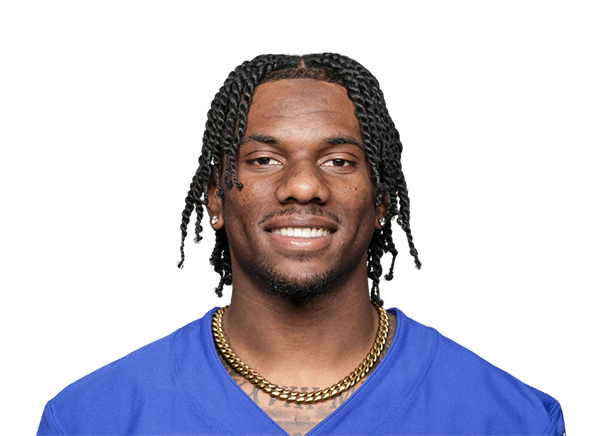 #1Malik Nabers
- WR
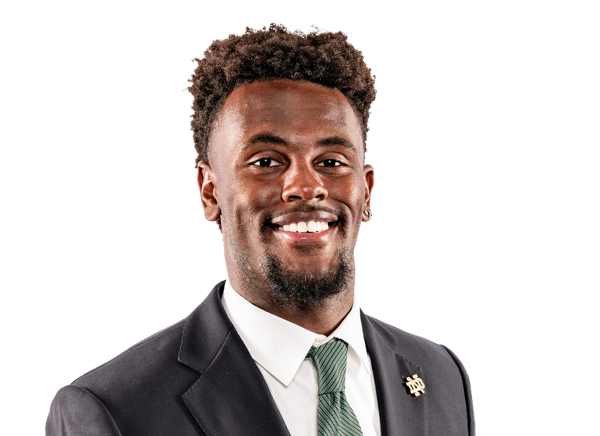 #88Malachi Fields
- WR
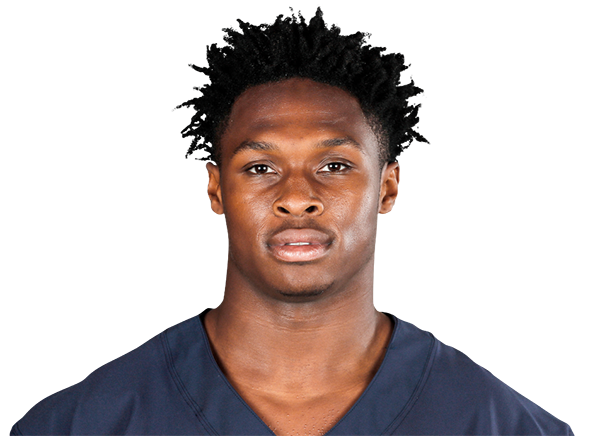 #17Darnell Mooney
- TE
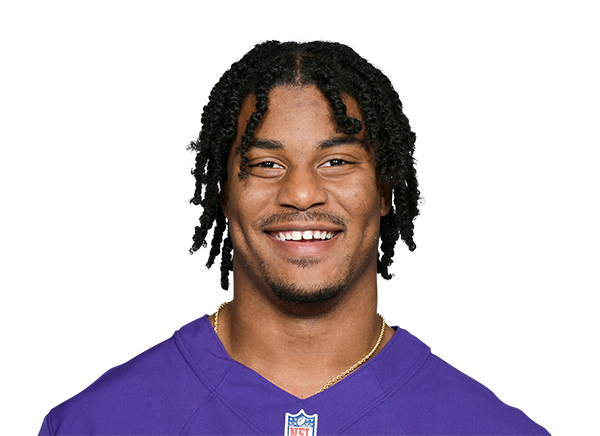 #9Isaiah Likely
- LT
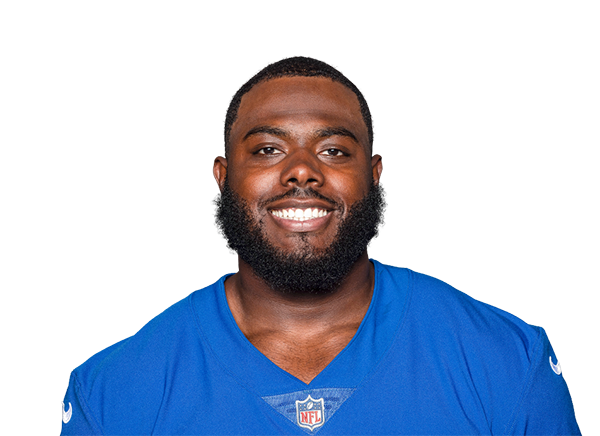 #78Andrew Thomas
- LG
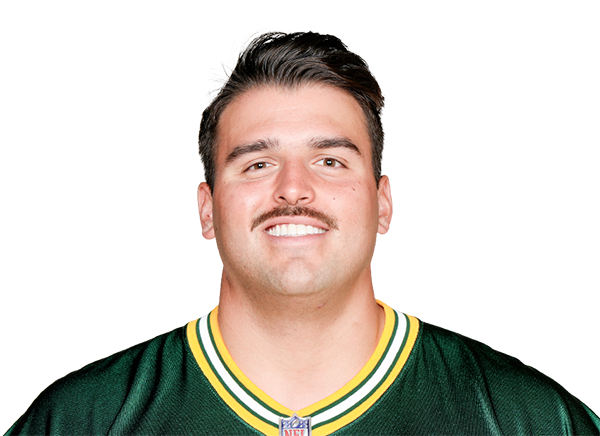 #76Jon Runyan
- C
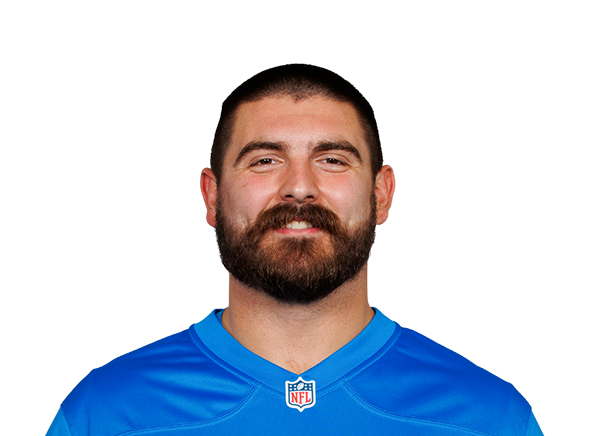 #60Bryan Hudson
- RG
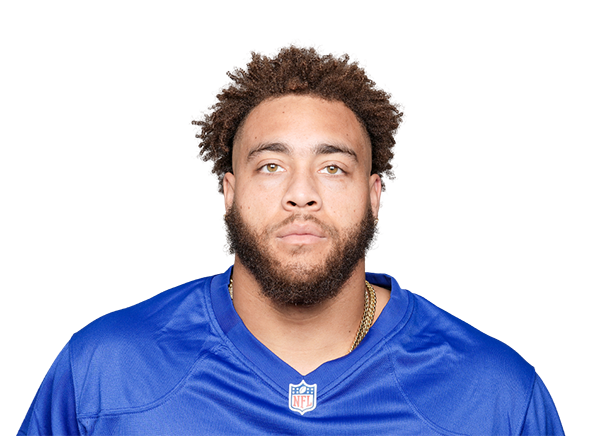 #64Aaron Stinniefor Francis Mauigoa (Injured Reserve)Next up
- RT
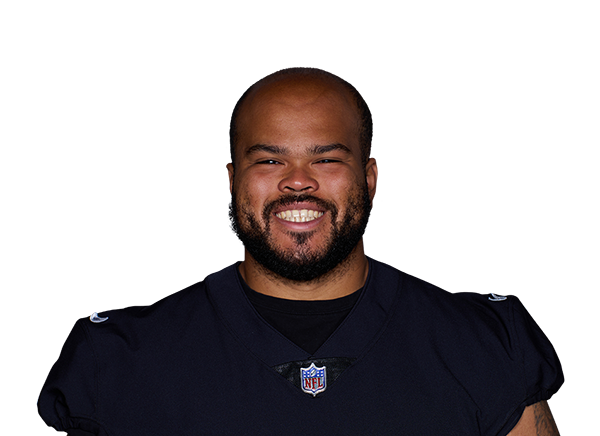 #72Jermaine Eluemunor


Context
Rest & travel, all 32 →Travel & rest
Travel & rest boardAway49ersLast: Sun wk 12 vs SEA · 21,378 mi flown this season
HomeGiantsLast: Sun wk 12 at IND · Indianapolis · 8,311 mi flown this season
After trips over 1,500 miles: 15-18 (33 games). Early body-clock kickoffs: 8-10 (18 games). All travel splits →
 CLE
 DET
 JAX
 CHI
 TB
 BUF
 CAR
 PIT