Bills earned it: the snaps said Bills by 2.8, a deserved win probability of 69%.
The swingQ4 8:13 · LV · +21 pts of win probability. (Shotgun) 8-K.Cousins pass short right to 1-T.Tucker for 11 yards, TOUCHDOWN.
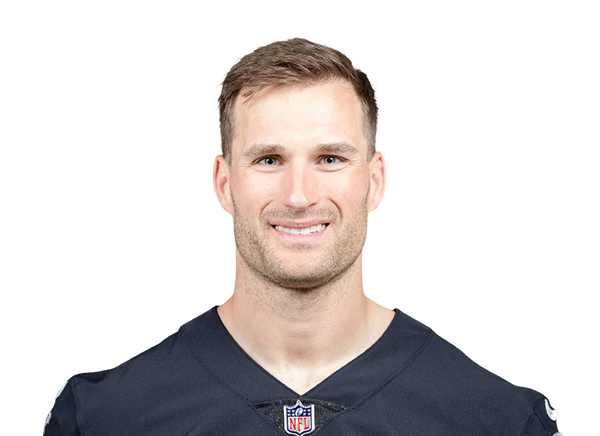
The Buffalo Bills beat the Las Vegas Raiders 33-30 on Sun, Oct 18 at Allegiant Stadium in Las Vegas, NV (Week 6, 2026 season). Records after the game: Bills 7-1, Raiders 4-5. K.Cousins (LV) led all players with +11.5 EPA on 41 dropbacks.
The Buffalo Bills won 33-30. By quarter: BUF 3-10-10-10, LV 7-6-0-17.
By expected points added: K.Cousins (LV, +11.5 EPA on 41 dropbacks), J.Allen (BUF, +10.2 EPA on 36 dropbacks) and T.Tucker (LV, +9.0 EPA on 7 targets).
The biggest swing in win probability (16 points toward the Raiders) came in Q4 at 8:07: (Shotgun) K.Cousins pass short right to T.Tucker for 11 yards, TOUCHDOWN. M.Gay extra point is GOOD, Center-A.Ward, Holder-A.Cole.
Pigskin Nightly, “Bills 33, Raiders 30: Week 6 recap”, https://pigskinnightly.com/games/2026-10-18-buf-at-lv (updated 2026-11-10).
Bills earned it: the snaps said Bills by 2.8, a deserved win probability of 69%.
The swingQ4 8:13 · LV · +21 pts of win probability. (Shotgun) 8-K.Cousins pass short right to 1-T.Tucker for 11 yards, TOUCHDOWN.
Deserved win probability from the snaps, fumble bounces evened out. How we judge
If the 47-yard kick had missed
Q3 9:50 16-T.Bass 47 yard field goal is GOOD, Center-69-R.Ferguson, Holder-39-T.Doman.
Hover, tap or drag along the river to read any play. Arrow keys work too. Click to jump to its drive.
| Passing | C/ATT | YDS | AVG | TD | INT | SACKS | QBR | RTG |
|---|---|---|---|---|---|---|---|---|
| Josh AllenQB | 23/33 | 255 | 7.7 | 2 | 0 | 2-13 | 67.3 | 112.6 |
| Rushing | CAR | YDS | AVG | TD | LONG |
|---|---|---|---|---|---|
| James Cook IIIRB | 22 | 95 | 4.3 | 1 | 13 |
| Ray DavisRB | 1 | 4 | 4.0 | 0 | 4 |
| Ty JohnsonRB | 1 | 3 | 3.0 | 0 | 3 |
| Josh AllenQB | 5 | 1 | 0.2 | 0 | 2 |
| Receiving | REC | TGTS | YDS | AVG | TD | LONG |
|---|---|---|---|---|---|---|
| Keon ColemanWR | 4 | 6 | 59 | 14.8 | 1 | 21 |
| James Cook IIIRB | 3 | 3 | 58 | 19.3 | 0 | 26 |
| Dalton KincaidTE | 7 | 8 | 38 | 5.4 | 0 | 14 |
| Joshua PalmerWR | 1 | 2 | 37 | 37.0 | 0 | 37 |
| Khalil ShakirWR | 4 | 6 | 34 | 8.5 | 1 | 16 |
| Ty JohnsonRB | 2 | 2 | 24 | 12.0 | 0 | 14 |
| Ray DavisRB | 1 | 1 | 5 | 5.0 | 0 | 5 |
| Dawson KnoxTE | 1 | 1 | 0 | 0.0 | 0 | 0 |
| Skyler BellWR | 0 | 1 | 0 | 0.0 | 0 | 0 |
| Defense | TOT | SOLO | SACKS | TFL | PD | QB HTS |
|---|---|---|---|---|---|---|
| Terrel BernardLB | 9 | 5 | 0 | 0 | 0 | 0 |
| Cole BishopS | 7 | 3 | 0 | 0 | 2 | 0 |
| Damar HamlinS | 6 | 3 | 0 | 0 | 0 | 0 |
| Dorian WilliamsLB | 5 | 3 | 0 | 0 | 1 | 0 |
| TJ ParkerLB | 5 | 0 | 0 | 0 | 0 | 1 |
| Deone WalkerDT | 4 | 2 | 0 | 1 | 0 | 1 |
| Greg GainesDT | 3 | 1 | 0 | 1 | 0 | 0 |
| DeWayne CarterDT | 3 | 1 | 0 | 0 | 0 | 0 |
| Sam Franklin Jr.S | 3 | 0 | 0 | 0 | 0 | 0 |
| Joe AndreessenLB | 2 | 2 | 0 | 0 | 0 | 0 |
| Kicking | FG | PCT | LONG | XP | PTS |
|---|---|---|---|---|---|
| Tyler BassPK | 4/4 | 100.0 | 47 | 3/3 | 15 |
| Passing | C/ATT | YDS | AVG | TD | INT | SACKS | QBR | RTG |
|---|---|---|---|---|---|---|---|---|
| Kirk CousinsQB | 23/41 | 313 | 7.6 | 2 | 1 | 0-0 | 64.3 | 86.7 |
| Rushing | CAR | YDS | AVG | TD | LONG |
|---|---|---|---|---|---|
| Mike Washington Jr.RB | 9 | 43 | 4.8 | 0 | 18 |
| Ashton JeantyRB | 10 | 22 | 2.2 | 1 | 8 |
| Dylan LaubeRB | 1 | 0 | 0.0 | 0 | 0 |
| Receiving | REC | TGTS | YDS | AVG | TD | LONG |
|---|---|---|---|---|---|---|
| Tre TuckerWR | 5 | 7 | 97 | 19.4 | 2 | 44 |
| Michael MayerTE | 7 | 9 | 95 | 13.6 | 0 | 28 |
| Brock BowersTE | 4 | 9 | 70 | 17.5 | 0 | 29 |
| Ashton JeantyRB | 4 | 6 | 36 | 9.0 | 0 | 15 |
| Jalen NailorWR | 1 | 4 | 9 | 9.0 | 0 | 9 |
| Mike Washington Jr.RB | 1 | 1 | 7 | 7.0 | 0 | 7 |
| Cody WhiteWR | 0 | 2 | 0 | 0.0 | 0 | 0 |
| Dylan LaubeRB | 1 | 1 | -1 | -1.0 | 0 | -1 |
| Defense | TOT | SOLO | SACKS | TFL | PD | QB HTS |
|---|---|---|---|---|---|---|
| Nakobe DeanLB | 12 | 3 | 0 | 1 | 0 | 0 |
| Jeremy ChinnS | 10 | 9 | 0 | 0 | 0 | 1 |
| Treydan StukesS | 9 | 5 | 0 | 0 | 1 | 0 |
| Quay WalkerLB | 6 | 3 | 1 | 1 | 0 | 1 |
| Maxx CrosbyDE | 5 | 2 | 0 | 1 | 0 | 2 |
| Taron JohnsonCB | 4 | 2 | 0 | 0 | 0 | 0 |
| Eric StokesCB | 3 | 2 | 0 | 0 | 1 | 0 |
| Isaiah Pola-MaoS | 3 | 2 | 0 | 0 | 0 | 0 |
| Kwity PayeDE | 3 | 1 | 1 | 1 | 0 | 1 |
| Thomas Booker IVDT | 2 | 2 | 0 | 0 | 0 | 0 |
| Kicking | FG | PCT | LONG | XP | PTS |
|---|---|---|---|---|---|
| Matt GayPK | 3/3 | 100.0 | 35 | 3/3 | 12 |
The Bills' big-play offense ranks 1st in explosive-play rate (16.7%, 293 plays) against a Raiders defense against big plays ranked 28th (11.5% allowed, 305 plays faced).
1stBUF offense27 spots apart28thLV defenseThe Bills' dropback offense ranks 2nd in EPA per dropback (+0.34, 167 dropbacks) against a Raiders pass defense ranked 22nd (+0.10 allowed, 185 dropbacks faced).
2ndBUF offense20 spots apart22ndLV defenseThe Bills' third-down offense ranks 1st in third-down conversion rate (52.9%, 51 third downs) against a Raiders third-down defense ranked 21st (42.9% allowed, 63 third downs faced).
1stBUF offense20 spots apart21stLV defenseDropbacks include sacks and scrambles; rushes are designed runs. What EPA measures.
Conversions are third-down snaps that gained a first down or scored.
A trip is a drive with at least one snap inside the opponent's 20; the rate is trips that ended in an offensive touchdown. Small samples swing fast here.
Completions of 20+ yards and runs of 10+, per snap. Definition.
Sacks per dropback. The public play-by-play has no pressure charting, so this is the sack side of it only.
Interceptions and lost fumbles on offensive snaps, per game. Turnover rates are among the least stable numbers in football.
Sample: BUF 5 games, 293 offensive and 350 defensive plays · LV 5 games, 317 offensive and 305 defensive plays. Rank 1 is the best offense or the best defense in each stat. Keys are the largest rank gaps (12+ spots) between an offense and the defense it faces, one per stat. Ranks are not schedule-adjusted.
Confirmed from the official snap counts: at every position group the starters are the snap leaders. Expected lineup = today's depth chart, adjusted for the injury report.
K Tyler Bass ✓P Tommy Doman Jr. ✓LS Reid Ferguson ✓
Last: Mon wk 5 at LAR (W 37-34) · Inglewood · 12,423 mi flown this season
Last: Sun wk 5 at NE (L 17-45) · Foxborough · 13,441 mi flown this season
Teams with more rest than their opponent are 34-12 in 2026 (46 games). After trips over 1,500 miles: 15-18 (33 games). All travel splits →