InjuryPuka Nacua: Doubtful → Questionable3 min ago
 InjuryChristian Darrisaw: Active → Cleared3 min ago
 Pro Football RumorsPanthers CB Michael Jackson, RB Jonathon Brooks Return To Practice
 Denver BroncosRanking the Broncos' top 3 games from before the bye
 Pittsburgh SteelersDick Hoak, 5-time champion, 86
 InjuryBryce Boettcher: Active → Cleared21 min ago
 ESPNTitans' Calvin Ridley addresses incident with valet at Nashville airport
 ESPNBengals' Zac Taylor apologizes for failed trade with Eagles: 'It was on our end'
 New Orleans SaintsNew Orleans Saints announce Dr. W. Stephen Choate as team nominee for 2026 NFL Salute to Service Award
 Kansas City ChiefsChris Jones Earns AFC "Defensive Player of the Week" Honors
 InjuryJosh Jacobs: Questionable → Out1 h ago
 Arizona CardinalsCardinals Open Up Practice Window For Zach Carter, Hunter Long
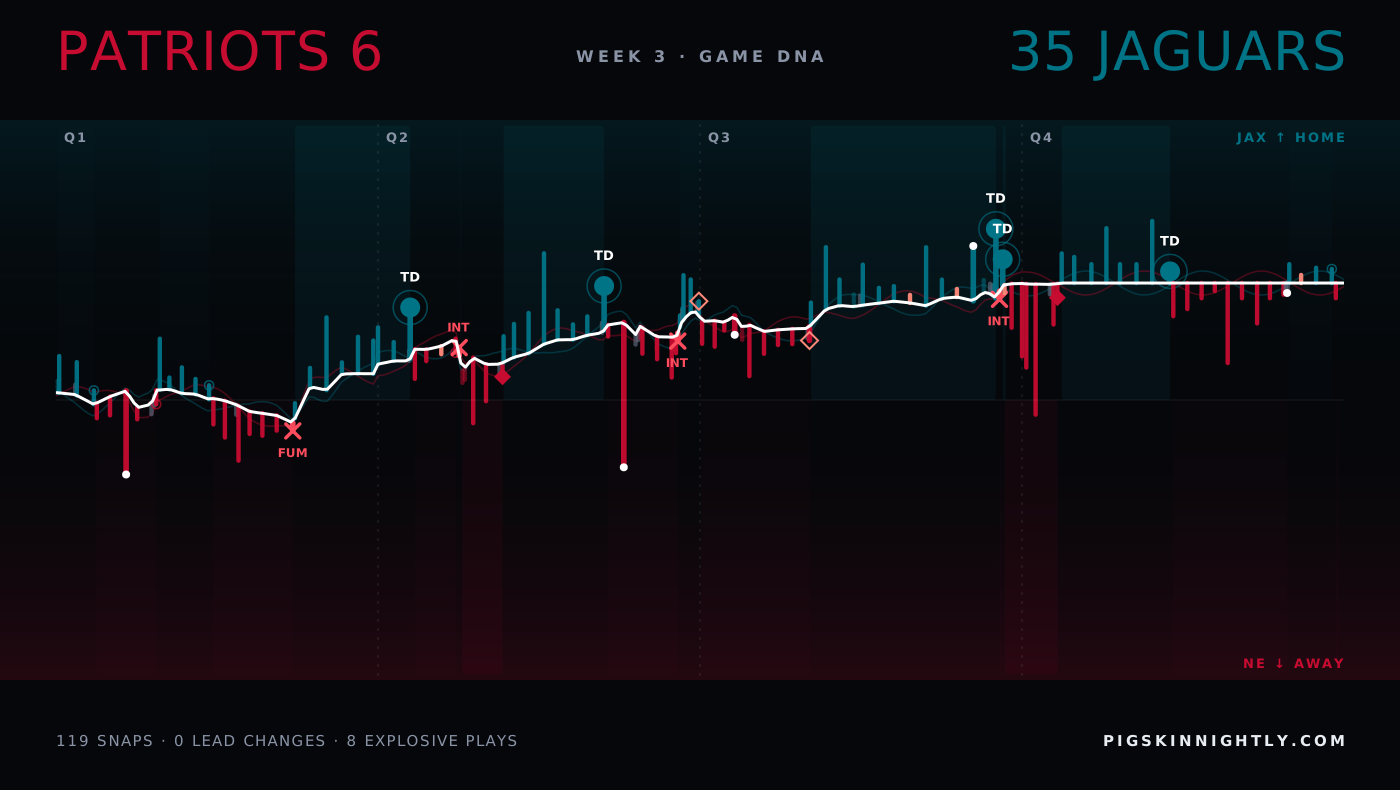
Week 3 · 2026Patriots 6 · 35 Jaguars
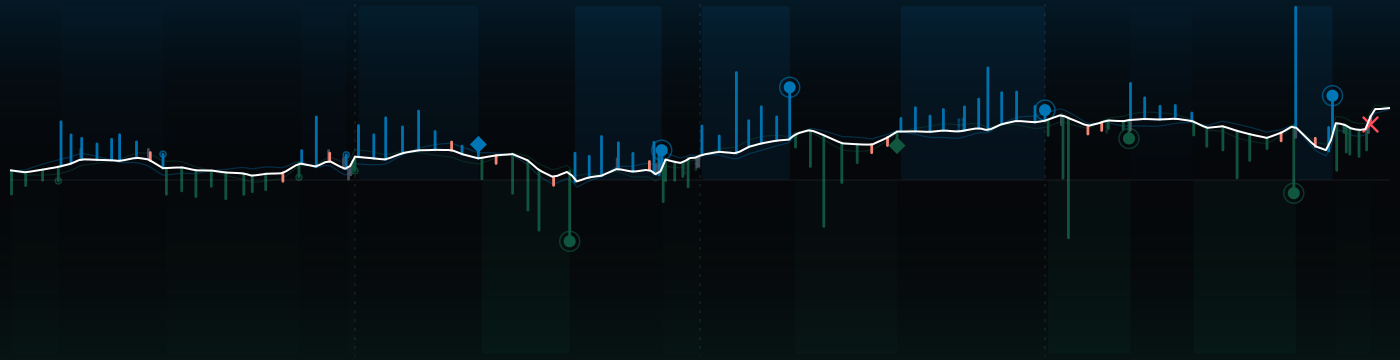
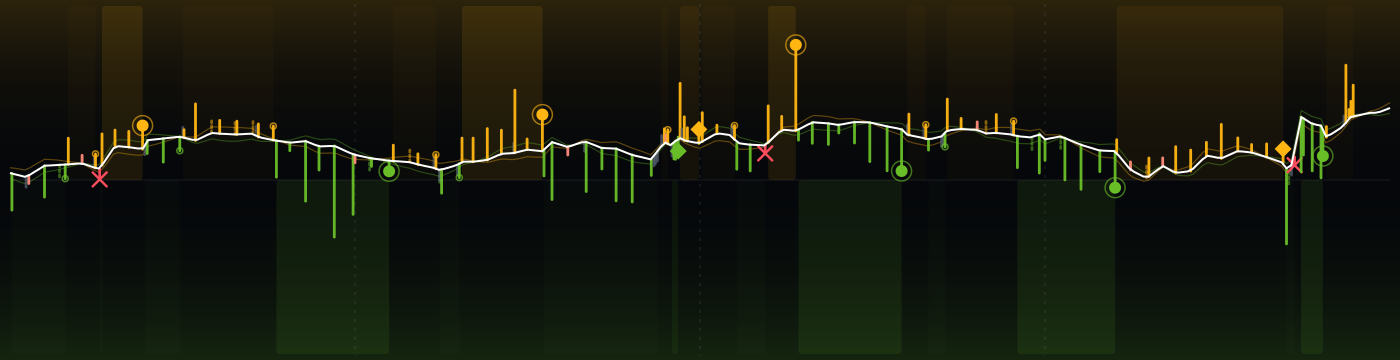
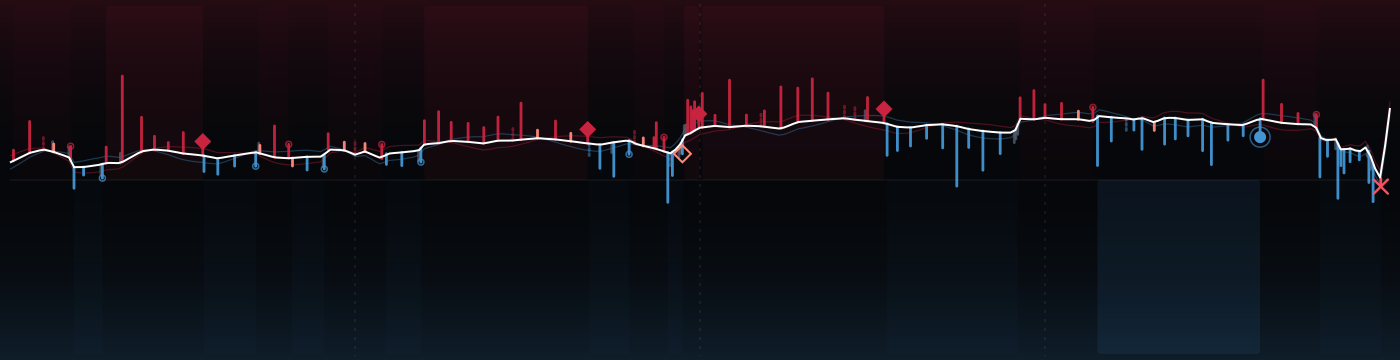
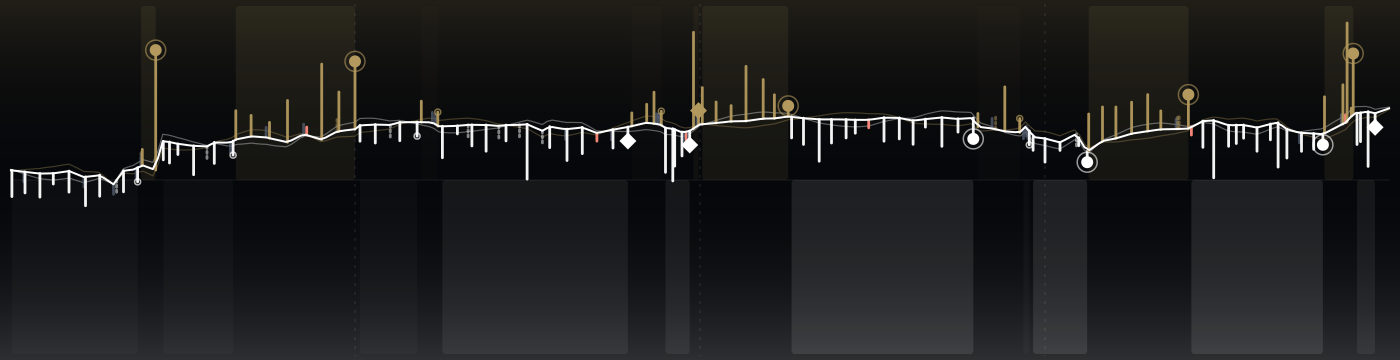
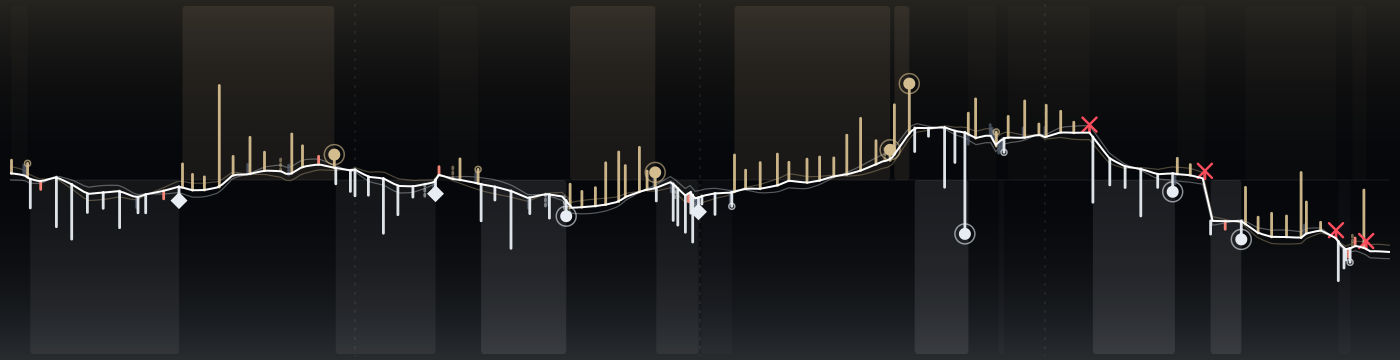
139 plays, one strand. Jaguars won without the lead ever changing hands; Patriots peaked at 60% to win, Jaguars at 100%. The white spine is the win probability, every rung a snap: up for JAX, down for NE, as long as the yards it gained.
↳Bottom lineThe lead never changed hands; Patriots peaked at 60% to win, Jaguars at 100%.
?How to read this chart
- Read it left to right:
- kickoff on the left, final whistle on the right.
- The white line
- is the chance that Jaguars win, play by play. High = JAX in control, low = NE in control, the middle is a coin flip. Each crossing of the middle is a change in who was more likely to win.
- Each little bar is one play:
- up for JAX on offense, down for NE; the longer the bar, the more yards. The key under the picture explains the marks (touchdown, turnover, field goal, punt).
 Jaguars ↑
 Patriots ↓
The strands compared
?How to read this chart
- Each row compares the two teams
- on one stat: NE on the left, JAX on the right. The longer bar is the bigger number.
- Explosive plays
- are long gains (big runs and passes). Peak win prob. is the highest chance to win each team reached at any moment.
Every possession
?How to read this chart
- Each tile is one possession,
- in game order, colored by the team that had the ball.
- Inside:
- the team, how it ended (TD = touchdown, FG = field goal, INT = interception, FUM = fumble, otherwise punt or downs) and the yards gained. Brighter tiles are drives that scored.
The plays that moved it most
↳Bottom lineThe biggest swing: play 1, 5.8 expected points against Patriots.
?How to read this chart
- The strip is the game clock;
- each numbered dot is one of the plays below, placed when it happened and colored by the team on offense.
- EP (expected points)
- is how many points the play added to (+) or took away from (−) the offense's expected score. +3.5 EP is worth more than a field goal; big minus numbers are usually turnovers.
- 1Q1 3:58 · NE · Fumble lost−5.8 EP
10-D.Maye sacked at JAX 42 for -7 yards. FUMBLES, RECOVERED by JAX-52-D.Hamilton at JAX 38.
- 2Q2 11:13 · JAX · Interception−5.4 EP
16-T.Lawrence pass short middle intended for 85-B.Strange INTERCEPTED by 25-M.Jones (23-J.Reed) at JAX 33. 25-M.Jones to JAX 21 for 12 yards
- 3Q2 1:02 · NE · Interception−4.5 EP
10-D.Maye pass short right intended for 86-E.Chism INTERCEPTED by 12-T.Hunter [23-F.Oluokun] at JAX -9. Touchback.
- 4Q3 13:23 · NE · Run+3.6 EP
38-R.Stevenson up the middle to 50 for 3 yards (47-D.Gardeck). PENALTY on JAX-6-A.Johnson, Unnecessary Roughness, 15 yards, enforced at 50.
- 5Q3 9:54 · NE · Missed field goal−4.0 EP
8-A.Borregales 38 yard field goal is No Good, Wide Right, Center-47-J.Ashby, Holder-19-M.Wishnowsky.
- 6Q3 2:16 · JAX · Completion+2.9 EP
16-T.Lawrence pass short right to 3-J.Meyers to NE 5 for 13 yards (7-C.Davis). PENALTY on NE-7-C.Davis, Face Mask, 3 yards, enforced at NE 5
- 7Q3 1:13 · JAX · Touchdown+3.9 EP
16-T.Lawrence pass deep left to 11-P.Washington for 17 yards, TOUCHDOWN. Penalty on NE-25-M.Jones, Defensive Pass Interference, declined.
- 8Q3 1:03 · NE · Interception−7.1 EP
10-D.Maye pass short left intended for 18-K.Williams INTERCEPTED by 4-J.Jones at NE 36. 4-J.Jones pushed ob at NE 5 for 31 yards (10-D.Maye)
The one play that could have changed it
?How to read this chart
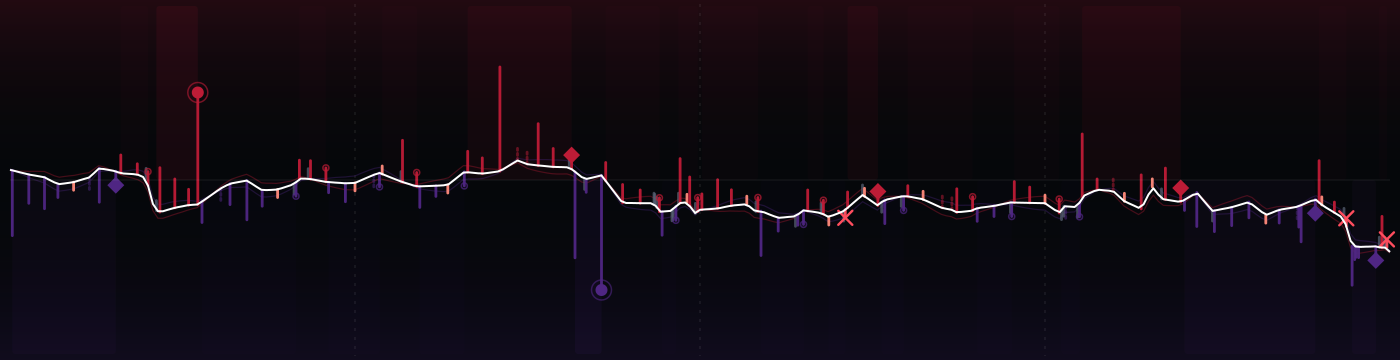
- The line is win probability
- over the game (top = home team ahead). The dot marks the one play that could have gone either way; the big % is the losing team's chance right after it.
- Press Flip it
- to see where that chance would have gone if the play had gone the other way. Only that instant is priced: the rest of the game never happened.
6@35Week 3Changes the winnerIf the Patriots had fallen on their own fumble
Q1 3:58 10-D.Maye sacked at JAX 42 for -7 yards. FUMBLES, RECOVERED by JAX-52-D.Hamilton at JAX 38.
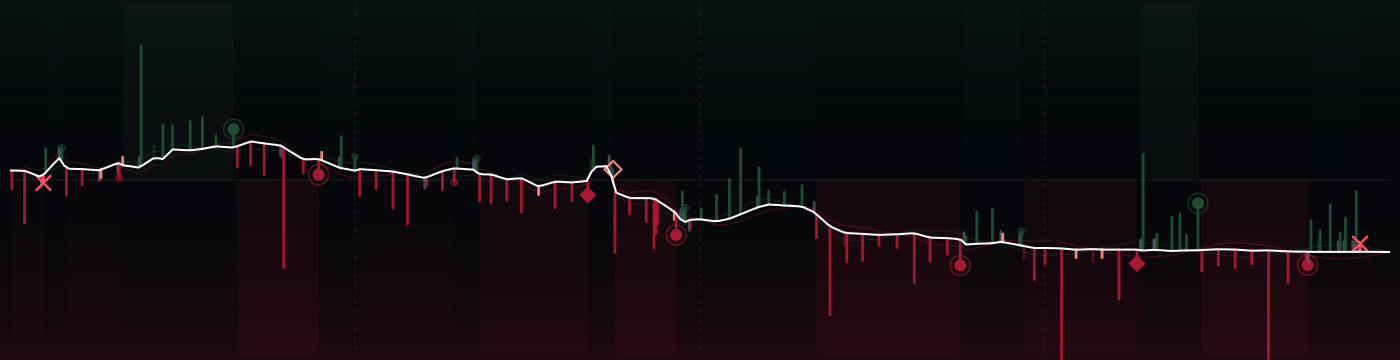
 35@14
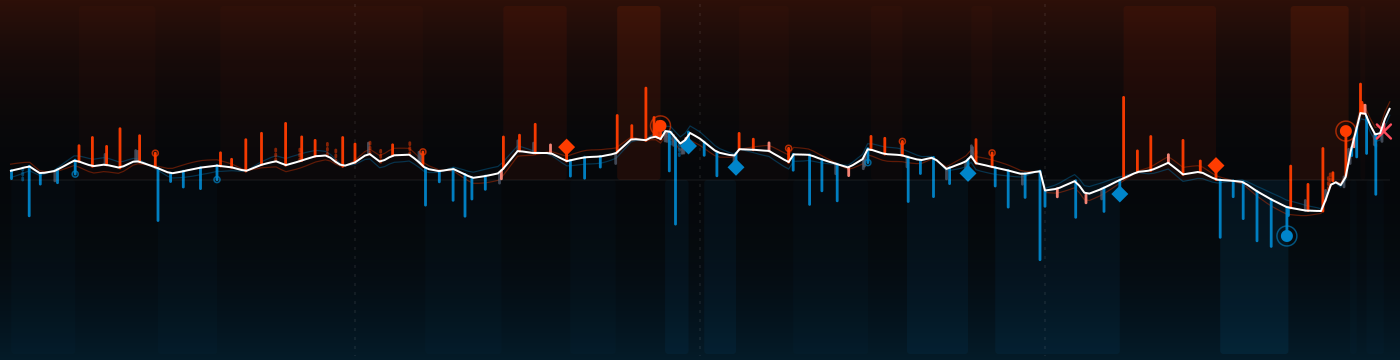

 27@30
 17@19

 16@24

 24@31

 31@33





 34@31

 35@27