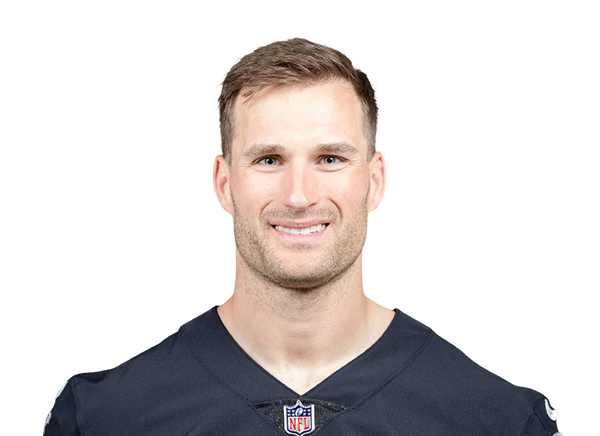
The Las Vegas Raiders beat the New York Jets 38-33 on Sun, Nov 1 at MetLife Stadium in East Rutherford, NJ (Week 8, 2026 season). Records after the game: Raiders 4-5, Jets 2-7. K.Cousins (LV) led all players with +16.4 EPA on 27 dropbacks.
Who won Raiders vs Jets?
The Las Vegas Raiders won 38-33. By quarter: LV 7-7-14-10, NYJ 6-17-7-3.
Who was the best player in Raiders vs Jets?
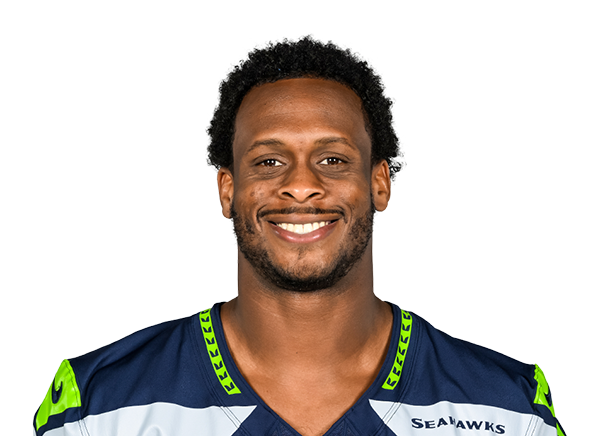
By expected points added: K.Cousins (LV, +16.4 EPA on 27 dropbacks), A.Mitchell (NYJ, +13.0 EPA on 9 targets) and G.Smith (NYJ, +11.8 EPA on 35 dropbacks).
What was the turning point of Raiders vs Jets?
The biggest swing in win probability (17 points toward the Jets) came in Q4 at 6:11: (Shotgun) G.Smith pass deep left to A.Mitchell to LV 13 for 47 yards (T.Stukes).
Jets played like a 3.1-point better team. A team that plays like that wins 71% of the time. Jets lost.
Deserved marginNYJ by 3.1
Real marginLV by 5
Luck pts LV−0.8
Luck pts NYJ−1.2
The swingQ4 6:11 · NYJ · +19 pts of win probability. (Shotgun) 7-G.Smith pass deep left to 15-A.Mitchell to LV 13 for 47 yards (31-T.Stukes).
Flags that moved this game
1Unnecessary RoughnessLV → helped NYJ · Wk 8 Q4 0:20 · (Shotgun) 7-G.Smith pass short left to 5-G.Wilson to 50 for 15 yards (11-J.Chinn). PENALTY on LV-11-J.Chinn, Unnecessary…+10.9 WP
2Defensive Pass InterferenceNYJ → helped LV · Wk 8 Q3 8:10 · (Shotgun) 8-K.Cousins pass incomplete deep middle to 1-T.Tucker. PENALTY on NYJ-2-J.Brownlee, Defensive Pass Interference, 11…+4.9 WP
Fourth downs our model disagreed with
1NYJ · 4th & 3Aaron Glenn chose Punt at own 42, Wk 8 Q3 1:40, up 2. Model: Go for it (lean). Result: punted.−0.52 EP
2NYJ · 4th & 2Aaron Glenn chose Field goal at opp 17, Wk 8 Q1 2:17, down 4. Model: Go for it (lean). Result: good.−0.26 EP
Deserved win probability from the snaps, fumble bounces evened out. How we judge
Hover, tap or drag along the river to read any play. Arrow keys work too. Click to jump to its drive.
NYJ ▲LV ▼
Q1Q2Q3Q4
The five biggest swings
+17%Q4 6:11 · for NYJ(Shotgun) G.Smith pass deep left to A.Mitchell to LV 13 for 47 yards (T.Stukes).
+17%Q2 10:44 · for LVA.McNamara kicks 60 yards from NYJ 35 to LV 5. D.Laube for 95 yards, TOUCHDOWN. M.Gay extra point is GOOD, Center-A.Ward, Holder-A.Cole.
+16%Q4 0:27 · for LVM.Gay 53 yard field goal is GOOD, Center-A.Ward, Holder-A.Cole.
+15%Q4 15:00 · for LV(Shotgun) K.Cousins pass short left to A.Jeanty to NYJ 13 for 45 yards (J.Sherwood; M.Fitzpatrick).
+13%Q2 6:18 · for NYJ(Shotgun) G.Smith pass short right to A.Mitchell for 12 yards, TOUCHDOWN. J.Sanders extra point is GOOD, Center-T.Hennessy, Holder-A.McNamara.
Every drive, on the field
NYJ attacks →← LV attacks
NYJLV102030405040302010
Q1 15:00FG7p · 62y · 2:10
Q1 12:50TD10p · 60y · 5:27
Q1 7:23FG12p · 48y · 5:10
Q1 2:13PUNT3p · -1y · 2:26
Q2 14:47TD8p · 70y · 3:51
Q2 10:56TD0p · 0y · 0:12
Q2 10:44TD8p · 65y · 4:26
Q2 6:18DOWNS5p · 24y · 2:29
Q2 3:49FG9p · 33y · 3:40
Q2 0:09HALF1p · -1y · 0:09
Q3 15:00TD10p · 65y · 5:01
Q3 9:59TD3p · 58y · 1:39
Q3 8:20TD10p · 65y · 4:06
Q3 4:14PUNT3p · 7y · 2:41
Q3 1:33TD9p · 84y · 5:00
Q4 11:33PUNT3p · 1y · 1:27
Q4 10:06PUNT3p · 6y · 0:57
Q4 9:09FG9p · 68y · 4:38
Q4 4:31FG9p · 30y · 4:04
Q4 0:27INT3p · 30y · 0:20
Q4 0:07END1p · -1y · 0:07
Raiders9 drives6scoring drives (5 TD)67%drives ending in pointsOWN 39avg starting field position2three-and-outs1turnovers incl. downs
Jets10 drives7scoring drives (3 TD)70%drives ending in pointsOWN 34avg starting field position2three-and-outs1turnovers incl. downs
Scoring summary
Q1 12:50Field goalJ.Sanders 21 yard field goal is GOOD, Center-T.Hennessy, Holder-A.McNamara.0–3
Q1 7:23Touchdown(Shotgun) K.Cousins pass short left to B.Bowers for 12 yards, TOUCHDOWN.Penalty on NYJ-J.Brownlee, Defensive Pass Interference, declined. M.Gay extra point is GOOD, Center-A.Ward, Holder-A.Cole.7–3
Q1 2:13Field goalJ.Sanders 36 yard field goal is GOOD, Center-T.Hennessy, Holder-A.McNamara.7–6
Q2 10:56Touchdown(Shotgun) G.Smith pass deep middle to I.Williams for 18 yards, TOUCHDOWN.Penalty on LV-J.McCoy, Defensive Holding, declined. J.Sanders extra point is GOOD, Center-T.Hennessy, Holder-A.McNamara.7–13
Q2 10:44TouchdownA.McNamara kicks 60 yards from NYJ 35 to LV 5. D.Laube for 95 yards, TOUCHDOWN. M.Gay extra point is GOOD, Center-A.Ward, Holder-A.Cole.14–13
Q2 6:18Touchdown(Shotgun) G.Smith pass short right to A.Mitchell for 12 yards, TOUCHDOWN. J.Sanders extra point is GOOD, Center-T.Hennessy, Holder-A.McNamara.14–20
Q2 0:09Field goalJ.Sanders 39 yard field goal is GOOD, Center-T.Hennessy, Holder-A.McNamara.14–23
Q3 9:59TouchdownK.Cousins pass short middle to B.Bowers for 2 yards, TOUCHDOWN. M.Gay extra point is GOOD, Center-A.Ward, Holder-A.Cole.21–23
Q3 8:20Touchdown(Shotgun) B.Allen left end for 21 yards, TOUCHDOWN. J.Sanders extra point is GOOD, Center-T.Hennessy, Holder-A.McNamara.21–30
Q3 4:14TouchdownC.Rogers reported in as eligible. K.Cousins up the middle for 1 yard, TOUCHDOWN.Penalty on NYJ-K.Enagbare, Defensive Offside, declined. M.Gay extra point is GOOD, Center-A.Ward, Holder-A.Cole.28–30
Q4 11:33Touchdown(Shotgun) K.Cousins pass short right to J.Nailor for 2 yards, TOUCHDOWN [N.Lynn]. M.Gay extra point is GOOD, Center-A.Ward, Holder-A.Cole.35–30
Q4 4:31Field goalJ.Sanders 31 yard field goal is GOOD, Center-T.Hennessy, Holder-A.McNamara.35–33
Q4 0:27Field goalM.Gay 53 yard field goal is GOOD, Center-A.Ward, Holder-A.Cole.38–33
A trip is a drive with at least one snap inside the opponent's 20; the rate is trips that ended in an offensive touchdown. Small samples swing fast here.
Completions of 20+ yards and runs of 10+, per snap. Definition.
Pressure & sacksEdge LV · +14 ranks
LV pass protectionsack rateNYJ pass rush
4th3.5% sacked284 dropbacks
7.6% of dropbacks250 dropbacks faced5th
NYJ pass protectionsack rateLV pass rush
29th8.8% sacked240 dropbacks
LV +14
6.4% of dropbacks251 dropbacks faced15th
Sacks per dropback. The public play-by-play has no pressure charting, so this is the sack side of it only.
TurnoversNo big edge
LV ball securityturnovers per gameNYJ takeaway defense
11th0.9 giveaways a game7 games
1.0 takeaways a game7 games16th
NYJ ball securityturnovers per gameLV takeaway defense
7th0.7 giveaways a game7 games
1.7 takeaways a game7 games2nd
Interceptions and lost fumbles on offensive snaps, per game. Turnover rates are among the least stable numbers in football.
Sample: LV 7 games, 444 offensive and 431 defensive plays · NYJ 7 games, 402 offensive and 441 defensive plays. Rank 1 is the best offense or the best defense in each stat. Keys are the largest rank gaps (12+ spots) between an offense and the defense it faces, one per stat. Ranks are not schedule-adjusted.
Confirmed from the official snap counts: at every position group the starters are the snap leaders. Expected lineup = today's depth chart, adjusted for the injury report.
Expected, did not startFernando MendozaQB→ Kirk CousinsConnor HeywardFB→ Mike Washington Jr.Folorunso FatukasiLDE→ Malcolm KoonceTonka HemingwayRDE→ Thomas Booker IVDarien PorterRCB→ Jermod McCoyBreece HallRB→ Braelon AllenDavid BaileyLDE→ Will McDonald IVTrevin WallaceSLB→ Harrison Phillips
 InjuryEric Wilson: Active → Cleared9 min ago
 Pro Football RumorsJets Work Out QBs Bailey Zappe, Austin Reed
 InjuryZach Allen: Active → Cleared1 h ago
 Pro Football RumorsCowboys Add RB Kendre Miller To Practice Squad
 ESPNHow Josh Downs fits with Patrick Mahomes and the Chiefs offense
 InjuryNathan Shepherd: Active → Cleared2 h ago
 Cincinnati BengalsInside The Drive | How Ja'Marr Chase Took Over Madrid
 Pro Football RumorsNFL Practice Squad Updates: 11/10/26
 ESPNRaiders name Fernando Mendoza starting QB after trading Kirk Cousins
 InjuryChristian Barmore: Active → Cleared3 h ago
 InjuryQuentin Lake: Active → Cleared3 h ago
 San Francisco 49ersPower Rankings: Where the 49ers Stand Entering Week 10
 ESPNGet ready for Chargers vs. Ravens on Monday Night Football
 ESPNJets 'stand pat' at NFL trade deadline




 CAR
 GB
 ARI
 ATL
 TB
 BUF
 PIT
 IND
 JAX
 DET
 TEN
 LAC
 PHI
 WSH
 CHI
 SEA