InjuryDJ Turner II: Active → Questionablejust now
 InjuryJustin Walley: Active → Outjust now
 InjuryElgton Jenkins: Active → Questionablejust now
 Pro Football RumorsRavens To Sign K Riley Patterson
 Pro Football RumorsSaints Designate RB Travis Etienne For Return; Cesar Ruiz Moving To C
 Las Vegas RaidersGame Preview: Klint Kubiak looking for Raiders offense to continue resurgence against Seahawks
 Buffalo Bills'The opportunity here is tremendous' | Amani Hooker reacts to his first day with the Bills
 Minnesota VikingsKevin O'Connell & Nolan Teasley Explain Process of Returning Kirk Cousins to Vikings
 New England PatriotsWeek 10 Injury Report: Patriots at Lions
 Houston TexansWeek 10 Injury Report | Texans at Browns
 Pittsburgh Steelers'I'm feeling good right now'
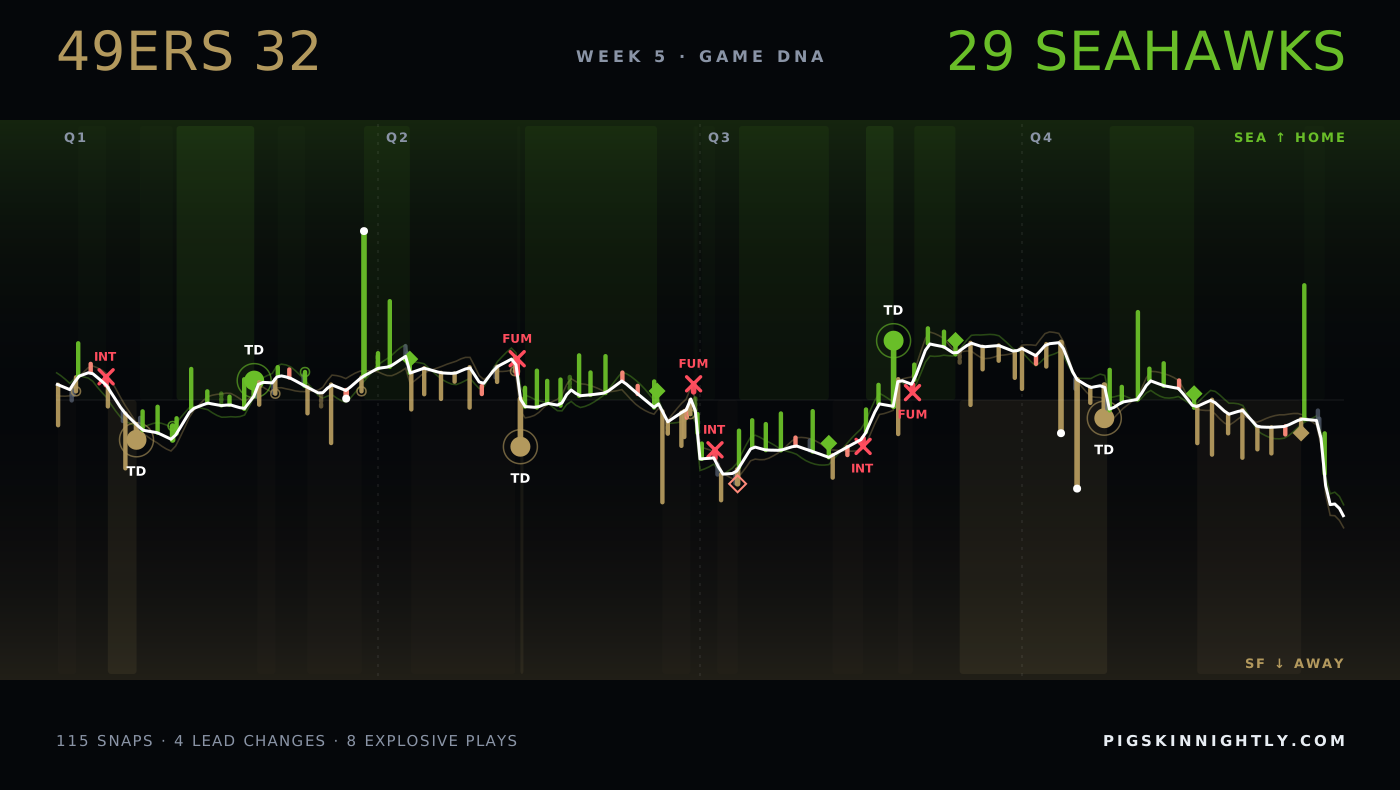
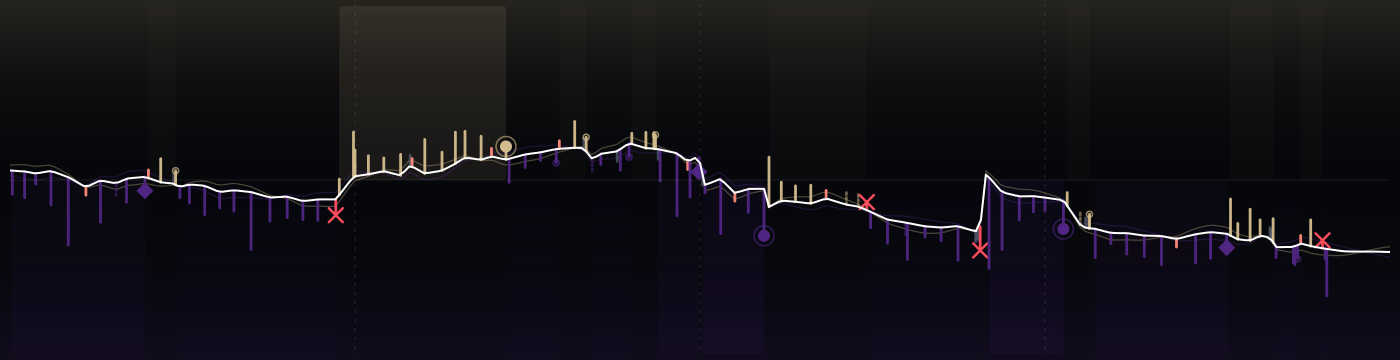
Week 5 · 202649ers 32 · 29 Seahawks
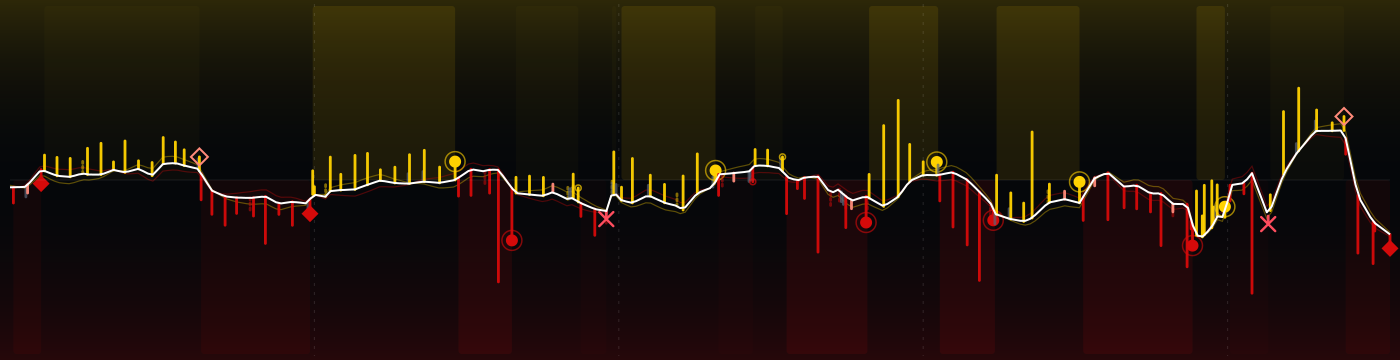
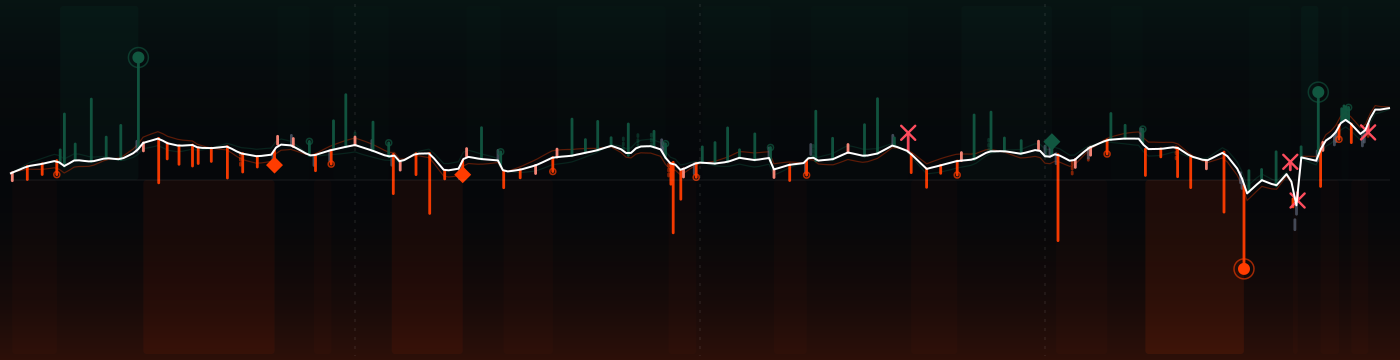
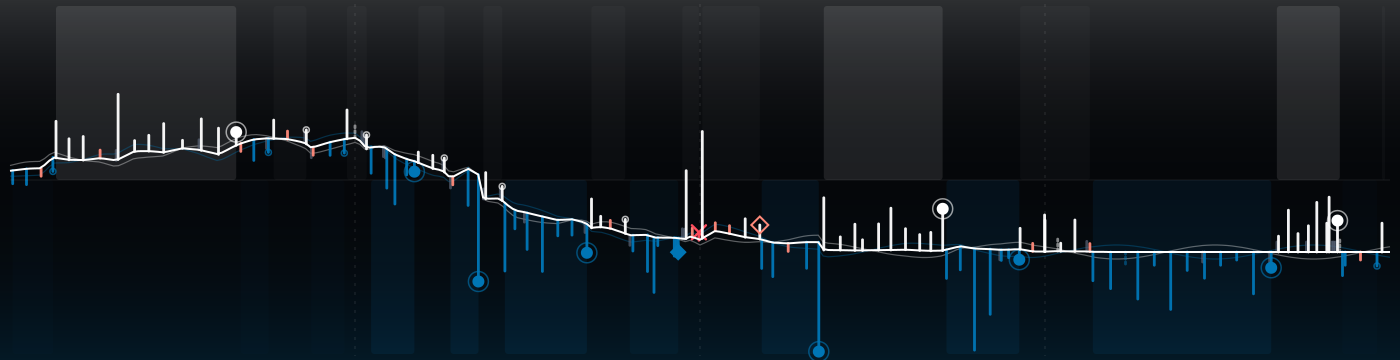
137 plays, one strand. 49ers won after 4 lead changes; 49ers peaked at 95% to win, Seahawks at 75%. The white spine is the win probability, every rung a snap: up for SEA, down for SF, as long as the yards it gained.
↳Bottom line4 lead changes; 49ers peaked at 95% to win, Seahawks at 75%.
?How to read this chart
- Read it left to right:
- kickoff on the left, final whistle on the right.
- The white line
- is the chance that Seahawks win, play by play. High = SEA in control, low = SF in control, the middle is a coin flip. Each crossing of the middle is a change in who was more likely to win.
- Each little bar is one play:
- up for SEA on offense, down for SF; the longer the bar, the more yards. The key under the picture explains the marks (touchdown, turnover, field goal, punt).
 Seahawks ↑
 49ers ↓
The strands compared
?How to read this chart
- Each row compares the two teams
- on one stat: SF on the left, SEA on the right. The longer bar is the bigger number.
- Explosive plays
- are long gains (big runs and passes). Peak win prob. is the highest chance to win each team reached at any moment.
Every possession
?How to read this chart
- Each tile is one possession,
- in game order, colored by the team that had the ball.
- Inside:
- the team, how it ended (TD = touchdown, FG = field goal, INT = interception, FUM = fumble, otherwise punt or downs) and the yards gained. Brighter tiles are drives that scored.
The plays that moved it most
↳Bottom lineThe biggest swing: play 1, 3.8 expected points against Seahawks.
?How to read this chart
- The strip is the game clock;
- each numbered dot is one of the plays below, placed when it happened and colored by the team on offense.
- EP (expected points)
- is how many points the play added to (+) or took away from (−) the offense's expected score. +3.5 EP is worth more than a field goal; big minus numbers are usually turnovers.
- 1Q1 12:40 · SEA · Interception−3.8 EP
14-S.Darnold pass short right intended for 11-J.Smith-Njigba INTERCEPTED by 0-R.Green at SEA 18. 0-R.Green to SEA 18 for no gain (11-J.Smith
- 2Q1 9:34 · SEA · Punt+5.7 EP
4-M.Dickson punts 39 yards to SF 35, Center-41-C.Stoll. 4-J.Cowing MUFFS catch, touched at SF 33, RECOVERED by SEA-81-E.Saubert at SF 24.
- 3Q2 8:31 · SEA · Fumble lost−5.1 EP
23-E.Wilson right end to SEA 11 for 2 yards (54-F.Warner). FUMBLES (54-F.Warner), RECOVERED by SF-6-M.Mustapha at SEA 12. 6-M.Mustapha to SE
- 4Q2 0:18 · SEA · Fumble lost−6.9 EP
36-G.Holani left guard to SEA 0 for -4 yards (93-G.Halton). FUMBLES (93-G.Halton), touched at SEA 0, RECOVERED by SF-93-G.Halton at SEA -4.
- 5Q3 14:18 · SEA · Interception−5.1 EP
14-S.Darnold pass deep left intended for 18-E.Arroyo INTERCEPTED by 0-R.Green at SF 44. 0-R.Green to SF 46 for 2 yards (18-E.Arroyo). PENALT
- 6Q3 13:15 · SF · Missed field goal−3.7 EP
18-E.Pineiro 52 yard field goal is No Good, Wide Left, Center-46-J.Weeks, Holder-15-C.Waitman.
- 7Q3 7:24 · SF · Interception−5.1 EP
13-B.Purdy pass short left intended for 4-J.Cowing INTERCEPTED by 28-N.Pritchett at SF 43. 28-N.Pritchett pushed ob at SF 23 for 20 yards (7
- 8Q3 5:06 · SF · Fumble lost−5.2 EP
19-D.Samuel left end to SF 35 for no gain (32-D.Thomas). FUMBLES (32-D.Thomas), RECOVERED by SEA-29-J.Jobe at SF 36. SF-19-D.Samuel was inju
The one play that could have changed it
?How to read this chart
- The line is win probability
- over the game (top = home team ahead). The dot marks the one play that could have gone either way; the big % is the losing team's chance right after it.
- Press Flip it
- to see where that chance would have gone if the play had gone the other way. Only that instant is priced: the rest of the game never happened.
32@29Week 5Changes the winnerIf the Seahawks had converted that fourth-and-10
Q4 0:54 14-S.Darnold pass short left to 10-C.Kupp pushed ob at SF 41 for 9 yards (6-M.Mustapha). The Replay Official reviewed the short of the line to gain ruling, and the play was Upheld. The ruling on the field stands.
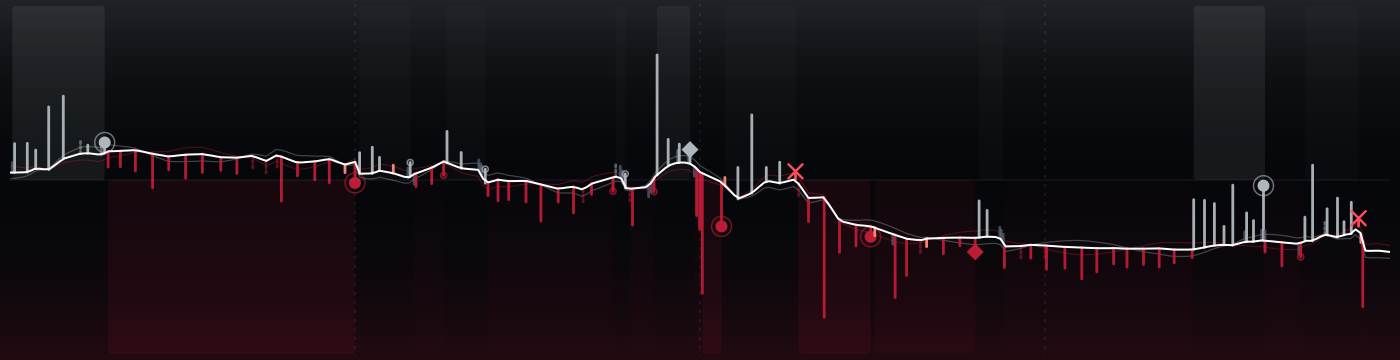
 24@16


 17@19

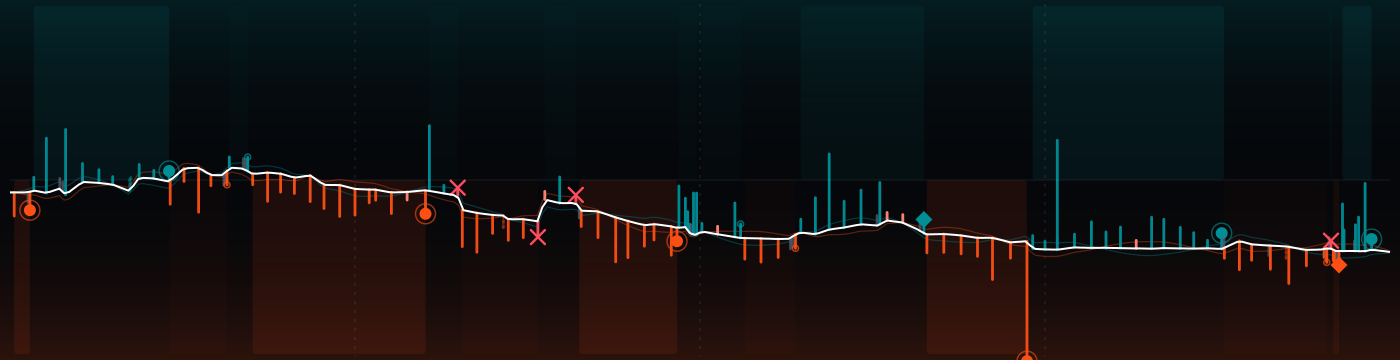



 27@27

 7@31

 23@17

 45@21