Detroit LionsNFC NORTH: Where all four teams stand heading into Week 10
 ESPNQuestions on 2026 NFL trade deadline deals: Does Kirk Cousins lift the Vikings?
 ESPNNFL Week 10 latest intel, buzz questions, fantasy tips, post-trade deadline news
 ESPNCowboys rave about Quinnen Williams a year after trade deadline deal
 ESPNBig plays by Broncos defense in late-game situations keying Denver's 7-2 start
 ESPNThe Philadelphia Eagles' 2026 trade haul is likely to age well over time
 ESPNWhere does Cam Ward stand coming out of the bye?
 Pro Football RumorsCardinals Work Out QBs Cooper Rush, Trevor Siemian
 ESPNWhy Giants' trade attempts 'just didn't happen'
 ESPNChiefs add WR Josh Downs at NFL trade deadline
 Pro Football RumorsJets Work Out QBs Bailey Zappe, Austin Reed
 InjuryNathan Shepherd: Active → Cleared10 h ago
 InjuryQuentin Lake: Active → Cleared11 h ago
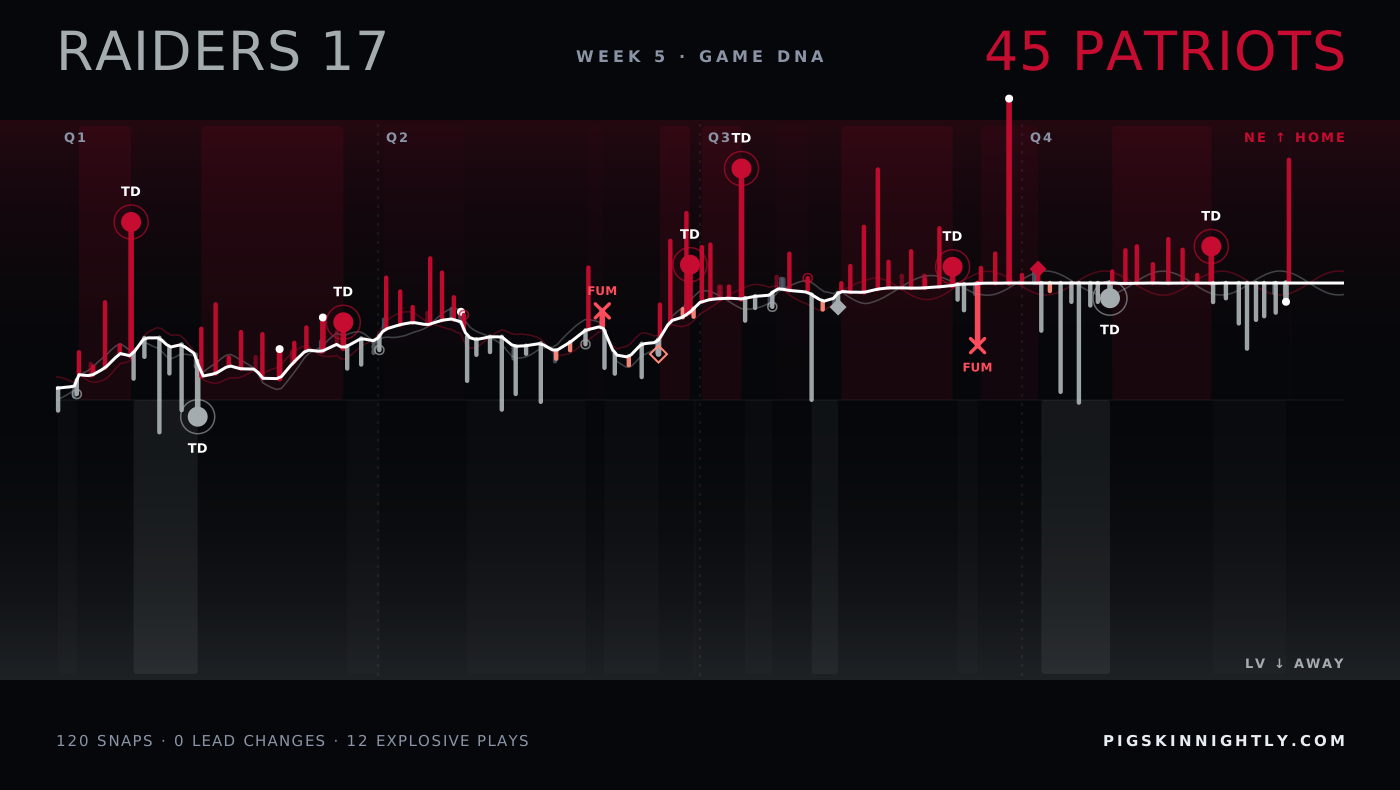
Week 5 · 2026Raiders 17 · 45 Patriots
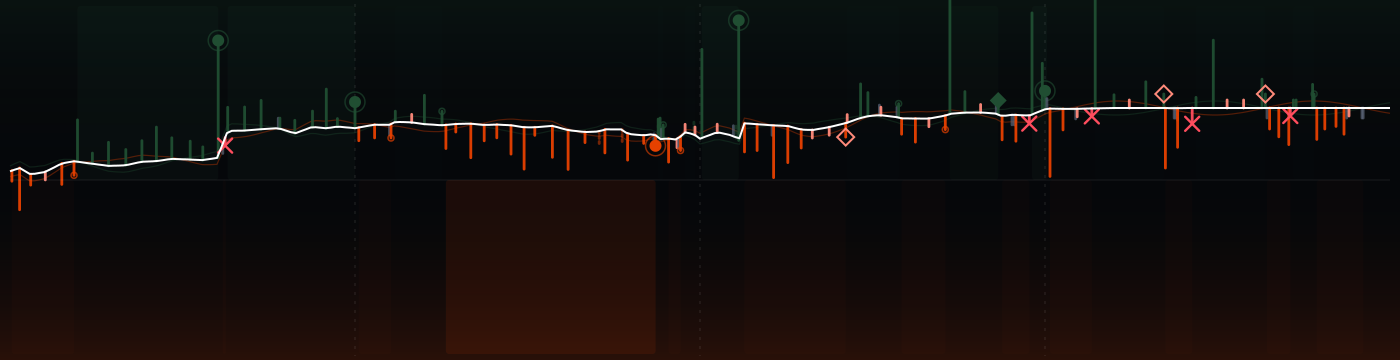
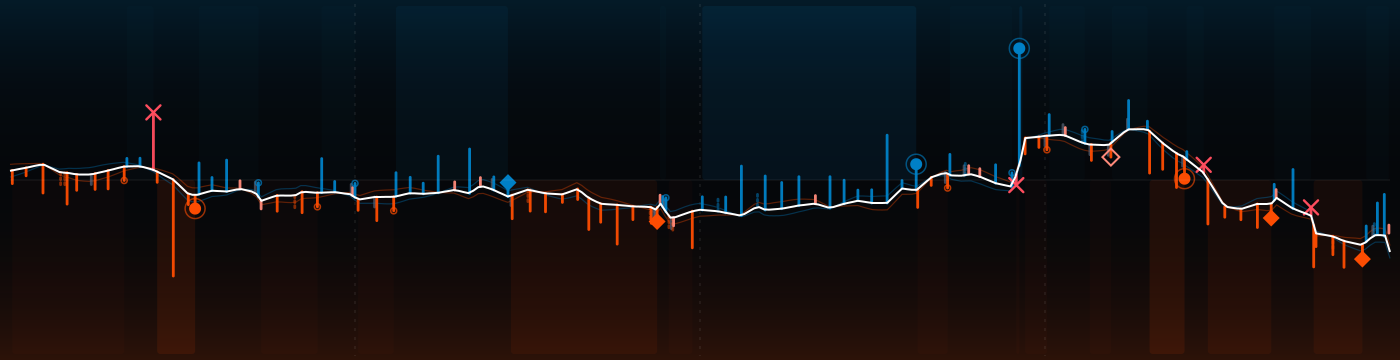
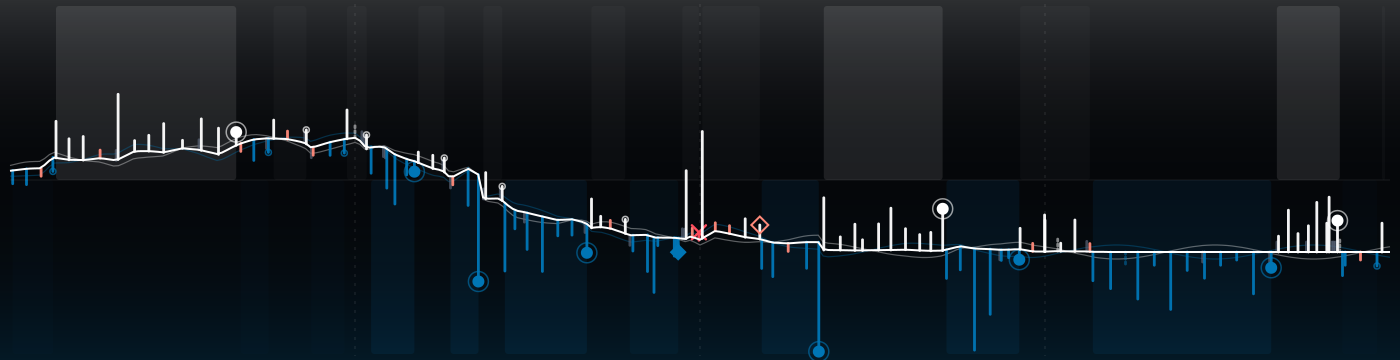
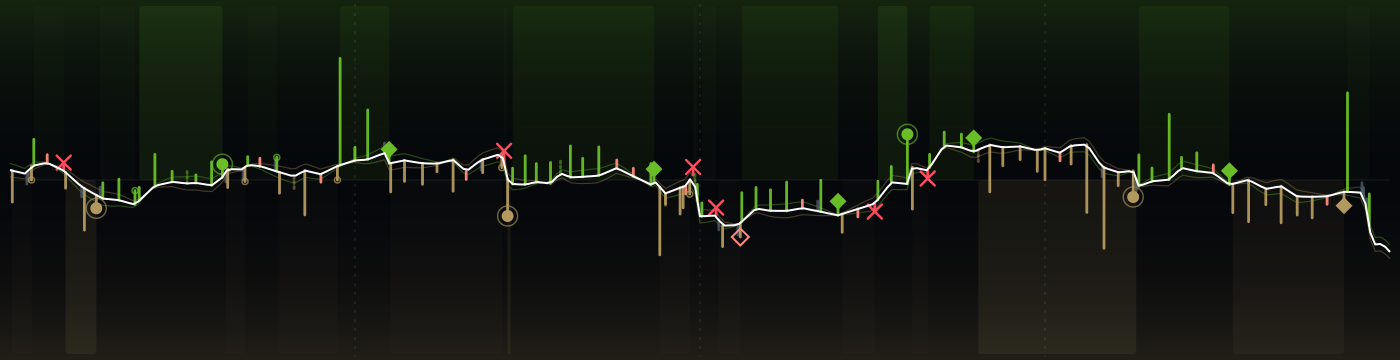
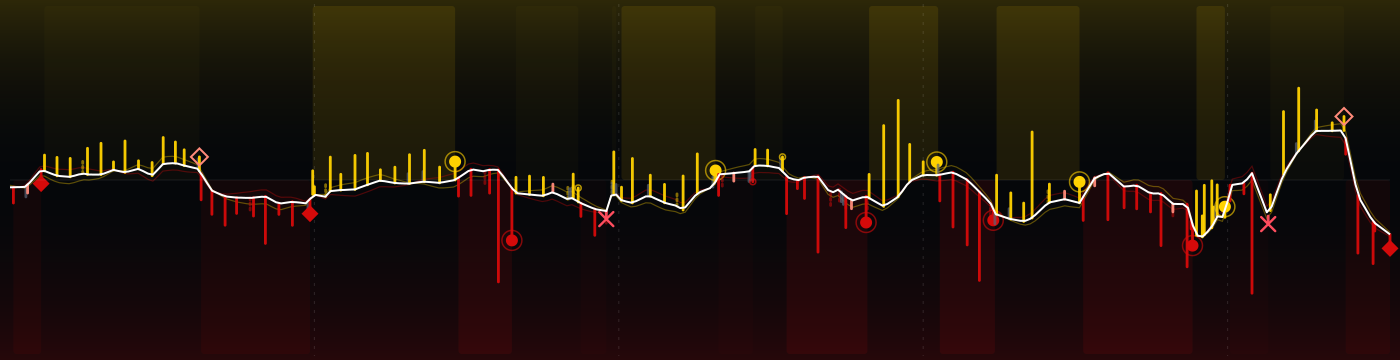
143 plays, one strand. Patriots won without the lead ever changing hands; Raiders peaked at 45% to win, Patriots at 100%. The white spine is the win probability, every rung a snap: up for NE, down for LV, as long as the yards it gained.
↳Bottom lineThe lead never changed hands; Raiders peaked at 45% to win, Patriots at 100%.
?How to read this chart
- Read it left to right:
- kickoff on the left, final whistle on the right.
- The white line
- is the chance that Patriots win, play by play. High = NE in control, low = LV in control, the middle is a coin flip. Each crossing of the middle is a change in who was more likely to win.
- Each little bar is one play:
- up for NE on offense, down for LV; the longer the bar, the more yards. The key under the picture explains the marks (touchdown, turnover, field goal, punt).
 Patriots ↑
 Raiders ↓
The strands compared
?How to read this chart
- Each row compares the two teams
- on one stat: LV on the left, NE on the right. The longer bar is the bigger number.
- Explosive plays
- are long gains (big runs and passes). Peak win prob. is the highest chance to win each team reached at any moment.
Every possession
?How to read this chart
- Each tile is one possession,
- in game order, colored by the team that had the ball.
- Inside:
- the team, how it ended (TD = touchdown, FG = field goal, INT = interception, FUM = fumble, otherwise punt or downs) and the yards gained. Brighter tiles are drives that scored.
The plays that moved it most
↳Bottom lineThe biggest swing: play 1, 3.6 expected points for Patriots.
?How to read this chart
- The strip is the game clock;
- each numbered dot is one of the plays below, placed when it happened and colored by the team on offense.
- EP (expected points)
- is how many points the play added to (+) or took away from (−) the offense's expected score. +3.5 EP is worth more than a field goal; big minus numbers are usually turnovers.
- 1Q1 11:30 · NE · Touchdown+3.6 EP
10-D.Maye pass deep right to 3-D.Douglas for 35 yards, TOUCHDOWN.
- 2Q1 4:35 · NE · Completion+2.9 EP
10-D.Maye pass short right to 3-D.Douglas pushed ob at LV 42 for 6 yards (3-T.Johnson).
- 3Q1 2:34 · NE · Completion+3.5 EP
10-D.Maye pass short middle to 85-H.Henry to LV 1 for 7 yards (31-T.Stukes).
- 4Q2 4:33 · NE · Fumble lost−4.6 EP
9-C.Kiner up the middle to NE 37 for 2 yards (69-A.Butler). FUMBLES (69-A.Butler), touched at NE 39, RECOVERED by LV-26-D.Porter at NE 38. P
- 5Q2 1:56 · LV · Missed field goal−3.2 EP
14-M.Gay 49 yard field goal is No Good, Hit Left Upright, Center-47-A.Ward, Holder-6-A.Cole.
- 6Q3 13:04 · NE · Touchdown+4.1 EP
10-D.Maye pass deep left to 18-K.Williams for 34 yards, TOUCHDOWN.
- 7Q3 0:36 · NE · Completion+3.6 EP
10-D.Maye pass deep right to 18-K.Williams to LV 9 for 49 yards (26-D.Porter).
- 8Q4 2:42 · LV · Run−2.9 EP
15-F.Mendoza scrambles right end pushed ob at NE 11 for 3 yards (33-M.Brown).
The one play that could have changed it
?How to read this chart
- The line is win probability
- over the game (top = home team ahead). The dot marks the one play that could have gone either way; the big % is the losing team's chance right after it.
- Press Flip it
- to see where that chance would have gone if the play had gone the other way. Only that instant is priced: the rest of the game never happened.
17@45Week 5Changes the winnerIf the Raiders had stopped that fourth-and-2
Q1 4:35 10-D.Maye pass short right to 3-D.Douglas pushed ob at LV 42 for 6 yards (3-T.Johnson).
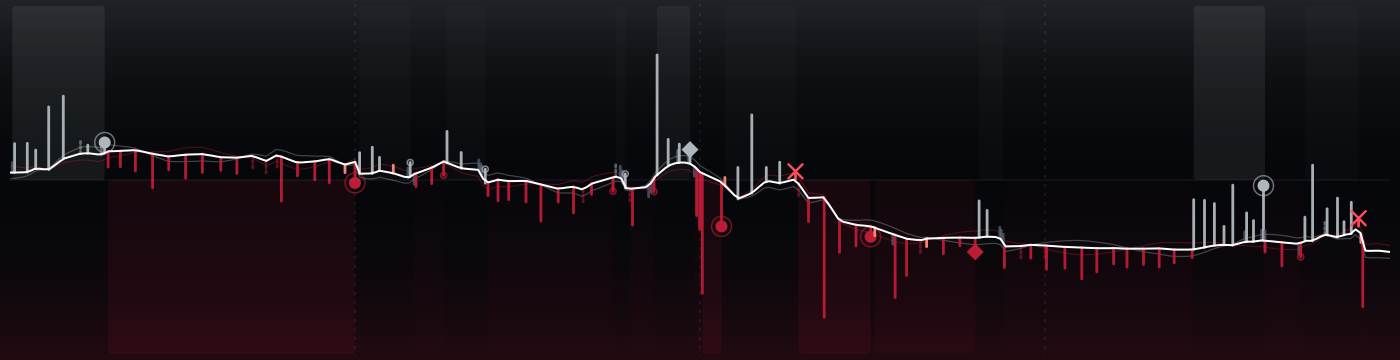
 24@16

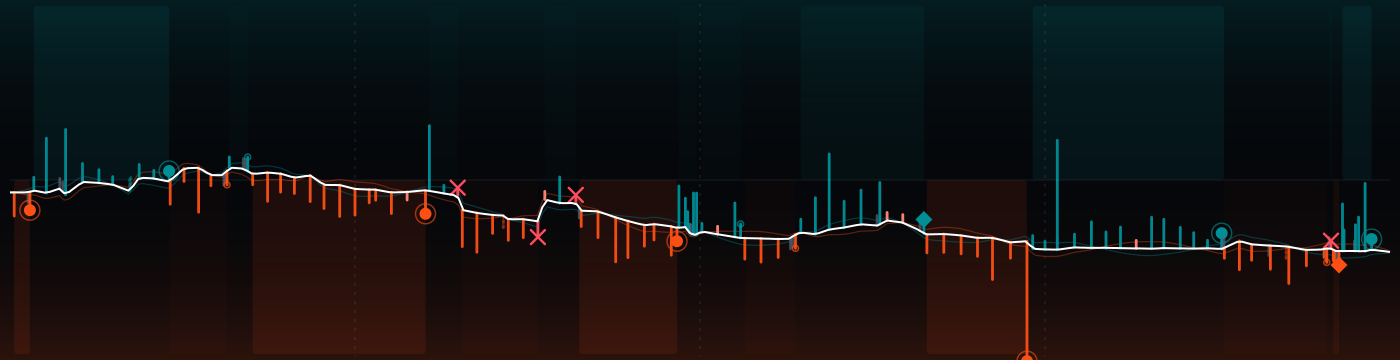
 31@24
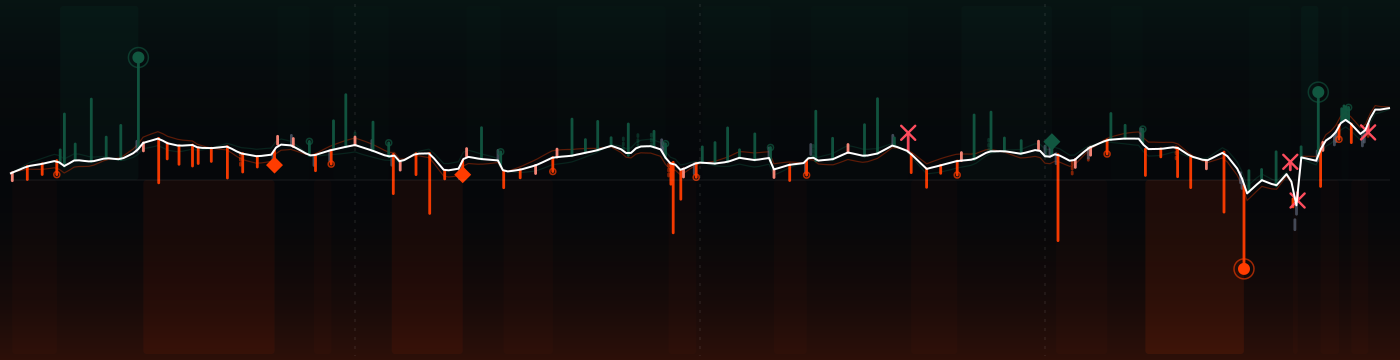
 12@17

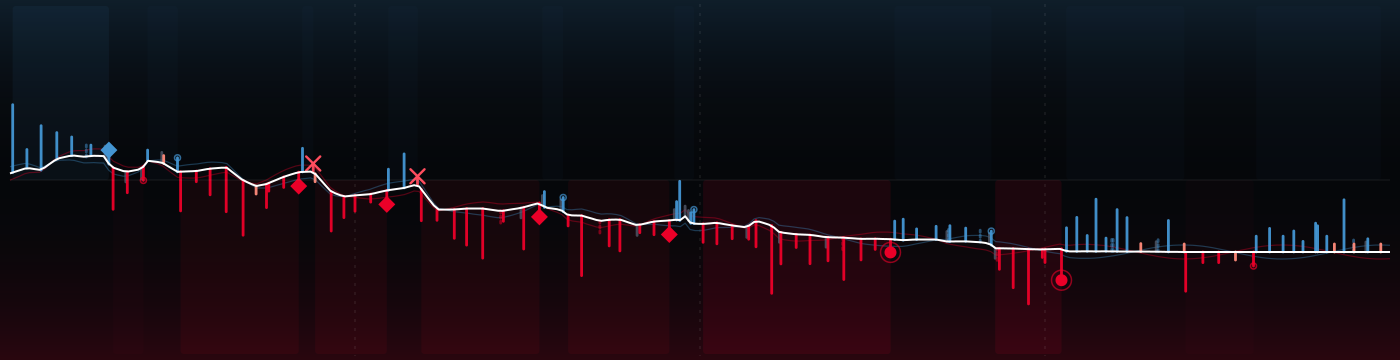
 26@3
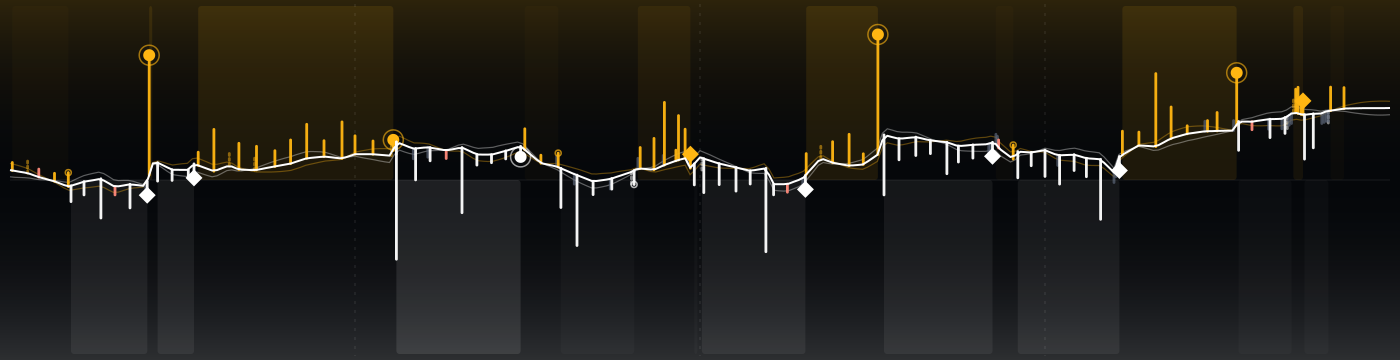
 22@34

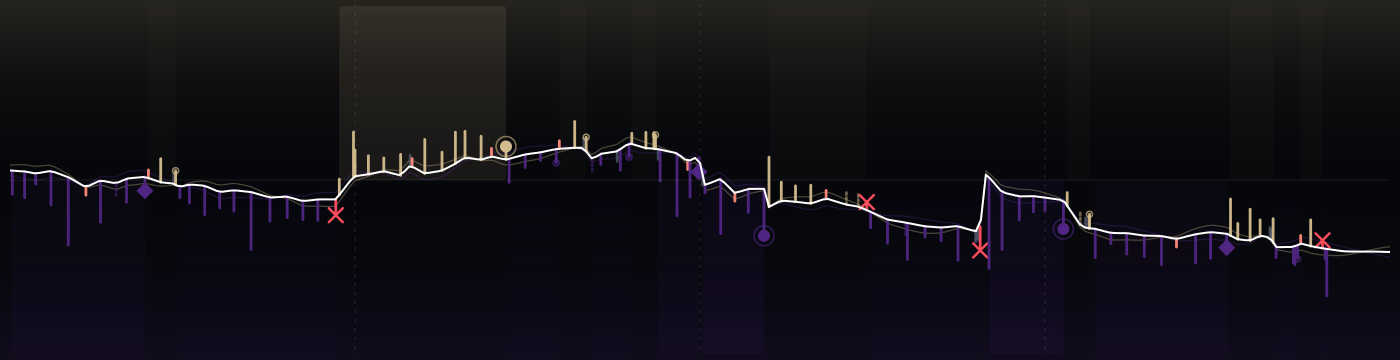
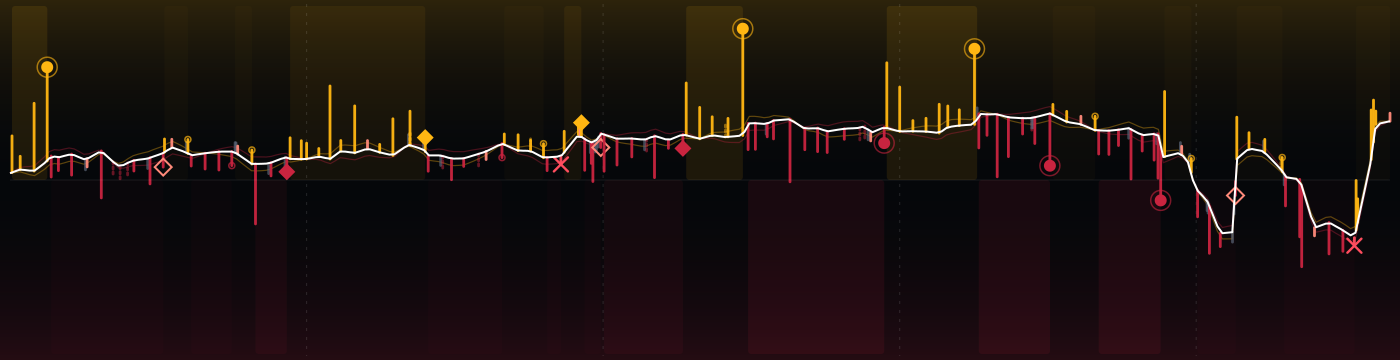

 7@31


 32@29


 30@23

 37@34