Bears earned it: the snaps said Bears by 15.8, a deserved win probability of more than 99%.
The swingQ2 0:37 · SEA · +15 pts of win probability. (Shotgun) 14-S.Darnold pass deep left to 11-J.Smith-Njigba for 43 yards, TOUCHDOWN.
The Chicago Bears beat the Seattle Seahawks 34-17 on Mon, Nov 2 at Lumen Field in Seattle, WA (Week 8, 2026 season). Records after the game: Bears 7-2, Seahawks 5-4. R.Odunze (CHI) led all players with +6.4 EPA on 6 targets.
The Chicago Bears won 34-17. By quarter: CHI 7-6-7-14, SEA 0-9-0-8.
By expected points added: R.Odunze (CHI, +6.4 EPA on 6 targets), J.Smith-Njigba (SEA, +6.0 EPA on 11 targets) and C.Williams (CHI, +5.1 EPA on 36 dropbacks).
The biggest swing in win probability (18 points toward the Seahawks) came in Q2 at 0:30: (Shotgun) S.Darnold pass deep left to J.Smith-Njigba for 43 yards, TOUCHDOWN. J.Myers extra point is No Good, Wide Left, Center-C.Stoll, Holder-M.Dickson.
Pigskin Nightly, “Bears 34, Seahawks 17: Week 8 recap”, https://pigskinnightly.com/games/2026-11-02-chi-at-sea (updated 2026-11-11).
Bears earned it: the snaps said Bears by 15.8, a deserved win probability of more than 99%.
The swingQ2 0:37 · SEA · +15 pts of win probability. (Shotgun) 14-S.Darnold pass deep left to 11-J.Smith-Njigba for 43 yards, TOUCHDOWN.
Deserved win probability from the snaps, fumble bounces evened out. How we judge
If the Seahawks had stopped that fourth-and-1
Q1 10:58 4-D.Swift right tackle to CHI 49 for 5 yards (13-E.Jones).
Hover, tap or drag along the river to read any play. Arrow keys work too. Click to jump to its drive.
| Passing | C/ATT | YDS | AVG | TD | INT | SACKS | QBR | RTG |
|---|---|---|---|---|---|---|---|---|
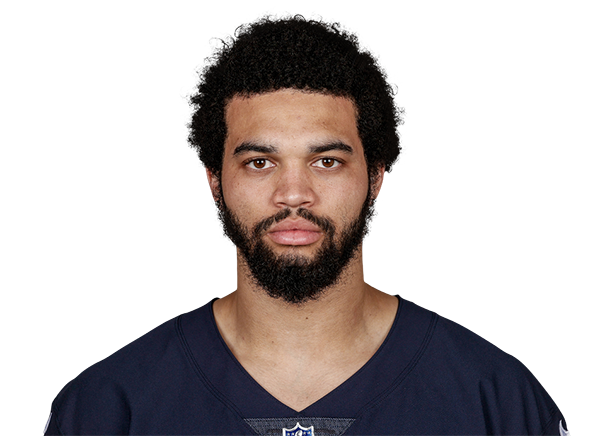
| Caleb WilliamsQB | 24/34 | 247 | 7.3 | 1 | 0 | 1-10 | 68.1 | 101.0 |
| Rushing | CAR | YDS | AVG | TD | LONG |

|---|---|---|---|---|---|
| D'Andre SwiftRB | 27 | 69 | 2.6 | 3 | 7 |
| Kalif RaymondWR | 1 | 39 | 39.0 | 0 | 39 |
| Roschon JohnsonRB | 5 | 17 | 3.4 | 0 | 9 |
| Caleb WilliamsQB | 2 | 1 | 0.5 | 0 | 2 |
| Receiving | REC | TGTS | YDS | AVG | TD | LONG |
|---|---|---|---|---|---|---|
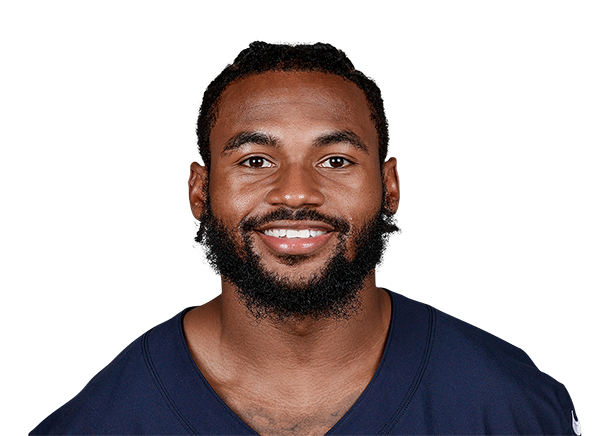
| Rome OdunzeWR | 4 | 6 | 87 | 21.8 | 0 | 24 |
| Colston LovelandTE | 7 | 9 | 65 | 9.3 | 0 | 15 |
| Luther Burden IIIWR | 7 | 9 | 56 | 8.0 | 1 | 23 |
| Kalif RaymondWR | 2 | 3 | 14 | 7.0 | 0 | 9 |
| Roschon JohnsonRB | 1 | 1 | 11 | 11.0 | 0 | 11 |
| D'Andre SwiftRB | 2 | 3 | 10 | 5.0 | 0 | 8 |
| Zavion ThomasWR | 1 | 3 | 4 | 4.0 | 0 | 4 |
| Defense | TOT | SOLO | SACKS | TFL | PD | QB HTS |
|---|---|---|---|---|---|---|
| Devin BushLB | 6 | 5 | 1 | 1 | 0 | 1 |
| Jeffery SimmonsDT | 6 | 3 | 1 | 2 | 1 | 1 |
| Tyrique Stevenson Sr.CB | 5 | 4 | 0 | 0 | 1 | 0 |
| Jaylon JohnsonCB | 5 | 3 | 0 | 1 | 0 | 0 |
| Dillon ThienemanS | 5 | 3 | 0 | 0 | 0 | 0 |
| Daniel HardyDE | 3 | 2 | 0 | 0 | 0 | 0 |
| Noah SewellLB | 3 | 2 | 0 | 0 | 0 | 0 |
| Austin BookerDE | 3 | 1 | 0 | 0 | 1 | 0 |
| T.J. EdwardsLB | 2 | 2 | 0 | 0 | 0 | 0 |
| Cam LewisCB | 2 | 2 | 0 | 0 | 1 | 0 |
| Kicking | FG | PCT | LONG | XP | PTS |
|---|---|---|---|---|---|
| Cairo SantosPK | 2/2 | 100.0 | 44 | 4/4 | 10 |
| Passing | C/ATT | YDS | AVG | TD | INT | SACKS | QBR | RTG |
|---|---|---|---|---|---|---|---|---|
| Sam DarnoldQB | 17/34 | 188 | 5.5 | 2 | 1 | 3-17 | 31.2 | 74.1 |
| Rushing | CAR | YDS | AVG | TD | LONG |
|---|---|---|---|---|---|
| Jadarian PriceRB | 10 | 29 | 2.9 | 0 | 9 |
| Zach CharbonnetRB | 6 | 23 | 3.8 | 0 | 13 |
| Sam DarnoldQB | 2 | 20 | 10.0 | 0 | 14 |
| George HolaniRB | 1 | 9 | 9.0 | 0 | 9 |
| Receiving | REC | TGTS | YDS | AVG | TD | LONG |
|---|---|---|---|---|---|---|
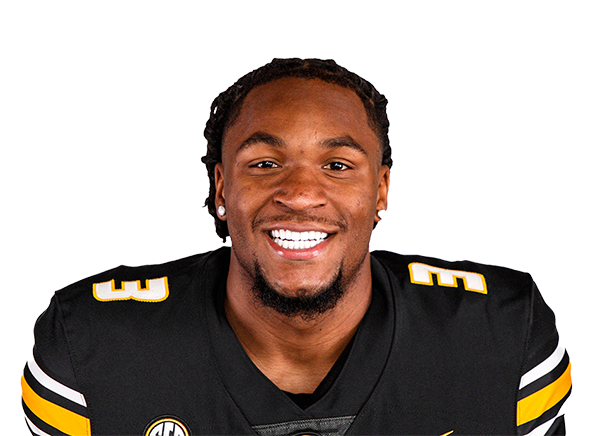
| Jaxon Smith-NjigbaWR | 6 | 11 | 118 | 19.7 | 1 | 43 |
| Tory HortonWR | 3 | 6 | 26 | 8.7 | 0 | 13 |
| AJ BarnerTE | 2 | 5 | 23 | 11.5 | 0 | 17 |
| Jadarian PriceRB | 2 | 4 | 8 | 4.0 | 0 | 6 |
| Cooper KuppWR | 1 | 3 | 7 | 7.0 | 1 | 7 |
| Zach CharbonnetRB | 3 | 4 | 6 | 2.0 | 0 | 6 |
| George HolaniRB | 0 | 1 | 0 | 0.0 | 0 | 0 |
| Defense | TOT | SOLO | SACKS | TFL | PD | QB HTS |
|---|---|---|---|---|---|---|
| Ernest Jones IVLB | 13 | 5 | 0 | 0 | 1 | 0 |
| Devon WitherspoonCB | 8 | 5 | 0 | 1 | 0 | 0 |
| Julian LoveS | 7 | 5 | 0 | 0 | 0 | 0 |
| Jarran ReedDT | 7 | 4 | 0 | 2 | 0 | 0 |
| Drake ThomasLB | 7 | 1 | 0 | 0 | 0 | 0 |
| Josh JobeCB | 5 | 4 | 0 | 0 | 0 | 0 |
| Nick EmmanworiS | 5 | 2 | 0 | 0 | 0 | 1 |
| Mike MorrisDE | 4 | 3 | 1 | 1 | 0 | 1 |
| Derick HallLB | 4 | 3 | 0 | 1 | 0 | 0 |
| Nehemiah PritchettCB | 3 | 3 | 0 | 0 | 1 | 0 |
| Kicking | FG | PCT | LONG | XP | PTS |
|---|---|---|---|---|---|
| Jason MyersPK | 1/2 | 50.0 | 27 | 0/1 | 3 |
The Bears' third-down defense ranks 1st in third-down conversion rate (26.1% allowed, 69 third downs faced) and faces a Seahawks third-down offense ranked 17th (40.0%, 90 third downs).
17thSEA offense16 spots apart1stCHI defenseThe Bears' pass rush ranks 3rd in sack rate (8.4% of dropbacks, 227 dropbacks faced) and faces a Seahawks pass protection ranked 18th (6.4% sacked, 249 dropbacks).
18thSEA offense15 spots apart3rdCHI defenseThe Bears' run defense ranks 16th in EPA per rush (-0.08 allowed, 124 rushes faced) and faces a Seahawks run game ranked 30th (-0.22, 195 rushes).
30thSEA offense14 spots apart16thCHI defenseDropbacks include sacks and scrambles; rushes are designed runs. What EPA measures.
Conversions are third-down snaps that gained a first down or scored.
A trip is a drive with at least one snap inside the opponent's 20; the rate is trips that ended in an offensive touchdown. Small samples swing fast here.
Completions of 20+ yards and runs of 10+, per snap. Definition.
Sacks per dropback. The public play-by-play has no pressure charting, so this is the sack side of it only.
Interceptions and lost fumbles on offensive snaps, per game. Turnover rates are among the least stable numbers in football.
Sample: CHI 7 games, 497 offensive and 351 defensive plays · SEA 7 games, 444 offensive and 406 defensive plays. Rank 1 is the best offense or the best defense in each stat. Keys are the largest rank gaps (12+ spots) between an offense and the defense it faces, one per stat. Ranks are not schedule-adjusted.
Confirmed from the official snap counts: at every position group the starters are the snap leaders. Expected lineup = today's depth chart, adjusted for the injury report.
K Cairo Santos ✓P Tory Taylor ✓LS Scott Daly ✓
K Jason Myers ✓P Michael Dickson ✓LS Chris Stoll ✓
Last: Thu wk 7 vs NE (W 30-24) · 6,181 mi flown this season
Last: Sun wk 7 vs KC (W 20-3) · 8,902 mi flown this season
Teams with more rest than their opponent are 34-12 in 2026 (46 games). After trips over 1,500 miles: 15-18 (33 games). All travel splits →