Patriots DeskPatriots threw on 73% of early downs in Week 9 and the offense stalled2 min ago
 Bills DeskJosh Allen's passing efficiency has cooled while his legs still pay off2 min ago
 InjuryPuka Nacua: Questionable → Doubtful7 min ago
 InjuryDeshaun Watson: Active → Out7 min ago
 Baltimore RavensLate for Work: Pundits Grade Trade for Offensive Lineman Ryan Neuzil
 New Orleans SaintsFive things to know about the New Orleans Saints for Wednesday, November 11
 Indianapolis ColtsIndiana Football Digest Insider 2026 - Sectional Finals recap
 New York JetsWays to Watch and Stream | Jets vs. Bills
 ESPNJacksonville Jaguars' Foyesade Oluokun leads the way again in Africa's Week 9 NFL exploits
 Detroit LionsNFC NORTH: Where all four teams stand heading into Week 10
 ESPNQuestions on 2026 NFL trade deadline deals: Does Kirk Cousins lift the Vikings?
 ESPNCowboys rave about Quinnen Williams a year after trade deadline deal
 ESPNBig plays by Broncos defense in late-game situations keying Denver's 7-2 start
 InjuryEric Wilson: Active → Cleared11 h ago
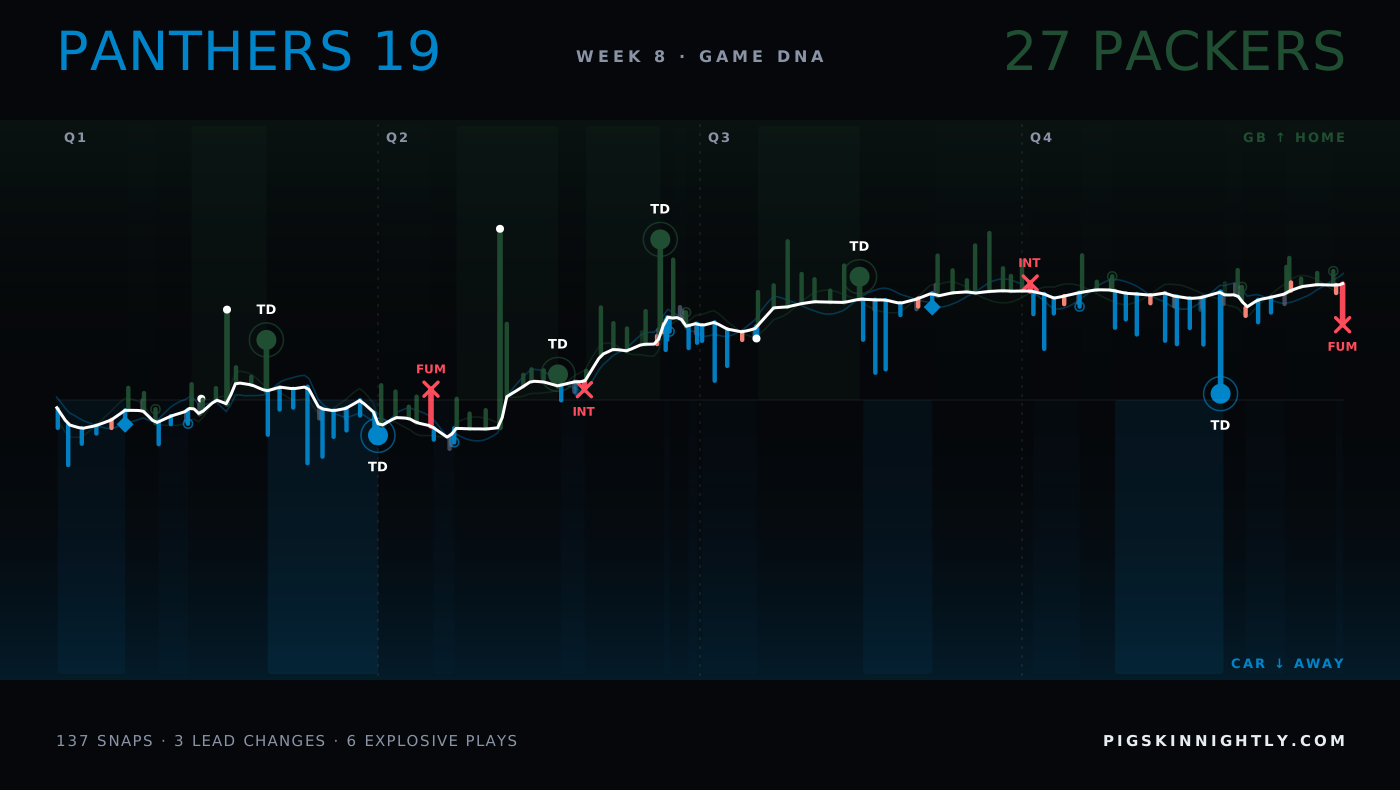
Week 8 · 2026Panthers 19 · 27 Packers
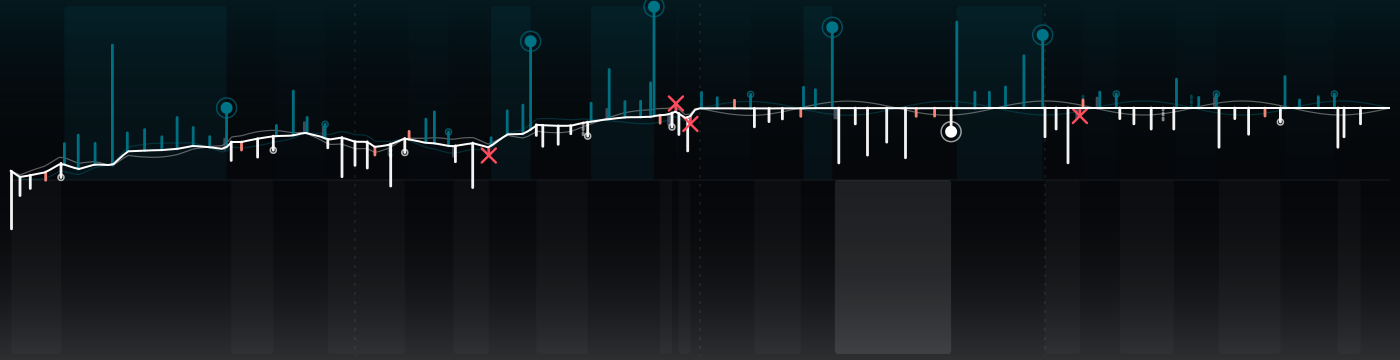
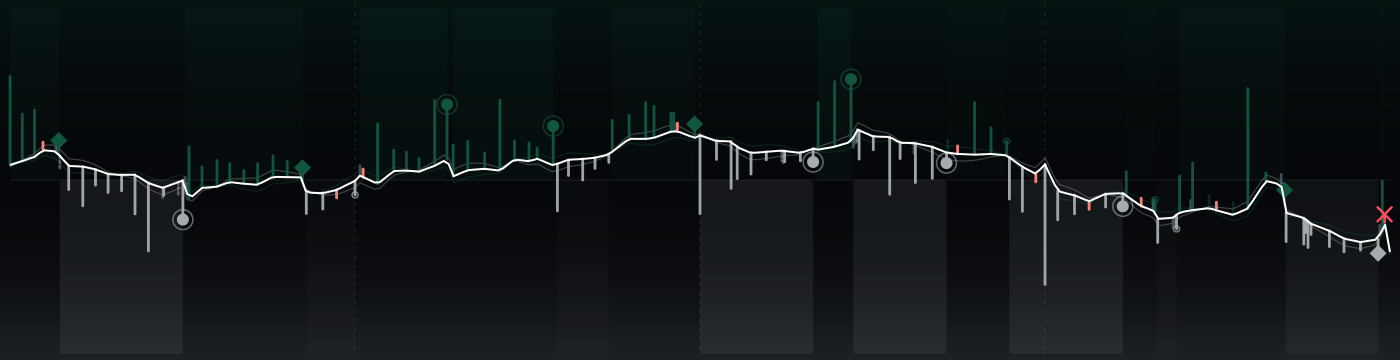
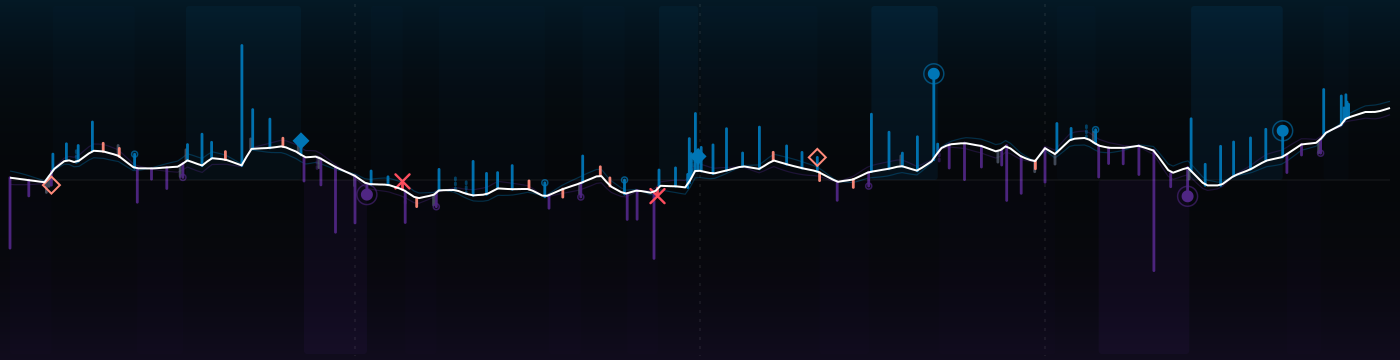
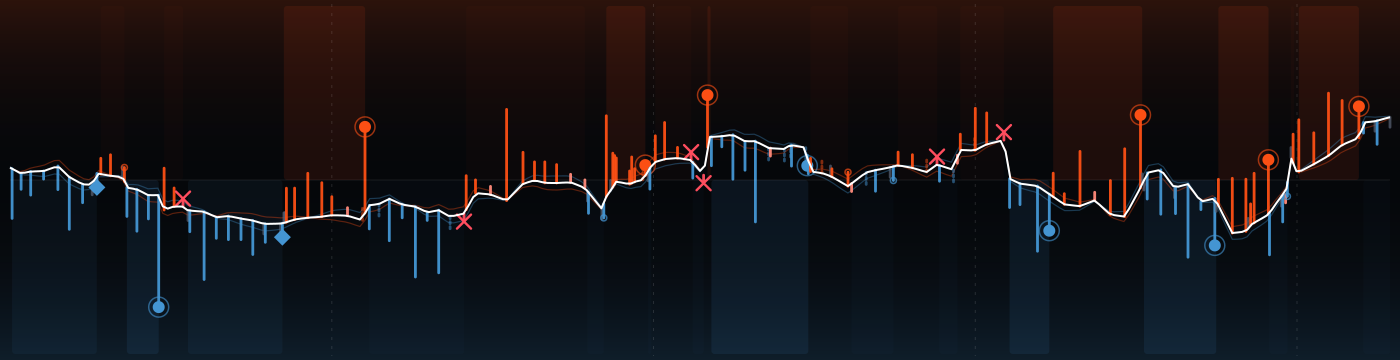
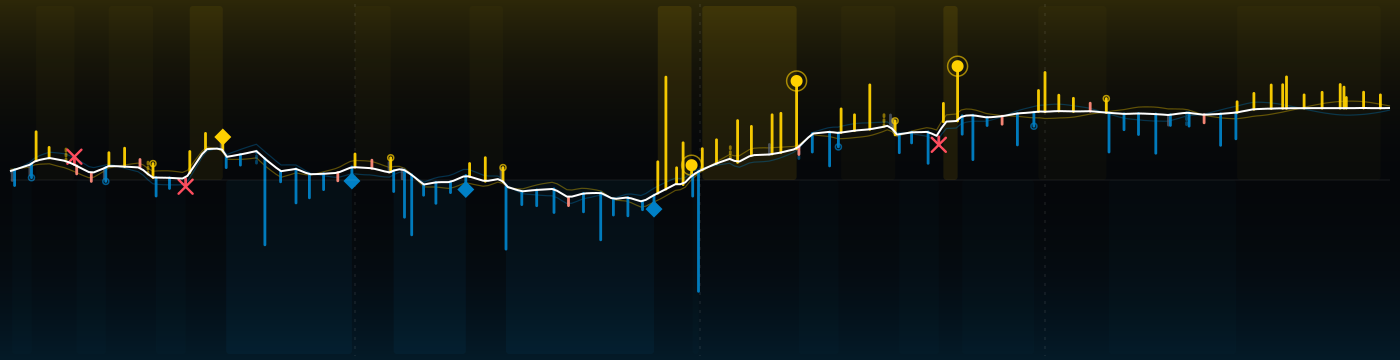
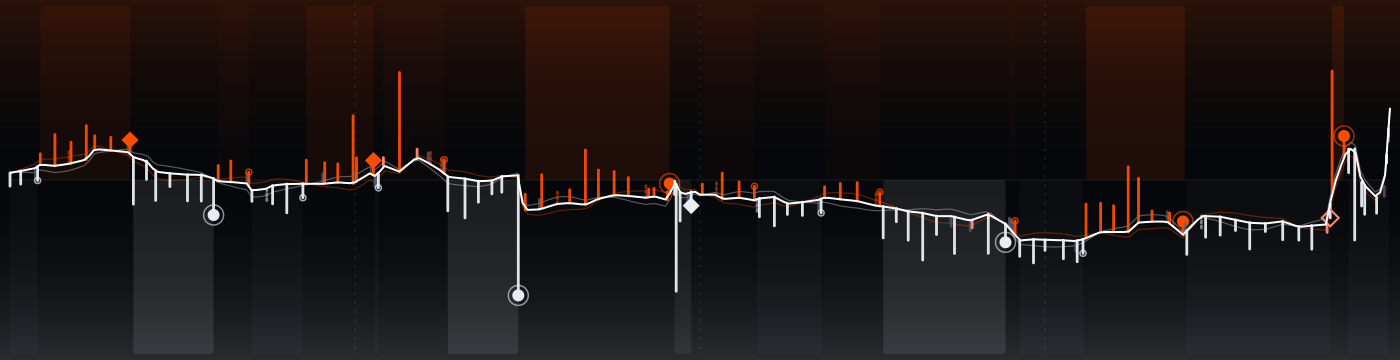
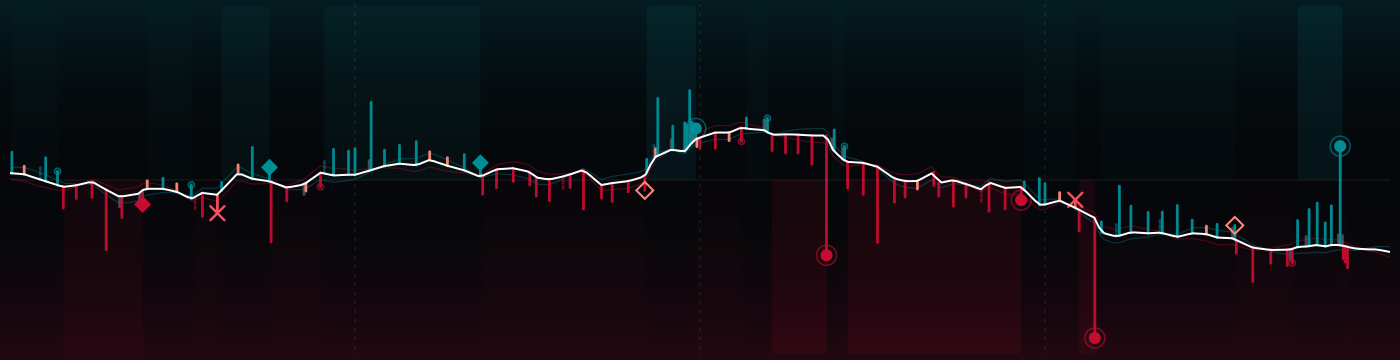
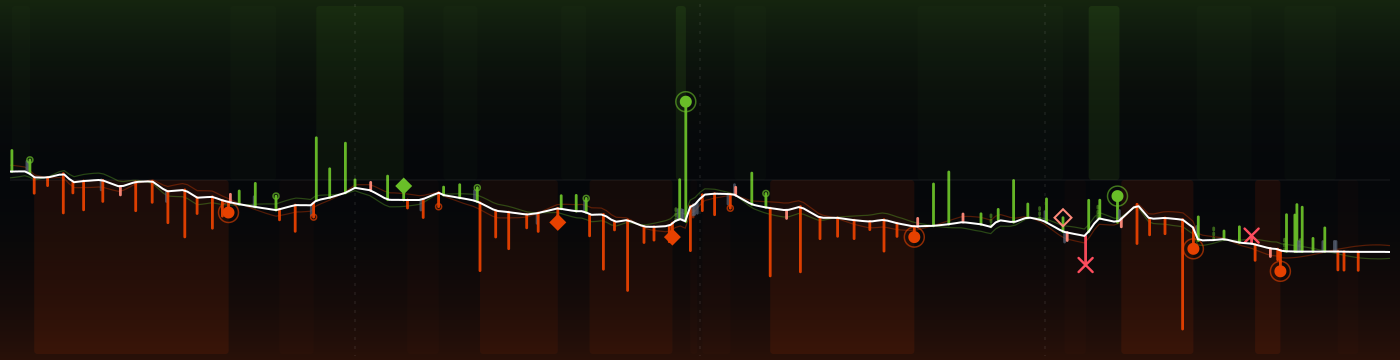
156 plays, one strand. Packers won after 3 lead changes; Panthers peaked at 67% to win, Packers at 99%. The white spine is the win probability, every rung a snap: up for GB, down for CAR, as long as the yards it gained.
↳Bottom line3 lead changes; Panthers peaked at 67% to win, Packers at 99%.
?How to read this chart
- Read it left to right:
- kickoff on the left, final whistle on the right.
- The white line
- is the chance that Packers win, play by play. High = GB in control, low = CAR in control, the middle is a coin flip. Each crossing of the middle is a change in who was more likely to win.
- Each little bar is one play:
- up for GB on offense, down for CAR; the longer the bar, the more yards. The key under the picture explains the marks (touchdown, turnover, field goal, punt).
 Packers ↑
 Panthers ↓
The strands compared
?How to read this chart
- Each row compares the two teams
- on one stat: CAR on the left, GB on the right. The longer bar is the bigger number.
- Explosive plays
- are long gains (big runs and passes). Peak win prob. is the highest chance to win each team reached at any moment.
Every possession
?How to read this chart
- Each tile is one possession,
- in game order, colored by the team that had the ball.
- Inside:
- the team, how it ended (TD = touchdown, FG = field goal, INT = interception, FUM = fumble, otherwise punt or downs) and the yards gained. Brighter tiles are drives that scored.
The plays that moved it most
↳Bottom lineThe biggest swing: play 1, 3.0 expected points for Packers.
?How to read this chart
- The strip is the game clock;
- each numbered dot is one of the plays below, placed when it happened and colored by the team on offense.
- EP (expected points)
- is how many points the play added to (+) or took away from (−) the offense's expected score. +3.5 EP is worth more than a field goal; big minus numbers are usually turnovers.
- 1Q1 5:12 · GB · Touchdown+3.0 EP
10-J.Love pass short middle to 85-T.Kraft for 12 yards, TOUCHDOWN.
- 2Q2 12:32 · GB · Fumble lost−3.5 EP
10-J.Love pass short left to 9-C.Watson to CAR 42 for 8 yards (21-N.Scott). FUMBLES (21-N.Scott), touched at CAR 40, RECOVERED by CAR-58-B.O
- 3Q2 9:19 · GB · Completion+3.2 EP
10-J.Love pass deep middle to 9-C.Watson to CAR 26 for 53 yards (24-W.Lee). GB-9-C.Watson was injured during the play. CAR-24-W.Lee was inju
- 4Q2 5:23 · CAR · Interception−4.4 EP
9-B.Young pass short left intended for 18-J.Coker INTERCEPTED by 59-T.Hopper at CAR 44. 59-T.Hopper to CAR 43 for 1 yard (18-J.Coker).
- 5Q2 1:51 · GB · Touchdown+4.5 EP
10-J.Love pass deep left to 0-M.Golden for 24 yards, TOUCHDOWN.
- 6Q3 12:22 · CAR · Run−3.0 EP
30-C.Hubbard right end to GB 49 for 1 yard (55-C.McClellan).
- 7Q4 14:37 · GB · Interception−3.5 EP
10-J.Love pass deep right intended for 0-M.Golden INTERCEPTED by 20-Z.Wheatley at CAR 2. 20-Z.Wheatley to CAR 19 for 17 yards (22-P.Strong).
- 8Q4 5:45 · CAR · Touchdown+5.0 EP
9-B.Young pass short middle to 18-J.Coker for 26 yards, TOUCHDOWN.
The one play that could have changed it
?How to read this chart
- The line is win probability
- over the game (top = home team ahead). The dot marks the one play that could have gone either way; the big % is the losing team's chance right after it.
- Press Flip it
- to see where that chance would have gone if the play had gone the other way. Only that instant is priced: the rest of the game never happened.
If the Panthers had recovered that fumble
Q4 4:50 73-J.Williams to GB 22 for -5 yards. FUMBLES, recovered by GB-10-J.Love at GB 21. 10-J.Love pass incomplete short right. PENALTY on GB-10-J.Love, Intentional Grounding, 15 yards, enforced at GB 27.
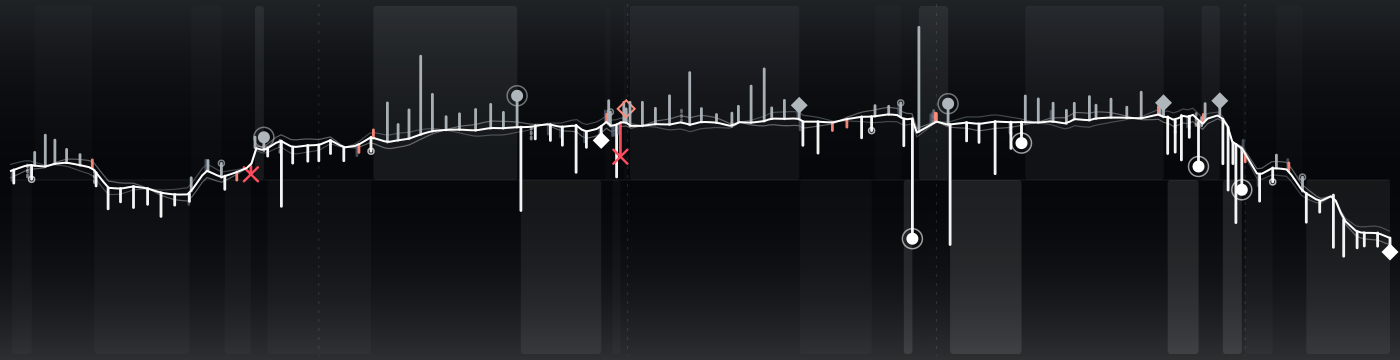
 33@30
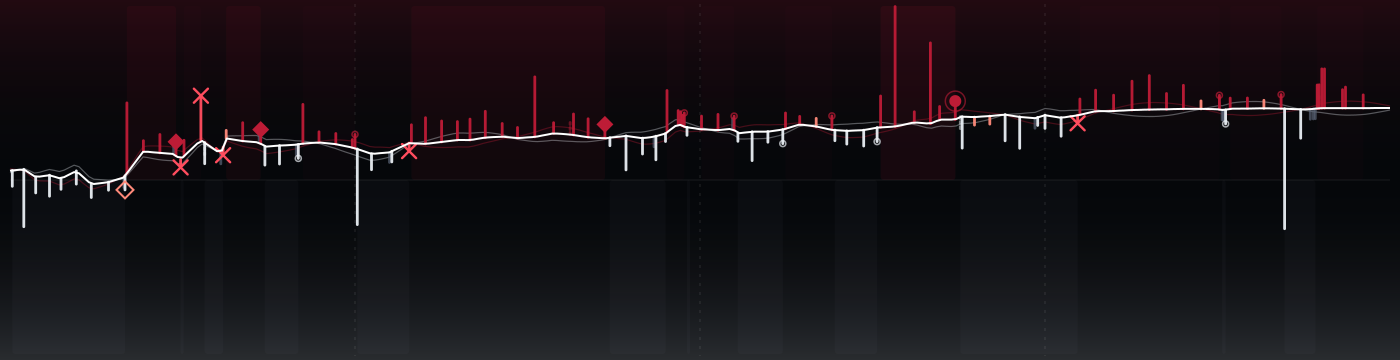
 0@16


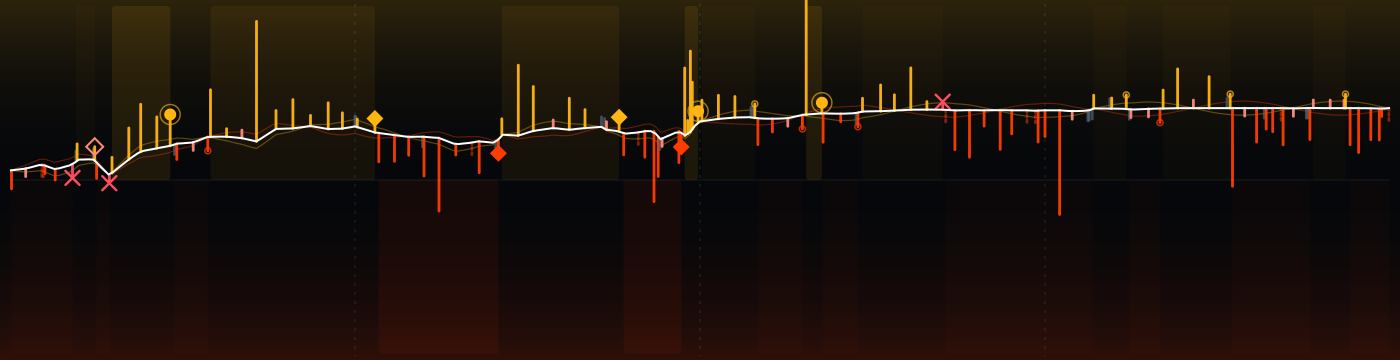

 38@33
 36@43

 9@24


 10@27

 34@17