Pro Football RumorsCardinals Work Out QBs Cooper Rush, Trevor Siemian
 ESPNWhy Giants' trade attempts 'just didn't happen'
 ESPNChiefs add WR Josh Downs at NFL trade deadline
 ESPNHow the Amani Hooker trade helps the Titans rebuild
 Pro Football RumorsJets Work Out QBs Bailey Zappe, Austin Reed
 InjuryZach Allen: Active → Cleared6 h ago
 Pro Football RumorsCowboys Add RB Kendre Miller To Practice Squad
 InjuryNathan Shepherd: Active → Cleared7 h ago
 Cincinnati BengalsInside The Drive | How Ja'Marr Chase Took Over Madrid
 ESPNRaiders name Fernando Mendoza starting QB after trading Kirk Cousins
 InjuryQuentin Lake: Active → Cleared8 h ago
 InjuryDre'Mont Jones: Active → Cleared8 h ago
 San Francisco 49ersPower Rankings: Where the 49ers Stand Entering Week 10
 ESPNGet ready for Chargers vs. Ravens on Monday Night Football
 Pro Football RumorsMinor NFL Transactions: 11/10/26
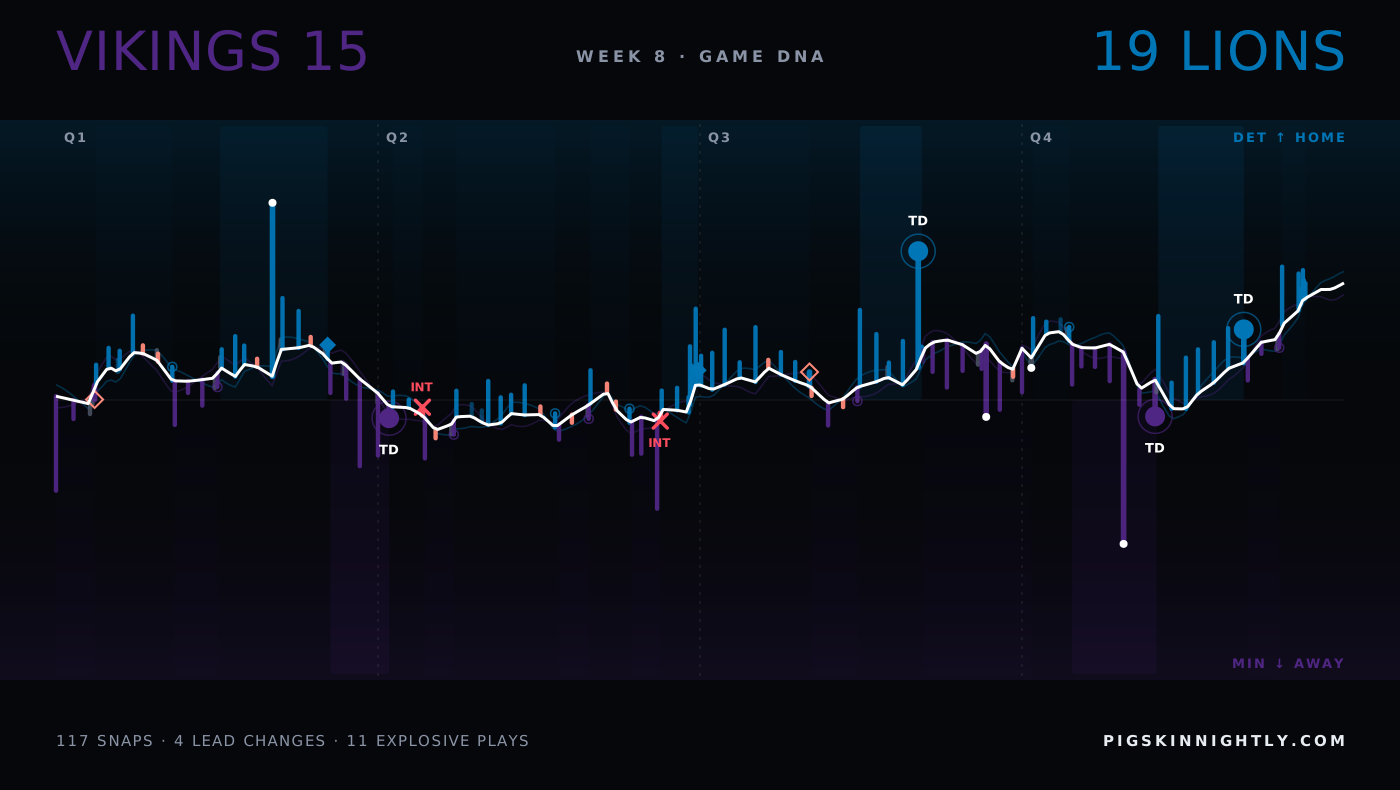
Week 8 · 2026Vikings 15 · 19 Lions
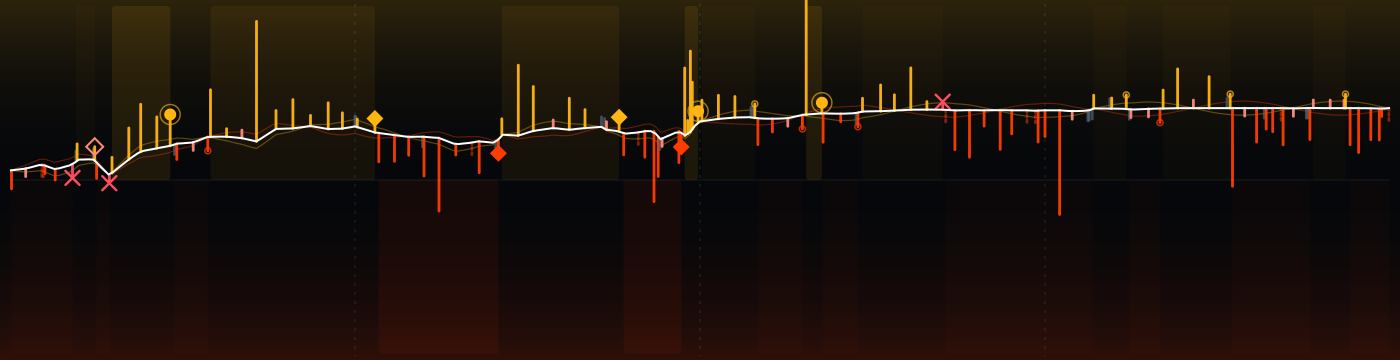
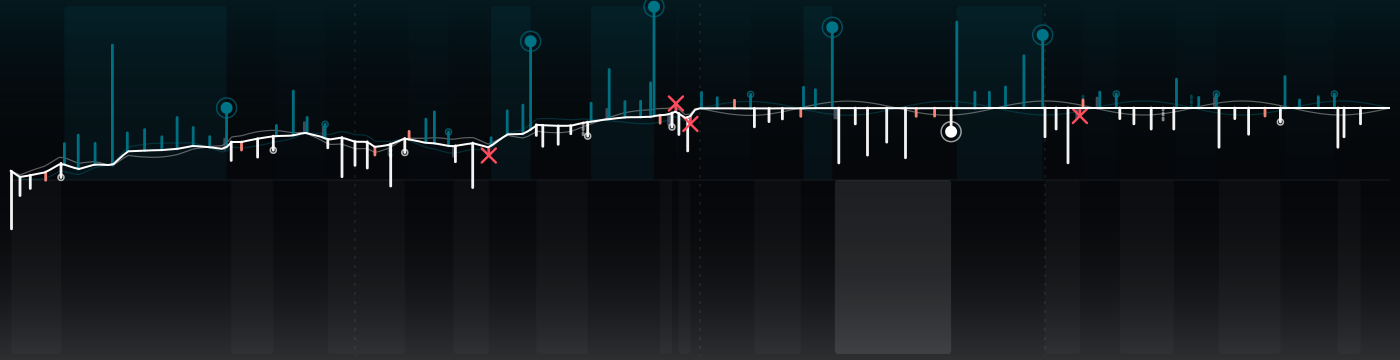
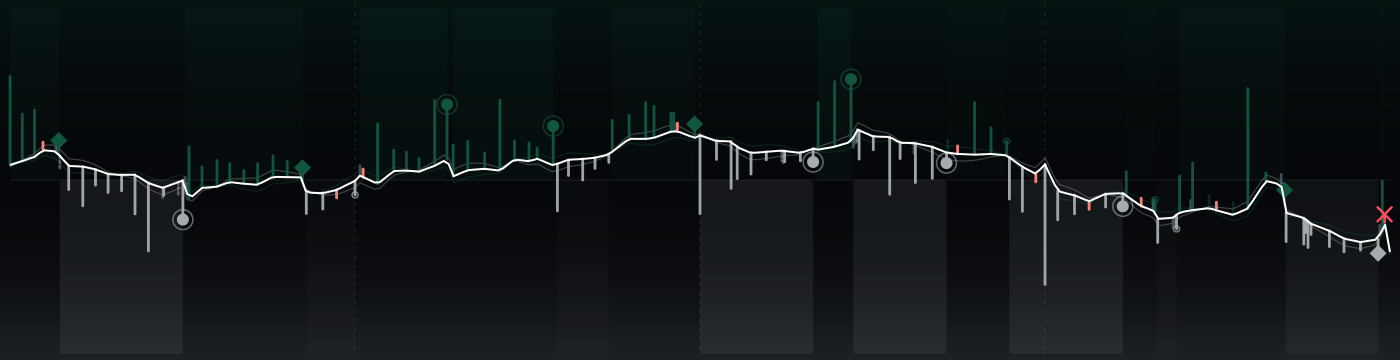
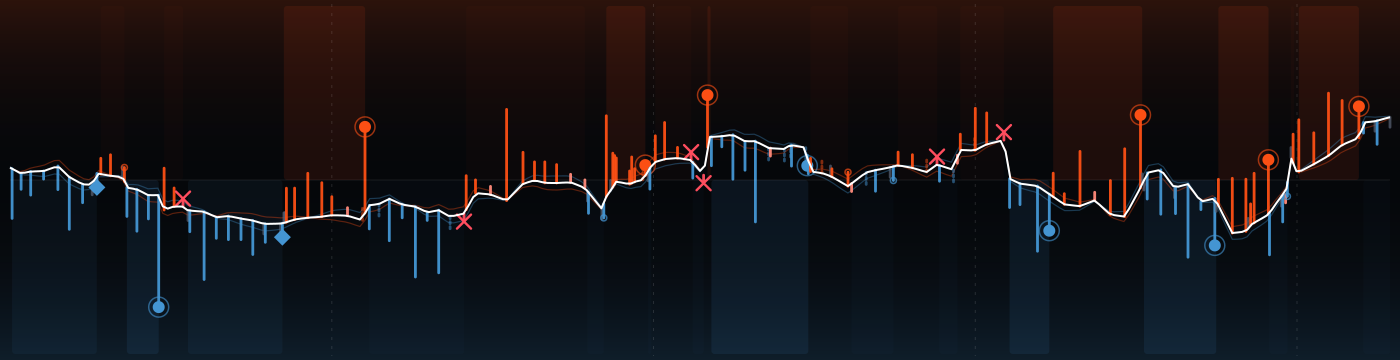
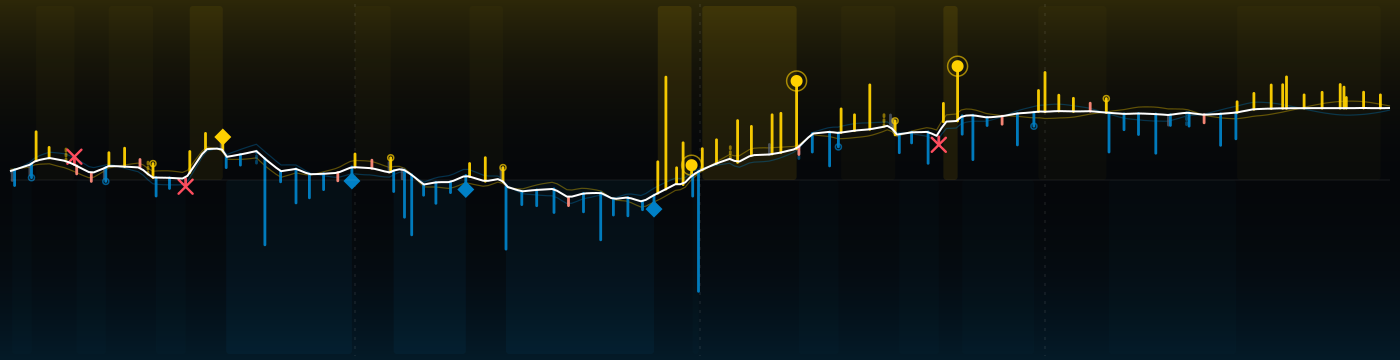
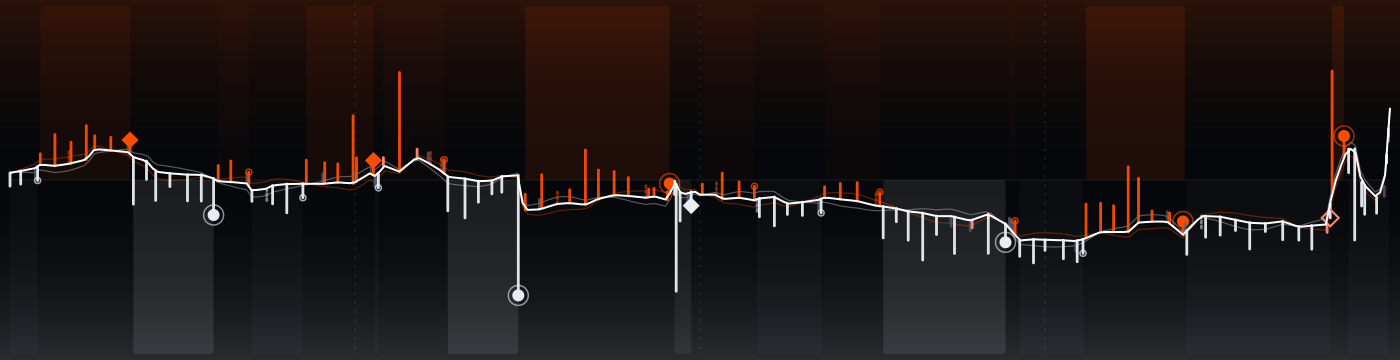
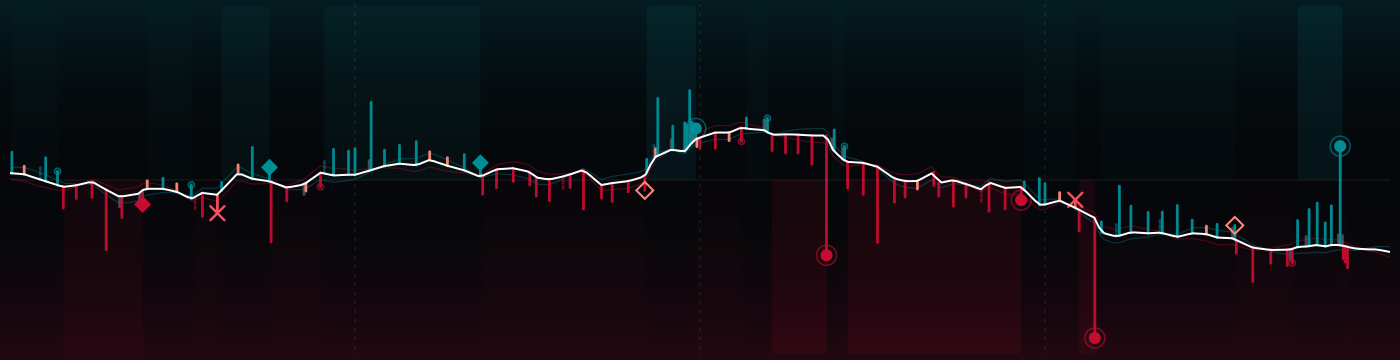
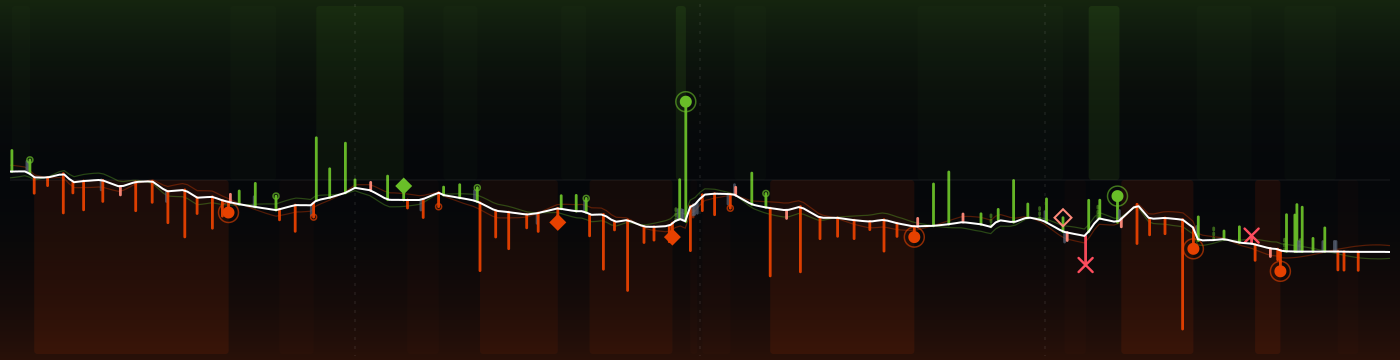
139 plays, one strand. Lions won after 4 lead changes; Vikings peaked at 63% to win, Lions at 97%. The white spine is the win probability, every rung a snap: up for DET, down for MIN, as long as the yards it gained.
↳Bottom line4 lead changes; Vikings peaked at 63% to win, Lions at 97%.
?How to read this chart
- Read it left to right:
- kickoff on the left, final whistle on the right.
- The white line
- is the chance that Lions win, play by play. High = DET in control, low = MIN in control, the middle is a coin flip. Each crossing of the middle is a change in who was more likely to win.
- Each little bar is one play:
- up for DET on offense, down for MIN; the longer the bar, the more yards. The key under the picture explains the marks (touchdown, turnover, field goal, punt).
 Lions ↑
 Vikings ↓
The strands compared
?How to read this chart
- Each row compares the two teams
- on one stat: MIN on the left, DET on the right. The longer bar is the bigger number.
- Explosive plays
- are long gains (big runs and passes). Peak win prob. is the highest chance to win each team reached at any moment.
Every possession
?How to read this chart
- Each tile is one possession,
- in game order, colored by the team that had the ball.
- Inside:
- the team, how it ended (TD = touchdown, FG = field goal, INT = interception, FUM = fumble, otherwise punt or downs) and the yards gained. Brighter tiles are drives that scored.
The plays that moved it most
↳Bottom lineThe biggest swing: play 1, 4.1 expected points against Vikings.
?How to read this chart
- The strip is the game clock;
- each numbered dot is one of the plays below, placed when it happened and colored by the team on offense.
- EP (expected points)
- is how many points the play added to (+) or took away from (−) the offense's expected score. +3.5 EP is worth more than a field goal; big minus numbers are usually turnovers.
- 1Q1 13:12 · MIN · Missed field goal−4.1 EP
16-W.Reichard 57 yard field goal is No Good, Wide Right, Center-42-A.DePaola, Holder-19-B.Thorson.
- 2Q1 4:55 · DET · Completion+3.9 EP
16-J.Goff pass deep middle to 1-J.Williams to MIN 9 for 46 yards (7-B.Murphy). PENALTY on DET-1-J.Williams, Taunting, 15 yards, enforced at
- 3Q2 12:56 · DET · Interception−3.3 EP
16-J.Goff pass short left intended for 1-J.Williams INTERCEPTED by 23-J.Pierre at MIN 46. 23-J.Pierre pushed ob at MIN 46 for no gain (1-J.W
- 4Q2 1:51 · MIN · Interception−3.9 EP
1-K.Murray pass short left intended for 3-J.Addison INTERCEPTED by 4-D.Reed [93-T.Lacy] at DET 38. 4-D.Reed pushed ob at MIN 30 for 32 yards
- 5Q3 9:54 · DET · Missed field goal−3.5 EP
39-J.Bates 46 yard field goal is No Good, Hit Left Upright, Center-49-H.Hatten, Holder-3-J.Fox.
- 6Q3 4:50 · DET · Touchdown+2.7 EP
0-J.Gibbs up the middle for 30 yards, TOUCHDOWN.
- 7Q4 14:34 · MIN · Incomplete−3.6 EP
1-K.Murray pass incomplete short left to 3-J.Addison (4-D.Reed) [97-A.Hutchinson].
- 8Q4 10:16 · MIN · Completion+3.0 EP
1-K.Murray pass deep middle to 3-J.Addison to DET 10 for 51 yards (30-K.Dorsey).
The one play that could have changed it
?How to read this chart
- The line is win probability
- over the game (top = home team ahead). The dot marks the one play that could have gone either way; the big % is the losing team's chance right after it.
- Press Flip it
- to see where that chance would have gone if the play had gone the other way. Only that instant is priced: the rest of the game never happened.
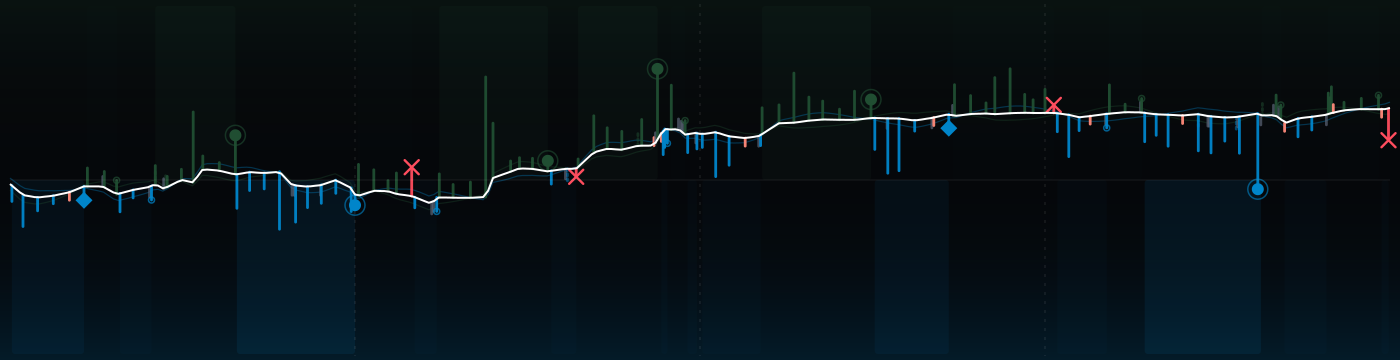
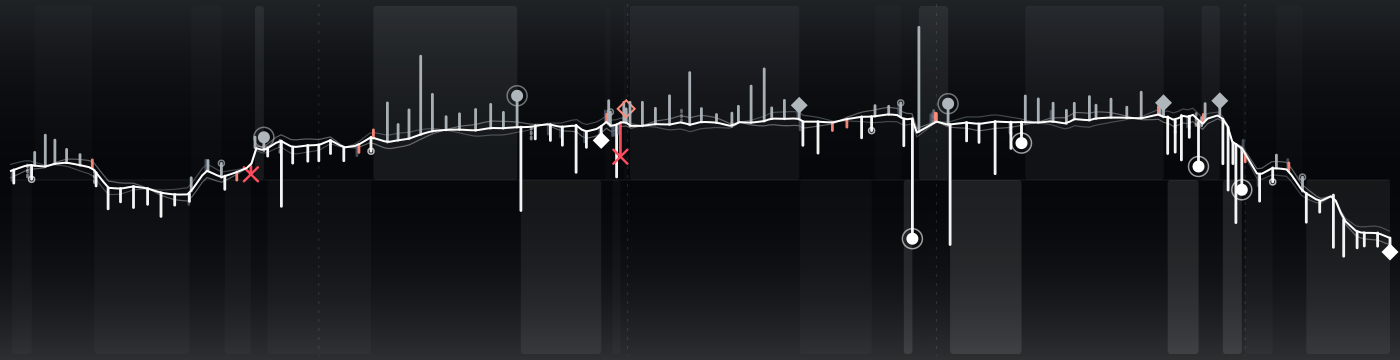
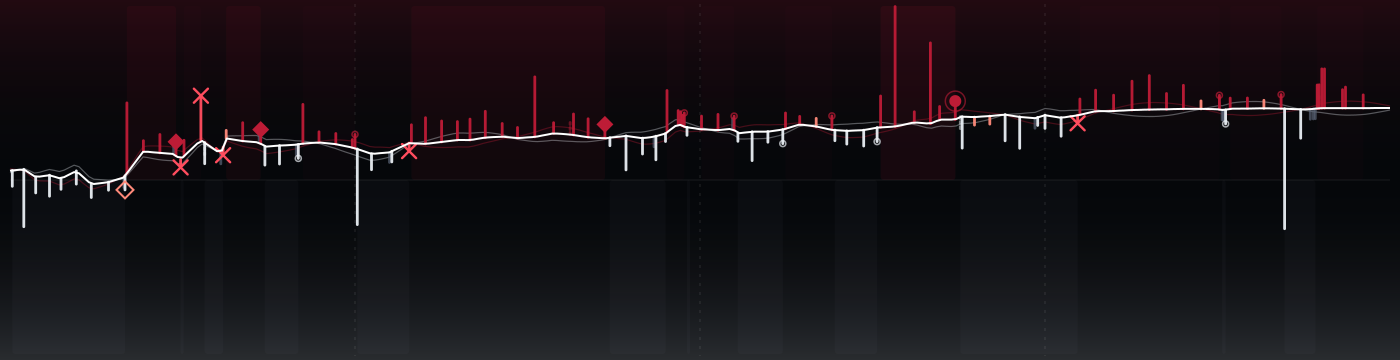
If the Vikings had converted that fourth-and-5
Q4 14:34 1-K.Murray pass incomplete short left to 3-J.Addison (4-D.Reed) [97-A.Hutchinson].
 19@27

 0@16



 6@27

 7@42



 10@27

 34@17