 InjuryZach Allen: Active → Cleared50 min ago
 Pro Football RumorsCowboys Add RB Kendre Miller To Practice Squad
 ESPNHow Josh Downs fits with Patrick Mahomes and the Chiefs offense
 InjuryNathan Shepherd: Active → Cleared1 h ago
 Cincinnati BengalsInside The Drive | How Ja'Marr Chase Took Over Madrid
 InjuryJordyn Brooks: Active → Cleared2 h ago
 Pro Football RumorsNFL Practice Squad Updates: 11/10/26
 ESPNRaiders name Fernando Mendoza starting QB after trading Kirk Cousins
 InjuryDre'Mont Jones: Active → Cleared2 h ago
 InjuryQuentin Lake: Active → Cleared2 h ago
 San Francisco 49ersPower Rankings: Where the 49ers Stand Entering Week 10
 ESPNGet ready for Chargers vs. Ravens on Monday Night Football
 ESPNJets 'stand pat' at NFL trade deadline
 Pro Football RumorsSteelers Soured On Calvin Ridley; Pursued Brian Thomas Jr., Josh Downs


The Atlanta Falcons (3-6) visit the Minnesota Vikings (6-2) on Sun, Nov 29, 1 PM ET at U.S. Bank Stadium in Minneapolis, MN (Week 12, 2026 season), on Fox.
When and where is Falcons vs Vikings?
Sun, Nov 29, 1 PM ET at U.S. Bank Stadium in Minneapolis, MN. TV: Fox.
Who is injured for Falcons vs Vikings?
Falcons: Anterio Thompson (DT, out, undisclosed) and Zachariah Branch (WR, doubtful, hamstring). Vikings: Kyler Murray (QB, doubtful, hamstring), Jauan Jennings (WR, questionable, calf), Theo Jackson (S, questionable) and Tyrion Ingram-Dawkins (DE, questionable, ankle).
Cite this page
Pigskin Nightly, “Falcons at Vikings: Week 12 preview”, https://pigskinnightly.com/games/2026-11-29-atl-at-min (updated 2026-11-11).
Where this game will be decided
- 1
 Vikings pass defense vs Falcons dropback offense
The Vikings' pass defense ranks 1st in EPA per dropback (-0.18 allowed, 271 dropbacks faced) and faces a Falcons dropback offense ranked 28th (-0.13, 286 dropbacks).
28thATL offense27 spots apart1stMIN defense - 2Vikings third-down defense vs Falcons third-down offense
The Vikings' third-down defense ranks 2nd in third-down conversion rate (32.4% allowed, 108 third downs faced) and faces a Falcons third-down offense ranked 28th (35.2%, 105 third downs).
28thATL offense26 spots apart2ndMIN defense - 3Vikings takeaway defense vs Falcons ball security
The Vikings' takeaway defense ranks 5th in turnovers per game (1.5 takeaways a game, 8 games) and faces a Falcons ball security ranked 28th (1.7 giveaways a game, 9 games).
28thATL offense23 spots apart5thMIN defenseSmall sample, read with careWhy sample size matters
When the Falcons have the ballEdge MIN · +27 ranks
Dropbacks include sacks and scrambles; rushes are designed runs. What EPA measures.
When the Vikings have the ballEdge ATL · +12 ranks
Third downEdge MIN · +26 ranks
Conversions are third-down snaps that gained a first down or scored.
Red zoneEdge MIN · +13 ranks
A trip is a drive with at least one snap inside the opponent's 20; the rate is trips that ended in an offensive touchdown. Small samples swing fast here.
Explosive playsNo big edge
Completions of 20+ yards and runs of 10+, per snap. Definition.
Pressure & sacksEdge MIN · +11 ranks
Sacks per dropback. The public play-by-play has no pressure charting, so this is the sack side of it only.
TurnoversEdge MIN · +23 ranks
Interceptions and lost fumbles on offensive snaps, per game. Turnover rates are among the least stable numbers in football.
AbsencesATL 0 · MIN 1 regulars out or doubtful
 Falcons2 listed
0 of them are regulars ruled out or doubtful (60%+ of their unit's snaps across 3+ weeks on the field).
- DZachariah BranchWR24% offense · 8 wk
- OUTAnterio ThompsonDTno snaps
Vikings4 listed1 of them is a regular ruled out or doubtful (60%+ of their unit's snaps across 3+ weeks on the field).
- DKyler MurrayQB86% offense · 6 wk
- QJauan JenningsWR67% offense · 6 wk
- QTheo JacksonS59% defense · 7 wk
- QTyrion Ingram-DawkinsDE59% defense · 8 wk
Snap share is the average of the weeks each player was on the field this season. Full injury report ↓
Rest & travelATL +7 days of rest · ATL travels 907 mi
AwayFalconsLast: Sun wk 10 vs KC · 12,887 mi flown this season
HomeVikingsLast: Sun wk 11 at SF · Mexico City · 6,529 mi flown this season
Sample: ATL 9 games, 525 offensive and 573 defensive plays · MIN 8 games, 447 offensive and 481 defensive plays. Rank 1 is the best offense or the best defense in each stat. Keys are the largest rank gaps (12+ spots) between an offense and the defense it faces, one per stat. Ranks are not schedule-adjusted.
Tale of the tape
ATLMINForm
Last six results BALWk 5
 CHIWk 6
 TBWk 8
 INDWk 7
 DETWk 8
 BUFWk 9
Injury report
League reportFalcons2 listed- OUTAnterio ThompsonDT · Undisclosed
- DZachariah BranchWR · Hamstring
Vikings4 listed- DKyler MurrayQB · Hamstring
- QJauan JenningsWR · Calf
- QTheo JacksonS
- QTyrion Ingram-DawkinsDE · Ankle
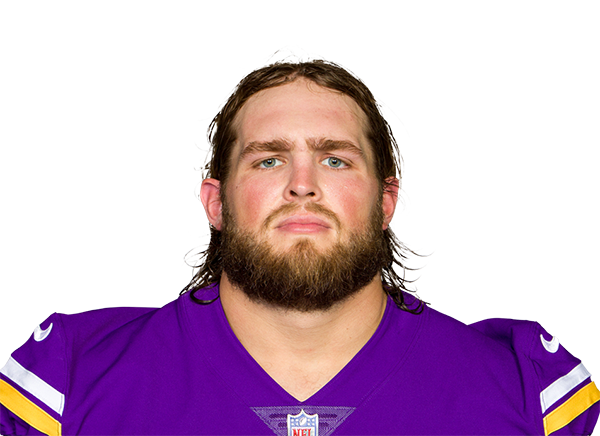
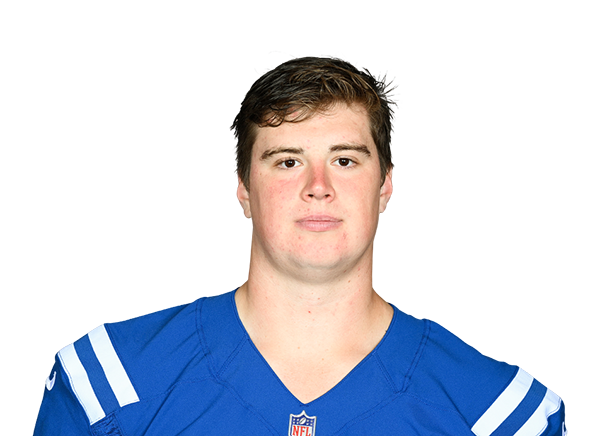
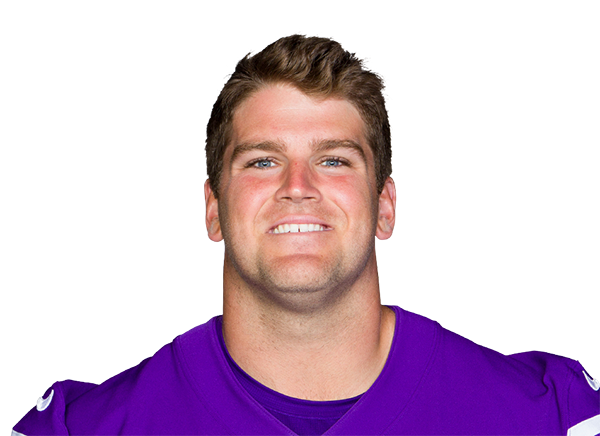
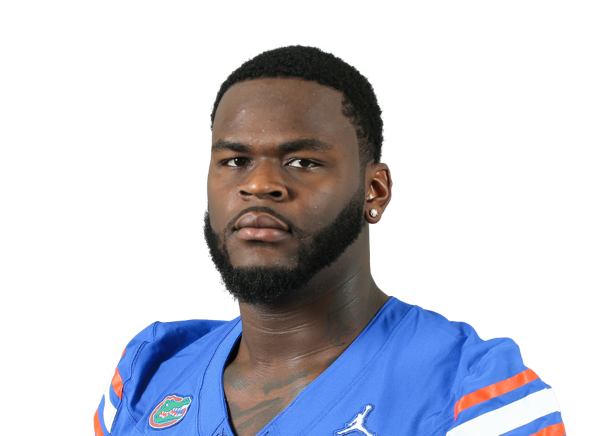
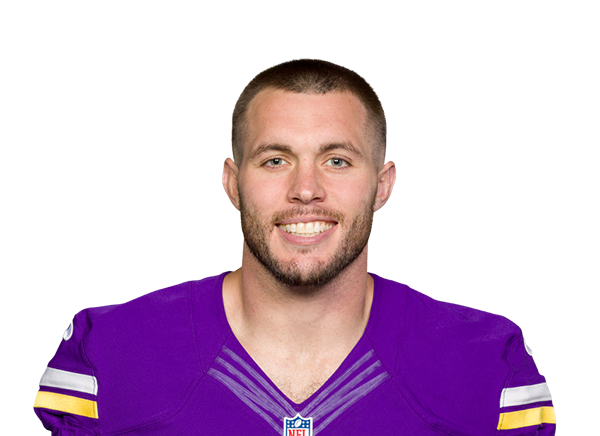
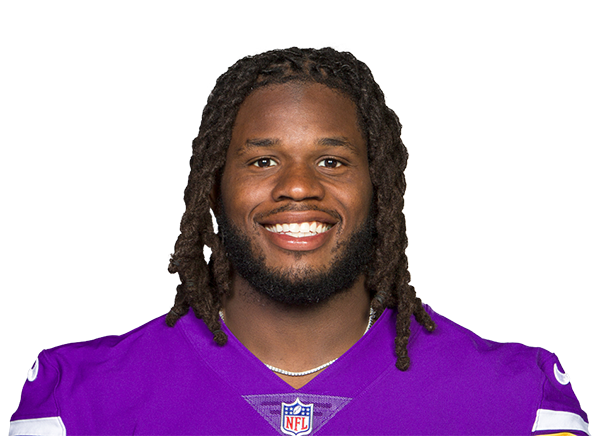
Expected starters
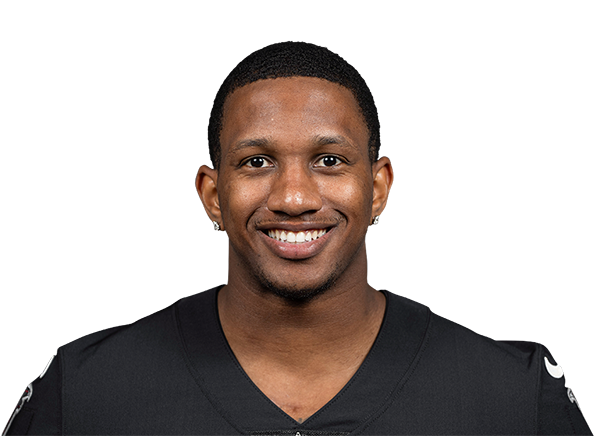
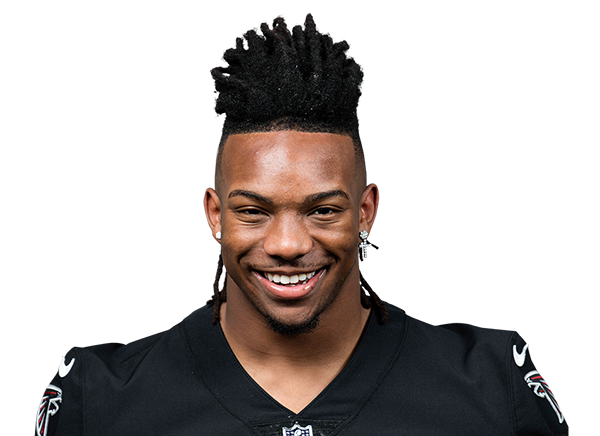
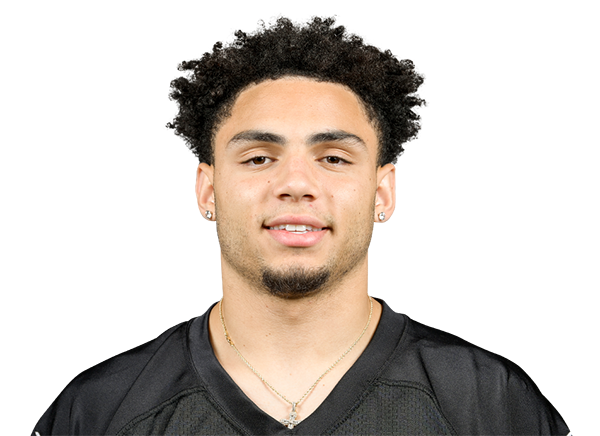
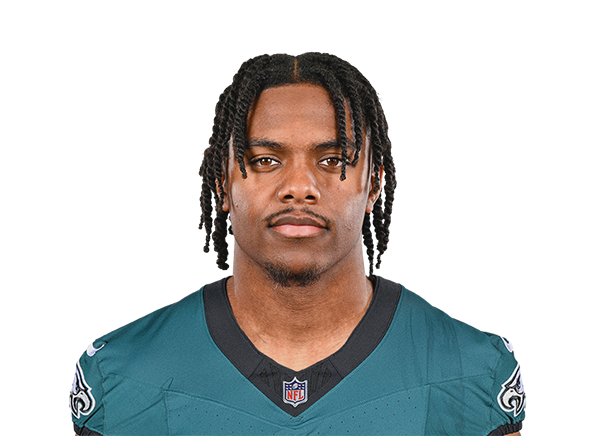
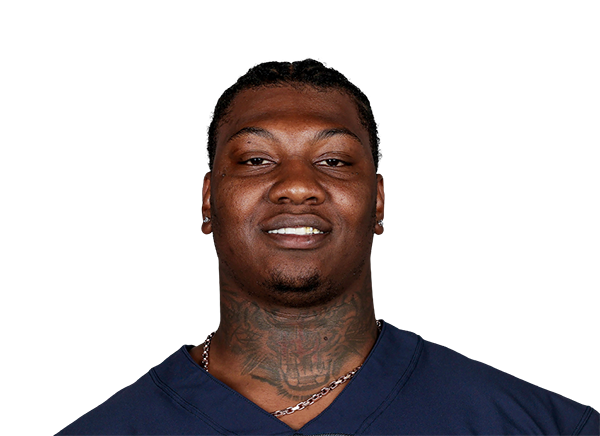
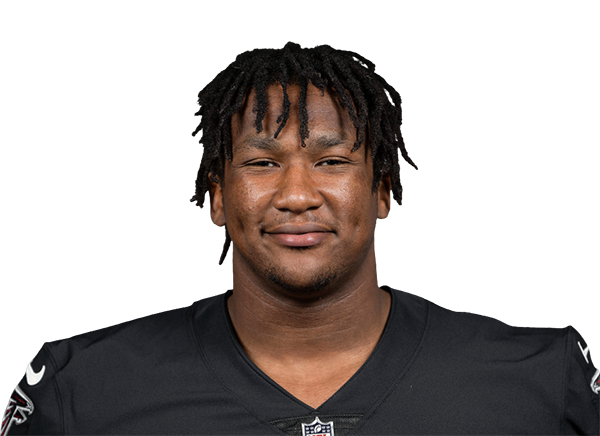
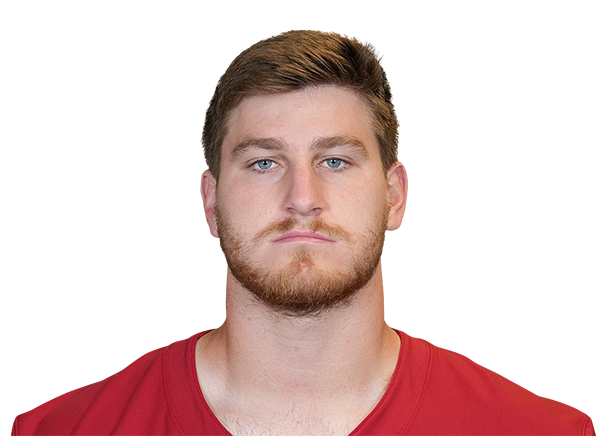
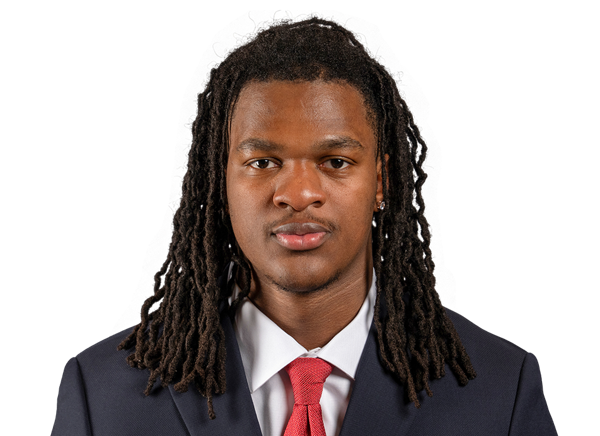
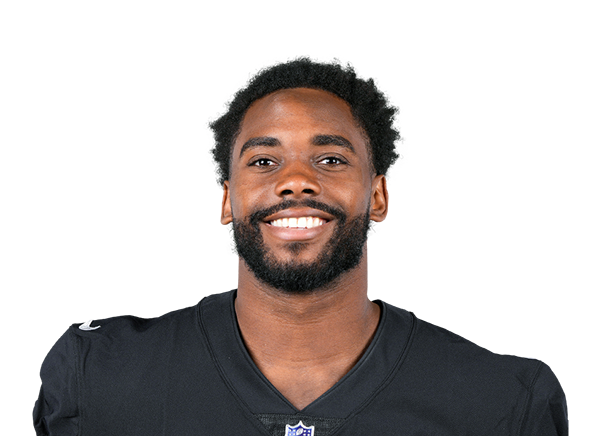
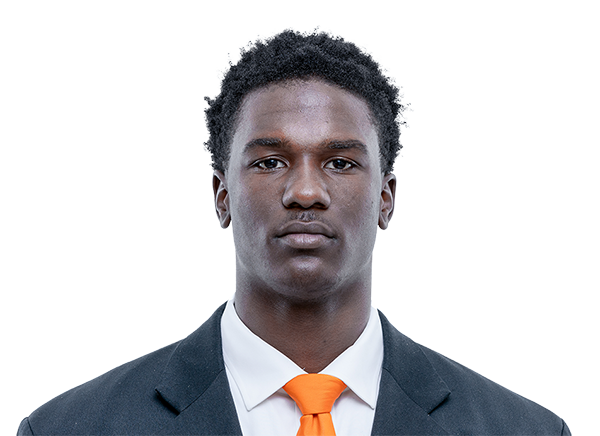
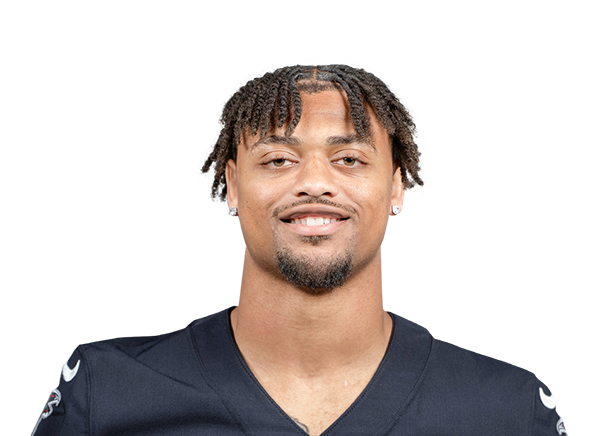
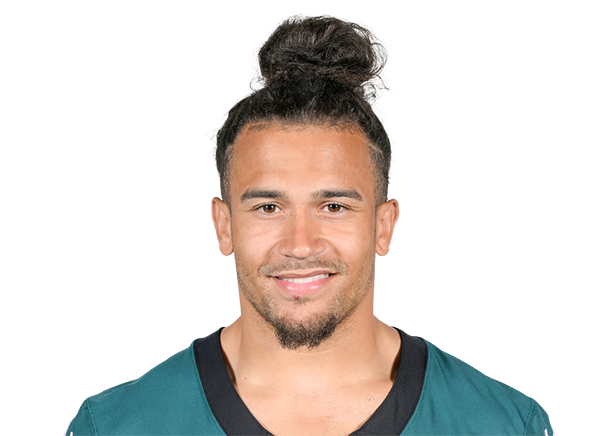
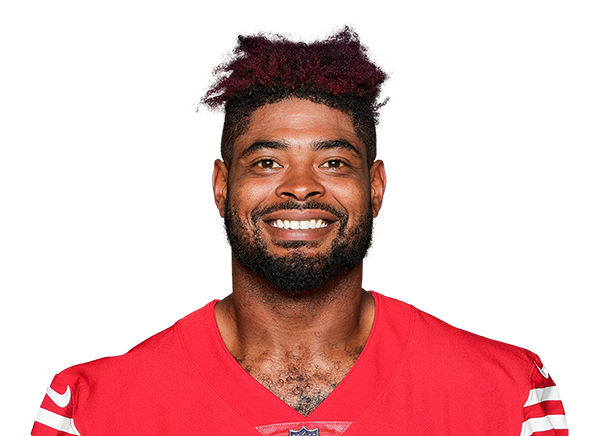
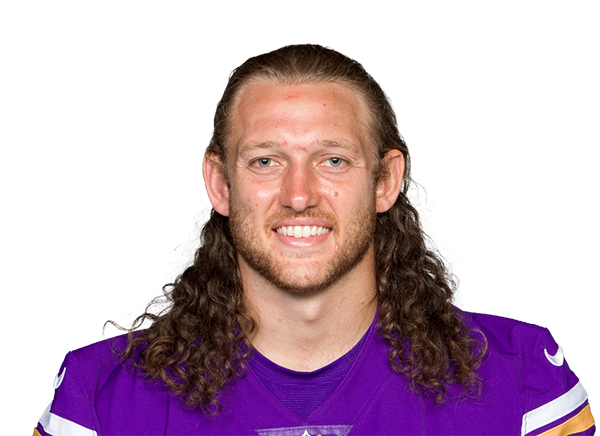
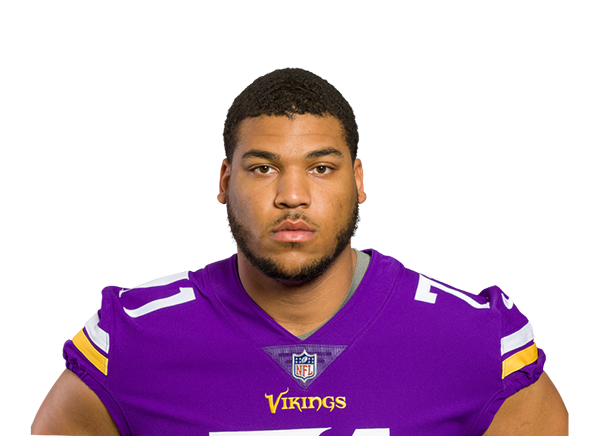
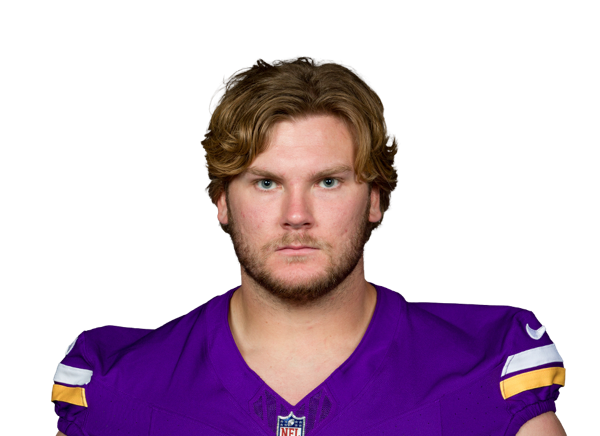
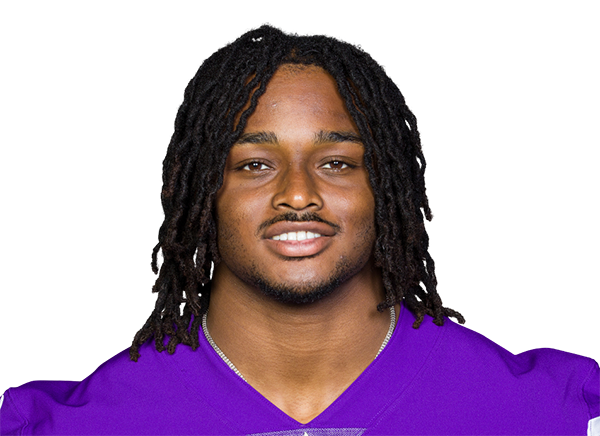
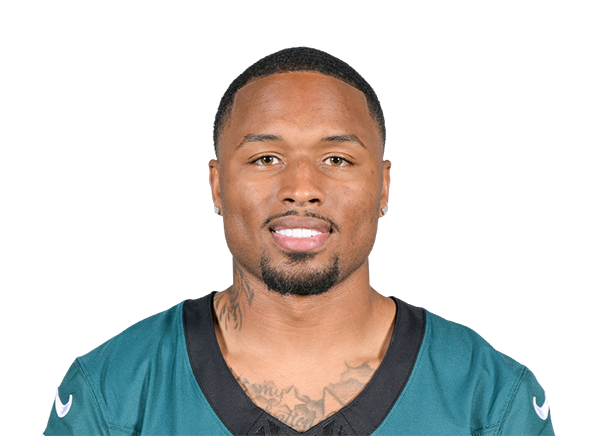
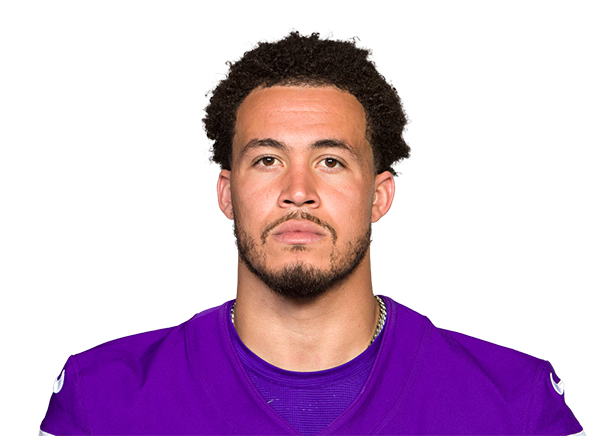
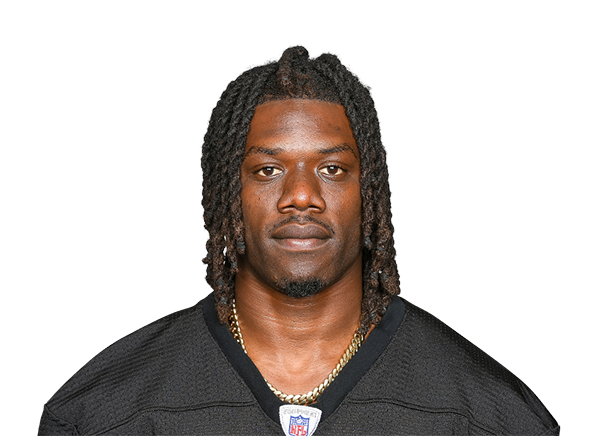
ExpectedEvery game →Depth chart rank 1, adjusted for the injury report. Kickoff Sun, Nov 29, 1 PM ET.

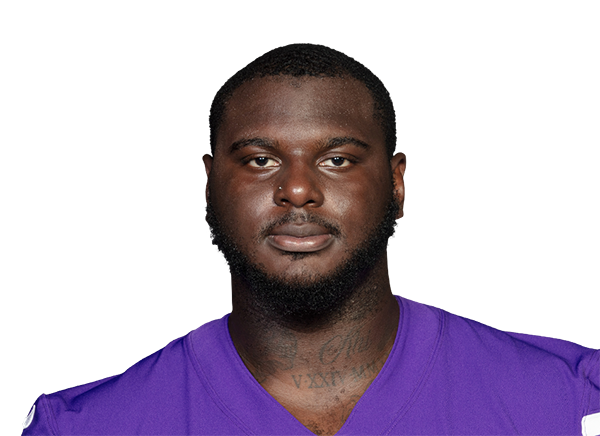
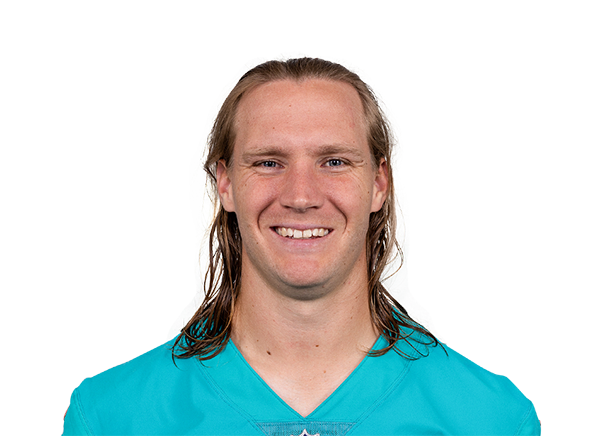
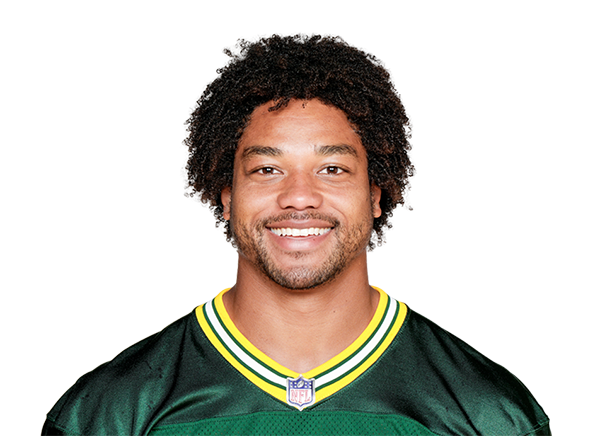
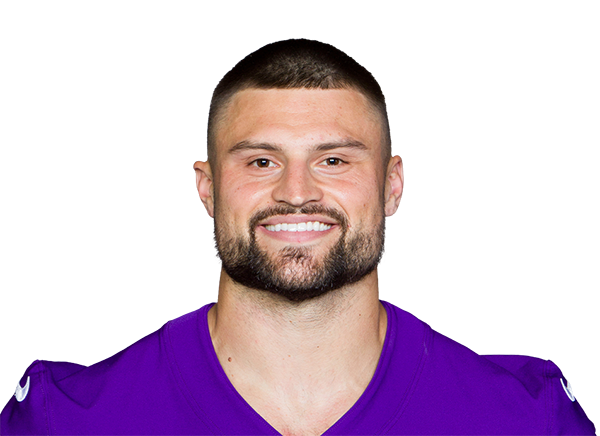
Context
Rest & travel, all 32 →Travel & rest
Travel & rest boardAwayFalconsLast: Sun wk 10 vs KC · 12,887 mi flown this season
HomeVikingsLast: Sun wk 11 at SF · Mexico City · 6,529 mi flown this season
Teams with more rest than their opponent are 34-12 in 2026 (46 games). Off a bye: 13-1 (14 games, small sample). All travel splits →
 GB
 PHI
 HOU
 CLE
 NYG
 TEN
 JAX
 SEA
 WSH
 CAR