InjuryC.J. Henderson: Active → Cleared7 min ago
 InjuryJohn Simpson: Active → Cleared7 min ago
 ESPNJets 'stand pat' at NFL trade deadline
 Las Vegas RaidersFernando Mendoza, nombrado quarterback titular de los Raiders
 Minnesota VikingsNFL Power Rankings: Vikings Week 9 Loss to Bills Nudges Minnesota Down in Lists
 Pro Football RumorsSteelers Soured On Calvin Ridley; Pursued Brian Thomas Jr., Josh Downs
 Seattle SeahawksSeahawks Mailbag: Trade Deadline, Drew Lock & More
 Jacksonville JaguarsJaguars GM James Gladstone: "This Is About Team Building…"
 InjuryShy Tuttle: Questionable → Active1 h ago
 Buffalo Bills'A difference maker' | Bills GM Brandon Beane details how Amani Hooker trade went down and how he'll fit
 ESPNFrom 2-7 to 6-2: Josh Downs reacts to Chiefs trade with Vince Carter GIF
 InjuryCarl Granderson: Active → Cleared2 h ago
Week 9 · 2026Giants 19 · 11 Eagles
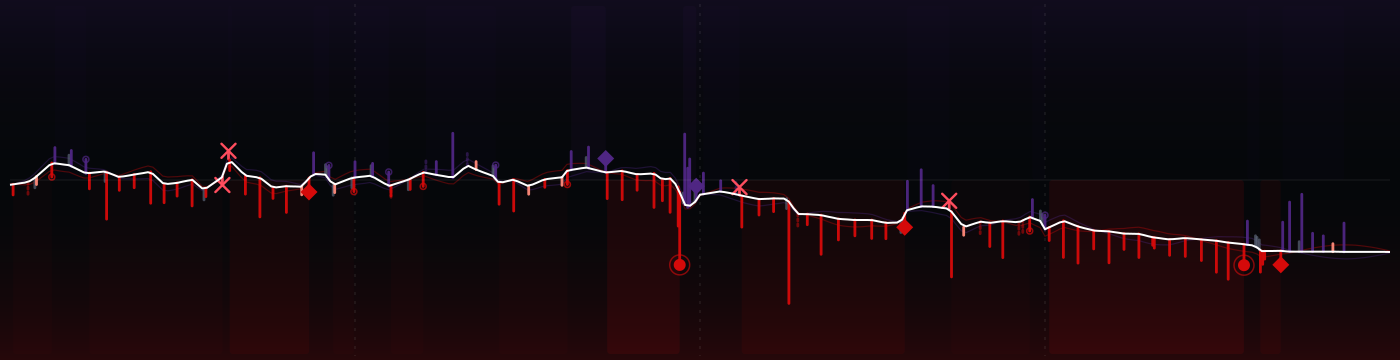
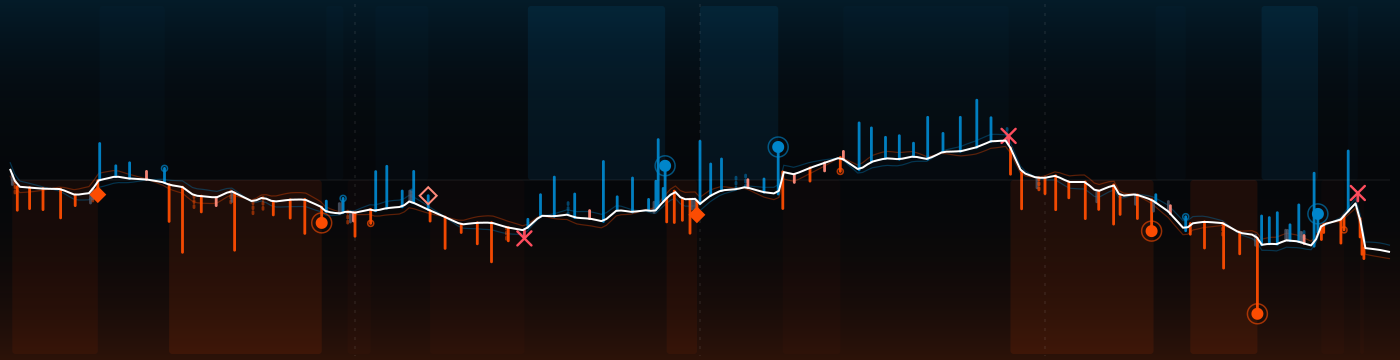
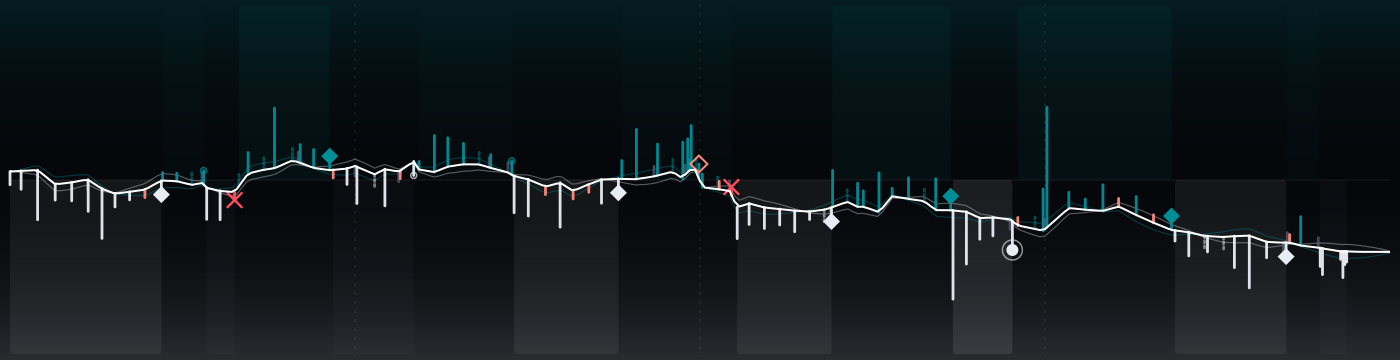
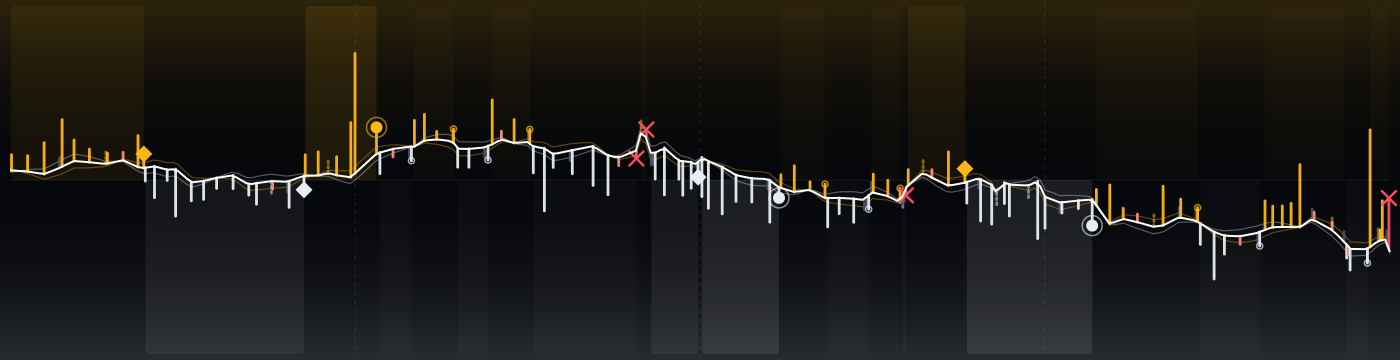
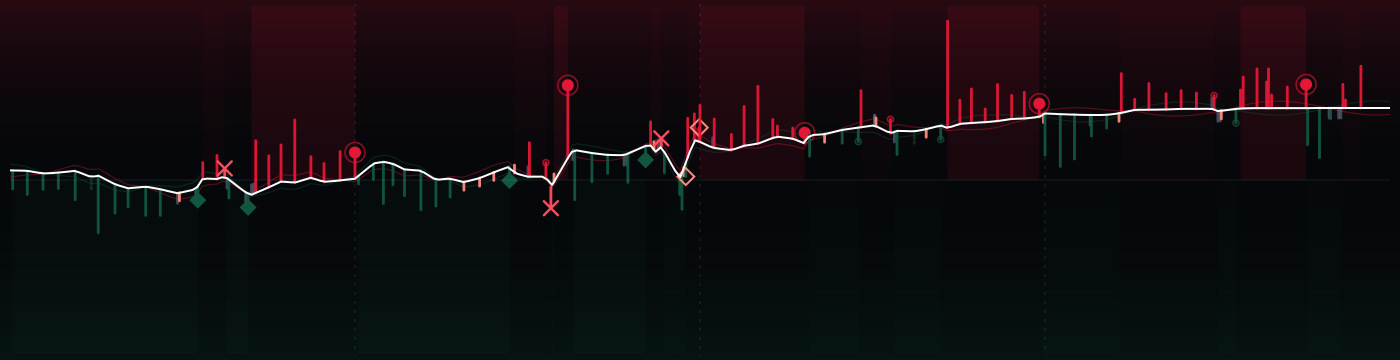
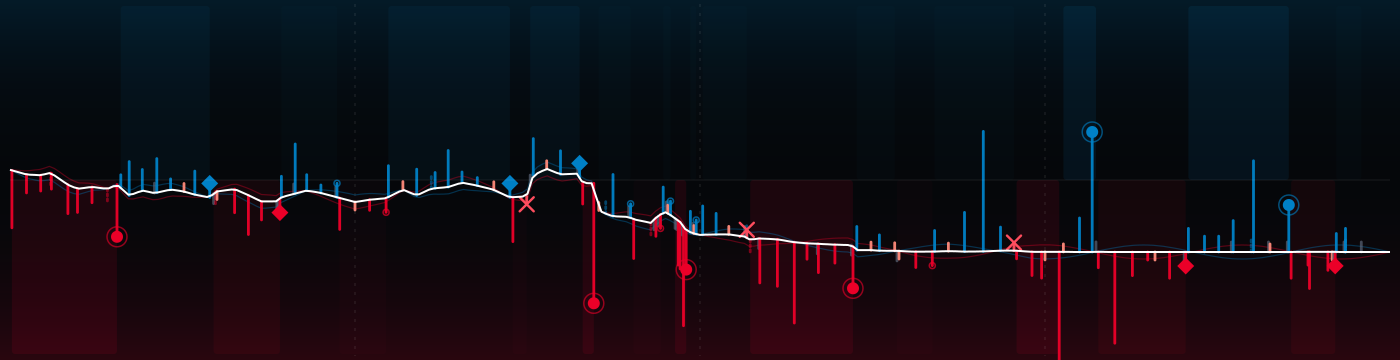
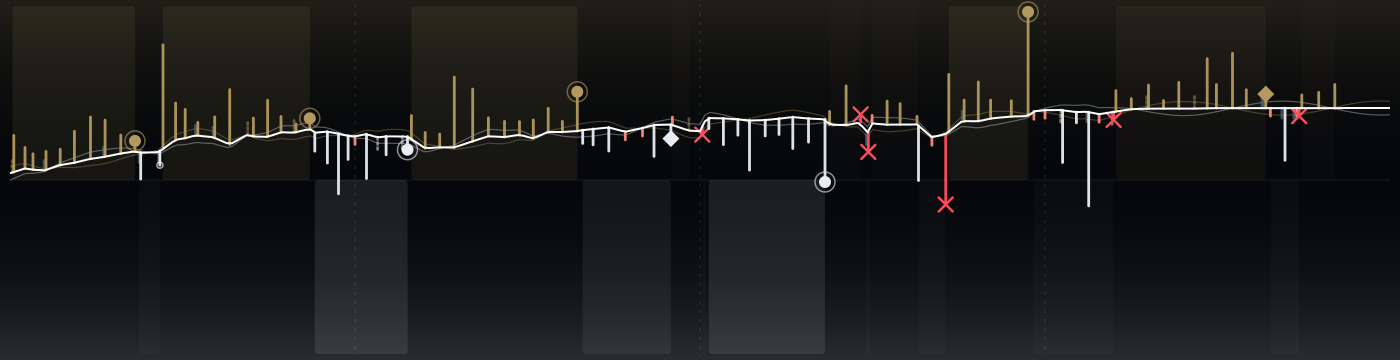
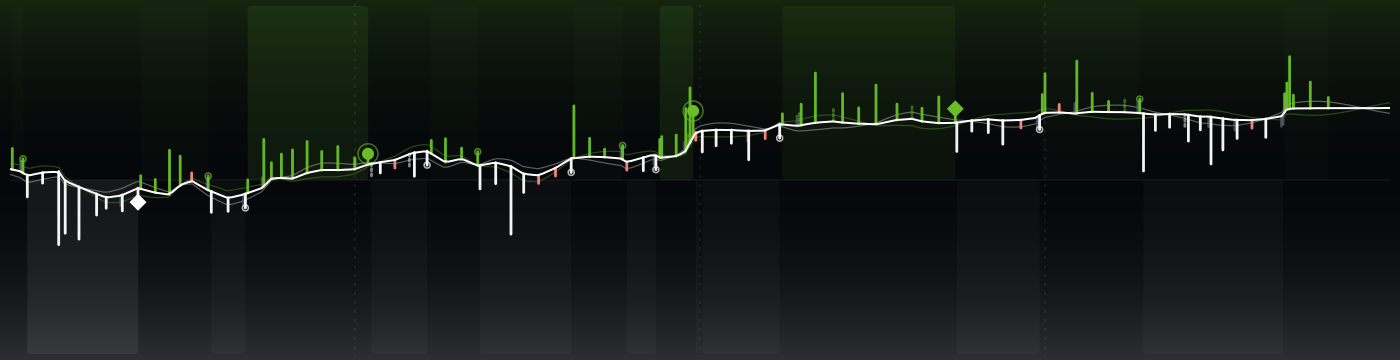
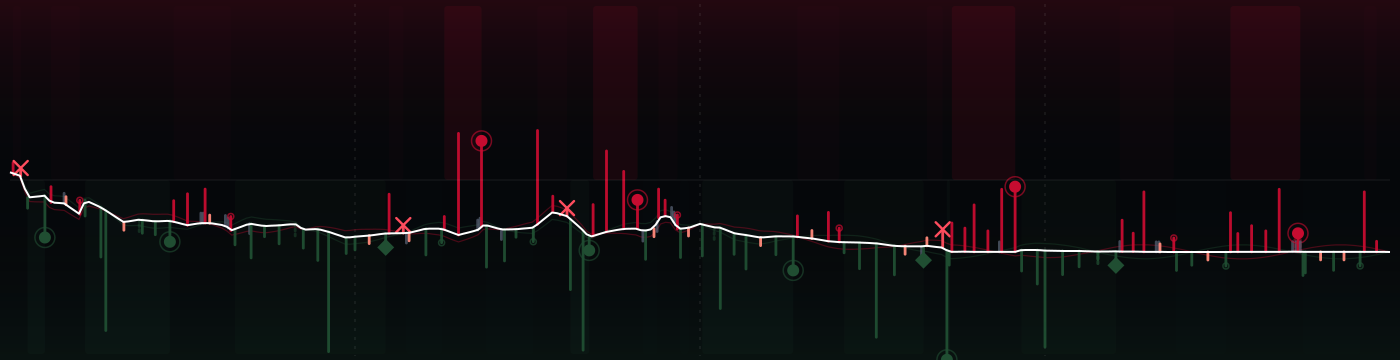
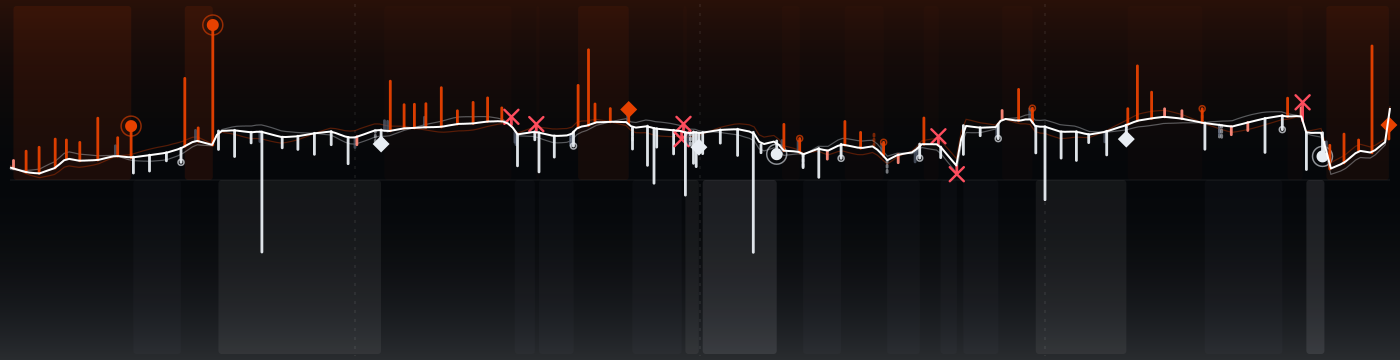
156 plays, one strand. Giants won after 2 lead changes; Giants peaked at 98% to win, Eagles at 76%. The white spine is the win probability, every rung a snap: up for PHI, down for NYG, as long as the yards it gained.
↳Bottom line2 lead changes; Giants peaked at 98% to win, Eagles at 76%.
?How to read this chart
- Read it left to right:
- kickoff on the left, final whistle on the right.
- The white line
- is the chance that Eagles win, play by play. High = PHI in control, low = NYG in control, the middle is a coin flip. Each crossing of the middle is a change in who was more likely to win.
- Each little bar is one play:
- up for PHI on offense, down for NYG; the longer the bar, the more yards. The key under the picture explains the marks (touchdown, turnover, field goal, punt).
 Eagles ↑
 Giants ↓
The strands compared
?How to read this chart
- Each row compares the two teams
- on one stat: NYG on the left, PHI on the right. The longer bar is the bigger number.
- Explosive plays
- are long gains (big runs and passes). Peak win prob. is the highest chance to win each team reached at any moment.
Every possession
?How to read this chart
- Each tile is one possession,
- in game order, colored by the team that had the ball.
- Inside:
- the team, how it ended (TD = touchdown, FG = field goal, INT = interception, FUM = fumble, otherwise punt or downs) and the yards gained. Brighter tiles are drives that scored.
The plays that moved it most
↳Bottom lineThe biggest swing: play 1, 2.9 expected points for Giants.
?How to read this chart
- The strip is the game clock;
- each numbered dot is one of the plays below, placed when it happened and colored by the team on offense.
- EP (expected points)
- is how many points the play added to (+) or took away from (−) the offense's expected score. +3.5 EP is worth more than a field goal; big minus numbers are usually turnovers.
- 1Q1 13:32 · NYG · Completion+2.9 EP
18-J.McCarthy pass short right to 9-I.Likely pushed ob at PHI 48 for 27 yards (24-A.Mukuba) [97-M.Ojomo].
- 2Q1 12:01 · NYG · Completion+2.9 EP
18-J.McCarthy pass short left to 17-D.Mooney ran ob at PHI 33 for 17 yards.
- 3Q1 7:41 · NYG · Completion+2.7 EP
18-J.McCarthy pass deep left to 1-M.Nabers to PHI 27 for 22 yards (24-A.Mukuba). Penalty on PHI-27-Q.Mitchell, Defensive Holding, declined.
- 4Q2 14:21 · PHI · Punt+4.8 EP
10-B.Mann punts 44 yards to NYG 42, Center-41-R.Underwood. 89-C.Jones MUFFS catch, RECOVERED by PHI-41-R.Underwood at NYG 47. Penalty on NYG
- 5Q2 13:37 · PHI · Fumble lost−4.6 EP
14-J.Milton sacked at 50 for -8 yards (52-A.Reese). FUMBLES (52-A.Reese) [52-A.Reese], RECOVERED by NYG-41-M.McFadden at 50.
- 6Q2 2:00 · PHI · Run−2.9 EP
26-S.Barkley up the middle to NYG 41 for -1 yards (8-J.Holland).
- 7Q3 9:00 · NYG · Completion+2.9 EP
19-J.Winston pass short right to 88-M.Fields pushed ob at NYG 35 for 16 yards (2-T.Woolen).
- 8Q4 6:53 · PHI · Punt−2.9 EP
10-B.Mann to PHI 28 for -14 yards. FUMBLES, and recovers at PHI 21. 10-B.Mann punts -2 yards to PHI 40, out of bounds. PENALTY on PHI-80-D.C
The one play that could have changed it
?How to read this chart
- The line is win probability
- over the game (top = home team ahead). The dot marks the one play that could have gone either way; the big % is the losing team's chance right after it.
- Press Flip it
- to see where that chance would have gone if the play had gone the other way. Only that instant is priced: the rest of the game never happened.
If the Eagles had recovered that fumble
Q4 12:42 18-J.McCarthy pass short left to 1-M.Nabers to PHI 41 for 6 yards (27-Q.Mitchell, 54-J.Trotter). FUMBLES (54-J.Trotter), and recovers at PHI 42.

 34@17
 22@23
 27@23

 26@21

 19@9

 20@13
 44@22


 3@17
 45@27

 24@27