InjuryChig Okonkwo: Questionable → Activejust now
 InjuryCharlie Jones: Questionable → Active16 min ago
 InjuryCarl Granderson: Active → Cleared16 min ago
 Las Vegas RaidersFernando Mendoza named Raiders' starting quarterback
 Cleveland BrownsBrowns announce unofficial depth chart for Week 10 vs. the Texans
 Pro Football RumorsVikings Had Interest In Justin Herbert, Daniel Jones, Geno Smith
 Los Angeles RamsFirst Look: Rams take on Cardinals in Arizona in Week 10 riding three-game win streak
 Seattle SeahawksHow To Watch, Listen And Follow Seahawks at Raiders In Week 10 On Sunday, November 15
 ESPNFalcons trade center Ryan Neuzil to Ravens for guard Andrew Vorhees, pick
 Vikings DeskVikings lose by 17 and the snaps say it should have been worse1 h ago
 ESPNNFL trade deadline grades: Deals for Kirk Cousins, Josh Downs, Daiyan Henley
 San Francisco 49ers49ers Place DL Gracen Halton on Injured Reserve
Week 6 · 2026Panthers 25 · 14 Eagles
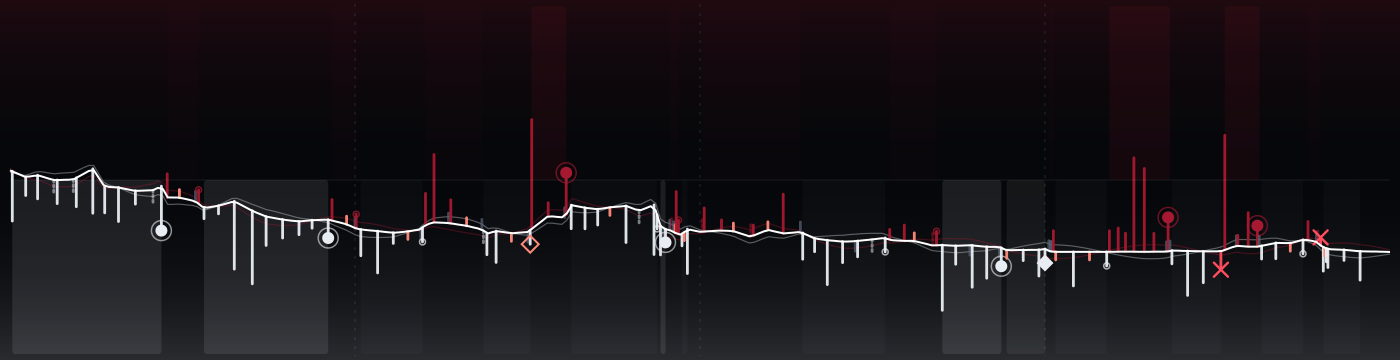
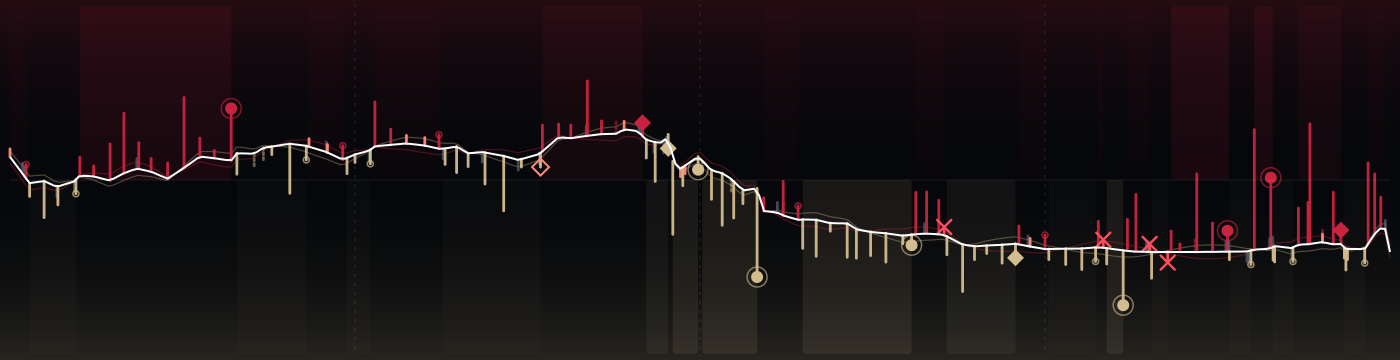
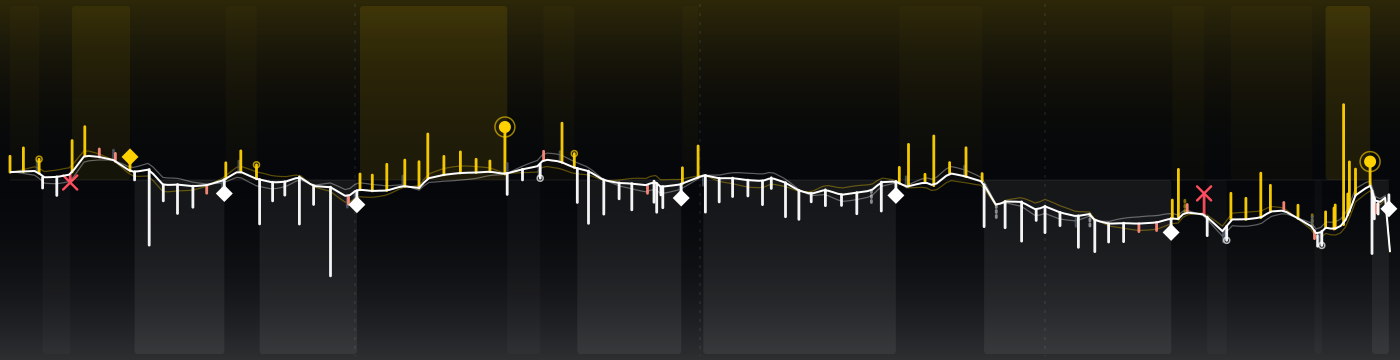
163 plays, one strand. Panthers won without the lead ever changing hands; Panthers peaked at 100% to win, Eagles at 55%. The white spine is the win probability, every rung a snap: up for PHI, down for CAR, as long as the yards it gained.
↳Bottom lineThe lead never changed hands; Panthers peaked at 100% to win, Eagles at 55%.
?How to read this chart
- Read it left to right:
- kickoff on the left, final whistle on the right.
- The white line
- is the chance that Eagles win, play by play. High = PHI in control, low = CAR in control, the middle is a coin flip. Each crossing of the middle is a change in who was more likely to win.
- Each little bar is one play:
- up for PHI on offense, down for CAR; the longer the bar, the more yards. The key under the picture explains the marks (touchdown, turnover, field goal, punt).
 Eagles ↑
 Panthers ↓
The strands compared
?How to read this chart
- Each row compares the two teams
- on one stat: CAR on the left, PHI on the right. The longer bar is the bigger number.
- Explosive plays
- are long gains (big runs and passes). Peak win prob. is the highest chance to win each team reached at any moment.
Every possession
?How to read this chart
- Each tile is one possession,
- in game order, colored by the team that had the ball.
- Inside:
- the team, how it ended (TD = touchdown, FG = field goal, INT = interception, FUM = fumble, otherwise punt or downs) and the yards gained. Brighter tiles are drives that scored.
The plays that moved it most
↳Bottom lineThe biggest swing: play 1, 2.7 expected points for Panthers.
?How to read this chart
- The strip is the game clock;
- each numbered dot is one of the plays below, placed when it happened and colored by the team on offense.
- EP (expected points)
- is how many points the play added to (+) or took away from (−) the offense's expected score. +3.5 EP is worth more than a field goal; big minus numbers are usually turnovers.
- 1Q2 8:33 · CAR · Completion+2.7 EP
9-B.Young pass short middle to 4-T.McMillan to PHI 24 for 16 yards (53-Z.Baun; 11-J.Campbell). PENALTY on PHI-90-J.Davis, Roughing the Passe
- 2Q2 5:14 · PHI · Completion+2.2 EP
16-T.McKee pass short middle to 6-D.Smith to CAR 40 for 16 yards (20-Z.Wheatley).
- 3Q3 4:27 · CAR · Completion+3.3 EP
9-B.Young pass short middle to 18-J.Coker to CAR 42 for 32 yards (24-A.Mukuba).
- 4Q3 1:03 · CAR · Run+2.9 EP
73-S.Forsythe reported in as eligible. 30-C.Hubbard left tackle to PHI 12 for 19 yards (54-J.Trotter).
- 5Q4 10:48 · PHI · Touchdown+2.7 EP
16-T.McKee pass deep right to 6-D.Smith for 19 yards, TOUCHDOWN.
- 6Q4 6:39 · CAR · Touchdown+2.5 EP
9-B.Young pass deep middle to 82-T.Tremble for 19 yards, TOUCHDOWN. PENALTY on CAR-82-T.Tremble, Taunting, 15 yards, enforced between downs.
- 7Q4 4:32 · PHI · Incomplete−2.2 EP
16-T.McKee pass incomplete deep right to 6-D.Smith (20-Z.Wheatley).
- 8Q4 4:07 · CAR · Completion+2.2 EP
9-B.Young pass short left to 83-D.Moore to PHI 13 for 27 yards (94-B.Young).
The one play that could have changed it
?How to read this chart
- The line is win probability
- over the game (top = home team ahead). The dot marks the one play that could have gone either way; the big % is the losing team's chance right after it.
- Press Flip it
- to see where that chance would have gone if the play had gone the other way. Only that instant is priced: the rest of the game never happened.
If the Eagles had stopped that fourth-and-1
Q3 1:03 73-S.Forsythe reported in as eligible. 30-C.Hubbard left tackle to PHI 12 for 19 yards (54-J.Trotter).

 34@31


 31@23


 26@19

 26@20

 18@16
 33@30
 6@22
 13@23