 Texans DeskTexans earned 44-22 win over Chargers, and the snaps say it was no fluke20 min ago
 Panthers DeskPanthers outplayed Denver and lost 26-21 on a late strip sack30 min ago
 Lions DeskLions earned 19-9 in Miami, with a defense doing the work and a thin offense40 min ago
 Cincinnati BengalsHow To Watch Steelers vs Bengals on Sunday Night Football: TV, Streaming and Radio Information
 Atlanta FalconsKevin Stefanski says 'all of us have to step up' after Jessie Bates trade
 ESPNWill Daniel Jones become a Minnesota Vikings player today?
 ESPNCommanders running low on time to 'put it all together'
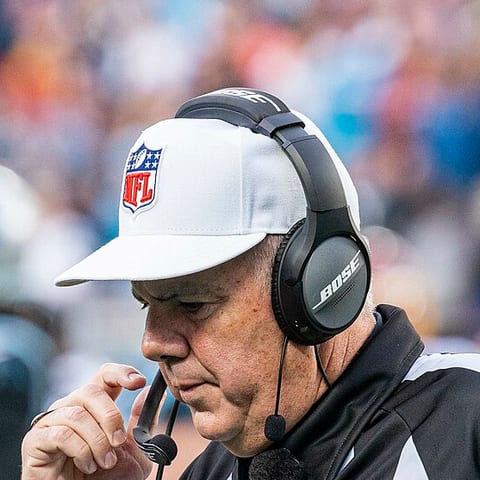
Officiating crew ofBill Vinovich
7 games in 2026. 13.9 accepted flags a game against a league average of 14.7 (12th most of 18 crews), 108.9 penalty yards, and 45% of the flags on the home team.
Every game this crew worked
↳Bottom line3 of 7 games above the league average; 45% of this crew's flags went against the home team.
?How to read this chart
- One bar = one game
- as tall as the accepted flags in it; the number on top is the total, in yellow when it beats the league average.
- Yellow and grey
- yellow = flags against the home team, grey = against the away team; the small numbers inside are the split.
- Dashed line
- the league average, 14.7 flags a game. Under the bar: away @ home, week and final score. Tap a game to open it.
What this crew calls
↳Bottom lineTheir signature call: defensive too many men on field, ×3.9 the league rate.
?How to read this chart
- One row per penalty type.
- The center line is the league rate per game.
- Bar to the right (×1.5, ×2.0…):
- this crew calls it more often than the league; ×2.0 = twice as often.
- Bar to the left (×0.5…):
- calls it less often; ×0.5 = half as often. Few games, so treat single rows as hints, not proof.
The crew
- Bill VinovichReferee
- Todd PrukopBack Judge
- Frank LeBlancDown Judge
- Jimmy BuchananSide Judge · 6 of 7
- Aaron SantiField Judge · 6 of 7
- Brian BolingerLine Judge · 6 of 7
- Scott CampbellUmpire · 6 of 7
Biggest swing
8-R.Sanchez punt is BLOCKED by 36-J.Chestnut, Center-46-L.Rhodes, RECOVERED by TEN-7-O.Oladejo at IND 14. 7-O.Oladejo for 14 yards, TOUCHDOWN. IND-8-R.Sanchez was injured during the play. PENALTY on TEN, Unsportsmanlike Conduct, 15 yards, enforced between downs.
Bill Vinovich, every season
↳Bottom lineOver his career, Bill Vinovich calls −1.4 flags a game below the season average; home teams won 53% of his games (league 56%).
?How to read this chart
- The tiles:
- career totals: games, flags a game compared with each season's average (+ = more), how often the home team won and covered the spread, how often games went over the betting total, and the share of flags on the home team, each next to the league figure.
- The bars:
- one per season. Up (yellow) = he called more flags a game than the league did that year; down (blue) = fewer. Taller = further from average. Comparing with each year matters because flag rates change with the rules.
- The four boxes below:
- pass interference, holding, roughing and pre-snap fouls, per game above (+) or below (−) the season average.
Who they worked
 Chargers1 game · 8.0 flags a game against
 Raiders1 game · 6.0 flags a game against
 Broncos1 game · 5.0 flags a game against
 Rams1 game · 13.0 flags a game against
 Bills1 game · 5.0 flags a game against
 Patriots1 game · 5.0 flags a game against
 Jets1 game · 10.0 flags a game against
 Browns1 game · 6.0 flags a game against
 Colts1 game · 5.0 flags a game against
 Titans1 game · 8.0 flags a game against
 Saints1 game · 5.0 flags a game against
 Steelers1 game · 6.0 flags a game against
 Eagles1 game · 6.0 flags a game against
 Giants1 game · 9.0 flags a game against