 InjuryAlec Anderson: Out → Questionable27 min ago
 Pro Football RumorsVikings Expected To Explore QB Trade
 Detroit LionsTWENTYMAN: 5 stats that stand out following Lions' Week 9 victory
 ESPNSeven things Solak thinks for NFL Week 10: Jaguars trades, All-Pro picks, more
 Pittsburgh SteelersAsked and Answered: Nov. 10
 ESPNCommanders running low on time to 'put it all together'
 Philadelphia EaglesAAA Official Review: What did the Eagles, Joe Milton learn from the QB's first start?
 Broncos DeskBroncos are 7-2, but the snaps say 4.1 wins and the 11th seed in the conference7 h ago
The LabEvery officiating crew, by the numbers
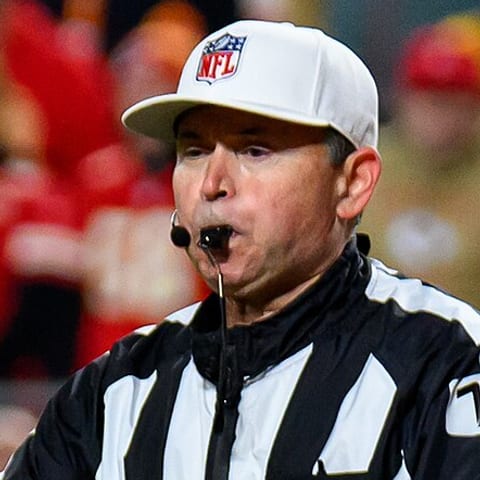
Officiating crew ofBrad Allen
8 games in 2026. 15 accepted flags a game against a league average of 14.7 (6th most of 18 crews), 110.3 penalty yards, and 54% of the flags on the home team.
Flags a game15.0league 14.7
Yards a game110.3league 118
Win prob. moved40 ptsleague 39
Late flags2.754th quarter, one-score games
TDs erased4touchdowns wiped by a flag
Game by game
Every game this crew worked
8 games, 15 accepted flags a game against a league average of 14.7.
↳Bottom line4 of 8 games above the league average; 54% of this crew's flags went against the home team.
?How to read this chart
- One bar = one game
- as tall as the accepted flags in it; the number on top is the total, in yellow when it beats the league average.
- Yellow and grey
- yellow = flags against the home team, grey = against the away team; the small numbers inside are the split.
- Dashed line
- the league average, 14.7 flags a game. Under the bar: away @ home, week and final score. Tap a game to open it.
Against the league
What this crew calls
Neutral Zone Infraction×1.6
Kickoff Short of Landing Zone×1.5
Offensive Pass Interference×1.5
Defensive Offside×1.4
Illegal Block Above the Waist×0.4
Delay of Game×0.4
Illegal Contact×0.5
↳Bottom lineTheir signature call: neutral zone infraction, ×1.6 the league rate.
?How to read this chart
- One row per penalty type.
- The center line is the league rate per game.
- Bar to the right (×1.5, ×2.0…):
- this crew calls it more often than the league; ×2.0 = twice as often.
- Bar to the left (×0.5…):
- calls it less often; ×0.5 = half as often. Few games, so treat single rows as hints, not proof.
On the field
The crew
- Brad AllenReferee
- Chad HillSide Judge
- Walter FlowersLine Judge
- Marcus WoodsUmpire
- Sarah ThomasDown Judge · 7 of 8
- Anthony FlemmingField Judge · 7 of 8
- Tyree WaltonBack Judge · 7 of 8
The flag that mattered most
Biggest swing
Roughing the Passer on NYJ, Week 7, Q4 4:55
2-M.Willis pass short left to 7-C.Douglas for 63 yards, TOUCHDOWN. PENALTY on NYJ-21-B.Stephens, Roughing the Passer, 8 yards, enforced between downs.
The career · 2014 to today
Brad Allen, every season
Regular season and playoffs since 2014, compared with each season's average and with the league. All referees since 1999
↳Bottom lineOver his career, Brad Allen calls −0.5 flags a game below the season average; home teams won 56% of his games (league 56%).
?How to read this chart
- The tiles:
- career totals: games, flags a game compared with each season's average (+ = more), how often the home team won and covered the spread, how often games went over the betting total, and the share of flags on the home team, each next to the league figure.
- The bars:
- one per season. Up (yellow) = he called more flags a game than the league did that year; down (blue) = fewer. Taller = further from average. Comparing with each year matters because flag rates change with the rules.
- The four boxes below:
- pass interference, holding, roughing and pre-snap fouls, per game above (+) or below (−) the season average.
Games since 20141957 playoff games
Flags vs the season−0.512 accepted flags a game
Home teams won56%league 56%
Home teams covered52%league 49%
Went over the total47%league 49%
Flags on the home team47%league 48%
Pass interference−0.02a game vs the seasonHolding−0.11a game vs the seasonRoughing−0.04a game vs the seasonPre-snap fouls−0.22a game vs the season
Teams
Who they worked
 Ravens2 games · 6.0 flags a game against
 Panthers1 game · 11.0 flags a game against
 Bears1 game · 12.0 flags a game against
 Rams1 game · 6.0 flags a game against
 Giants1 game · 3.0 flags a game against
 49ers1 game · 7.0 flags a game against
 Cardinals1 game · 10.0 flags a game against
 Texans1 game · 13.0 flags a game against
 Cowboys1 game · 6.0 flags a game against
 Falcons1 game · 7.0 flags a game against
 Jets1 game · 6.0 flags a game against
 Dolphins1 game · 5.0 flags a game against
 Bengals1 game · 8.0 flags a game against
 Titans1 game · 10.0 flags a game against
 Jaguars1 game · 4.0 flags a game against