 Green Bay PackersMike's Mid-Week Chat | Nov. 11, 2026
 49ers Desk49ers lean on McCaffrey's short targets as the early-down pass rate drops to 41%6 min ago
 InjuryGarrett Wilson: Out → Questionable11 min ago
 InjuryLucas Patrick: Doubtful → Out11 min ago
 Pro Football RumorsGM Mike Borgonzi: Titans Would ‘Love To Have’ Tony Pollard Back In 2027
 New Orleans SaintsGame Preview: Panthers vs. Saints | 2026 NFL Week 10
 Texans DeskTexans offense posts its best EPA per play of the year in Week 926 min ago
 Rams DeskRams pass on 58% of early downs again after a 41% week, and Puka Nacua feeds on it27 min ago
 Panthers DeskCarolina's offense rebounds in Week 9 after two negative-EPA games36 min ago
 Falcons DeskFalcons' eighth-ranked run game has slipped as the offense sits 25th37 min ago
 Kansas City ChiefsCinco cosas que debes saber sobre Josh Downs, el nuevo receptor de Chiefs
 InjuryDenzel Boston: Active → Questionable43 min ago
 Eagles DeskEagles run defense ranks 31st while the offense stalls at a 24% success rate46 min ago
 Baltimore RavensMailbag: Will Jacoby Brissett Turn the Ravens' Season Around?
 Buccaneers DeskBuccaneers defense leads the league in EPA allowed while the passing game ranks 30th56 min ago
Compare players
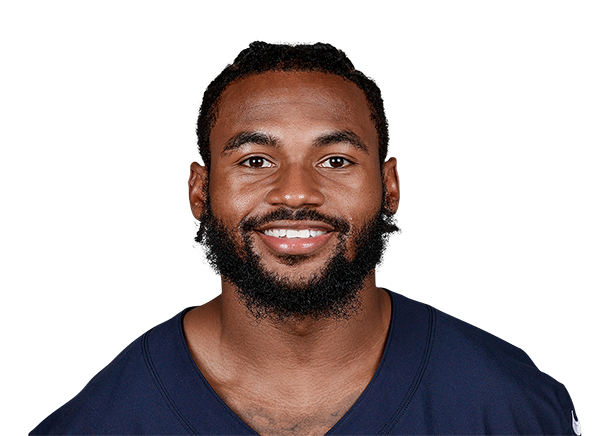 D'Andre SwiftRB · CHI
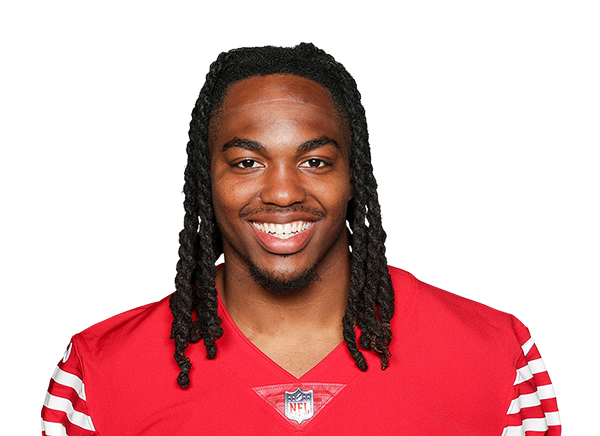 Jordan MasonRB · MIN
 Chicago Bears
D'Andre Swift
Georgia · 2020 draft, round 2, pick 35
 Minnesota Vikings
Across the 8 shown metrics with numbers for at least two players (2026 season, per opportunity): Swift leads in 6 and Mason leads in 2. A count of who is ahead, not a verdict: the metrics overlap and do not weigh the same.
Usage
SwiftMasonPercentile chips: vs 92 RBs who played half the games, 2026 season
Rushing
SwiftMasonPercentile chips: vs 54 RBs who have 4.5+ carries a week, 2026 season
Receiving
SwiftMasonPercentile chips: vs 20 RBs who have 2.5+ targets a week (tight ends 2+), 2026 season
Advanced metrics14 more · tap to open
Usage
Rushing
Receiving
Advanced rows are not part of the “metrics led” count. Pick exactly what you want under “Choose”.
Expected points added across every role (passing, rushing, receiving) in the nflverse play-by-play model, in the period you picked. Lines run the total; a missing bar is a week without plays. The dot marks the best week among the 2 players.
Matchups to start with
top passers · most targetedBox score totals from ESPN (regular season and playoffs; “last 4” is each player's four most recent games with a box score line). EPA, success rate, CPOE, aDOT, target and air-yard share from the nflverse play-by-play over the same games; snap share from nflverse snap counts. EPA per dropback includes sacks and scrambles. Carries are the official ESPN rush attempts; EPA per designed run leaves out quarterback scrambles (they count as dropbacks) and kneel-downs, so for a quarterback the two counts differ. Per opportunity divides counting stats by nflverse dropbacks (passing), ESPN targets (receiving) and ESPN carries (rushing); other counts go per game. Percentiles rank each value among players at the same position with enough volume in the same period (the same groups as the player cards: QBs 12 dropbacks a week, RBs 4.5 carries, wide receivers 2.5 targets, tight ends 2, defenders half the games; fewer than 8 peers, no percentile). The bars compare the players on the page only, not the league.